. 2019 Mar 4;9(1):3402.
doi: 10.1038/s41598-019-39677-2.

In vivo investigation of hyperpolarized [1,3-13C2]acetoacetate as a metabolic probe in normal brain and in glioma

Affiliations

In vivo investigation of hyperpolarized [1,3-13C2]acetoacetate as a metabolic probe in normal brain and in glioma

Chloé Najac et al. Sci Rep. .

Abstract

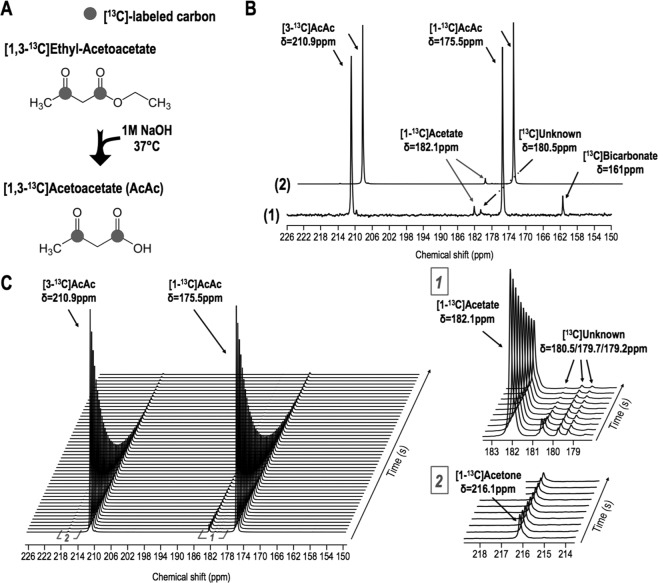
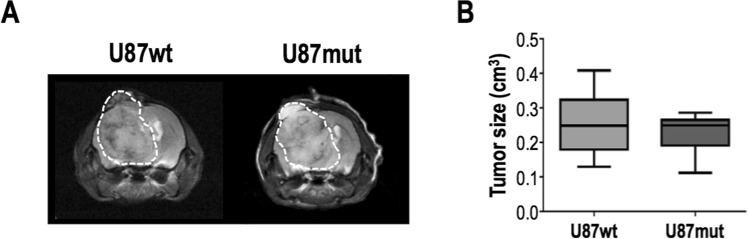
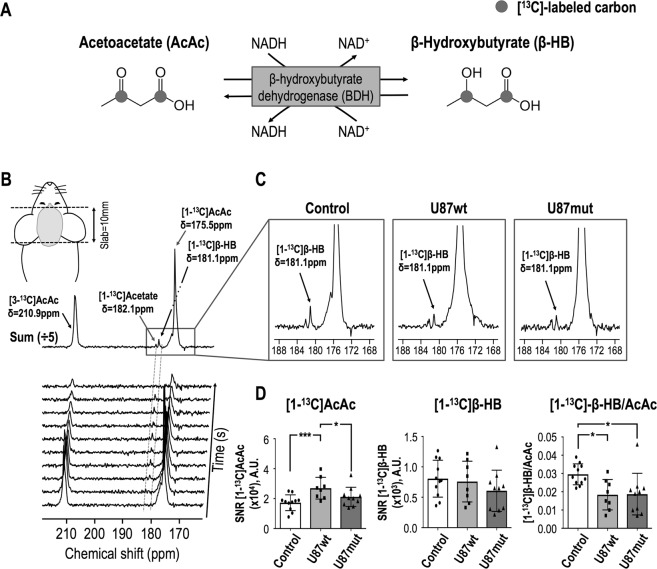
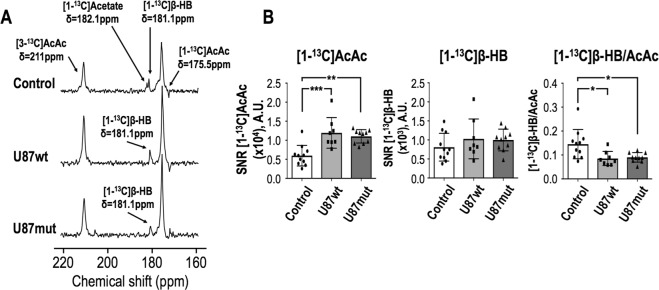
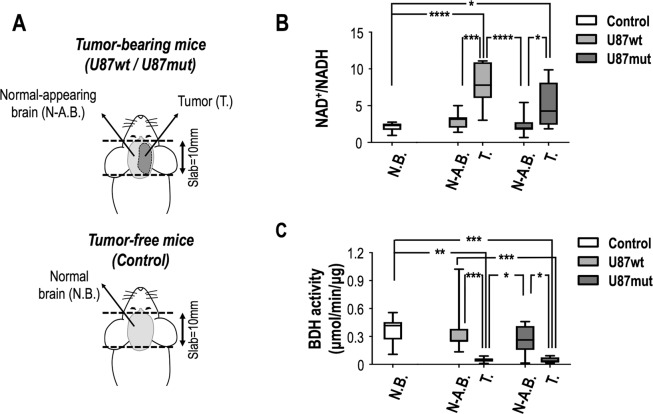
Dysregulation in NAD+/NADH levels is associated with increased cell division and elevated levels of reactive oxygen species in rapidly proliferating cancer cells. Conversion of the ketone body acetoacetate (AcAc) to β-hydroxybutyrate (β-HB) by the mitochondrial enzyme β-hydroxybutyrate dehydrogenase (BDH) depends upon NADH availability. The β-HB-to-AcAc ratio is therefore expected to reflect mitochondrial redox. Previous studies reported the potential of hyperpolarized 13C-AcAc to monitor mitochondrial redox in cells, perfused organs and in vivo. However, the ability of hyperpolarized 13C-AcAc to cross the blood brain barrier (BBB) and its potential to monitor brain metabolism remained unknown. Our goal was to assess the value of hyperpolarized [1,3-13C2]AcAc in healthy and tumor-bearing mice in vivo. Following hyperpolarized [1,3-13C2]AcAc injection, production of [1,3-13C2]β-HB was detected in normal and tumor-bearing mice. Significantly higher levels of [1-13C]AcAc and lower [1-13C]β-HB-to-[1-13C]AcAc ratios were observed in tumor-bearing mice. These results were consistent with decreased BDH activity in tumors and associated with increased total cellular NAD+/NADH. Our study confirmed that AcAc crosses the BBB and can be used for monitoring metabolism in the brain. It highlights the potential of AcAc for future clinical translation and its potential utility for monitoring metabolic changes associated with glioma, and other neurological disorders.


Conflict of interest statement

The authors declare no competing interests.

Figures

Figure 1
Figure 1
Characterization of the hyperpolarized probe, [1,3-13C2]acetoacetate ([1,3-13C2]AcAc). (A) [1,3-13C2]AcAc was prepared by mixing 250 μL of [1,3-13C2]ethyl-AcAc with 4 mL of 1 M NaOH at 37 °C for 24 hours. (B) [1,3-13C2]AcAc thermal equilibrium spectrum (1, NT = 16, x80) and first hyperpolarized spectrum (2, NT = 1) were acquired at 11.7T and showed a ~20% increase in liquid-state polarization level by the dissolution dynamic nuclear polarization technique (NT = number of transient). Resonances of [1-13C]AcAc (δ[1-13C]AcAc = 175.5 ppm), [3-13C]AcAc (δ[3-13C]AcAc = 210.9 ppm) and 13C-contaminants (δ[1-13C]Acetate = 182.1 ppm, δ[13C]Unknown = 180.5 ppm and δ[13C]Bicarbonate = 161 ppm) were detectable. (C) Stack plot of 13C MR spectra of hyperpolarized [1,3-13C2]AcAc in solution acquired at 11.7T showing decay of the hyperpolarized signals as a function of time (temporal resolution 3 sec). Resonances of [1-13C]AcAc (δ[1-13C]AcAc = 175.5 ppm), [3-13C]AcAc (δ[3-13C]AcAc = 210.9 ppm) and 13C-contaminants (δ[1-13C]Acetate = 182.1 ppm, δ[13C]Unknown = 180.5, 179.7, 179.2 ppm and δ[1-13C]Acetone = 216.1 ppm) were detectable.
Figure 2
Figure 2
Tumor size quantification. (A) Representative T2-weighted images acquired on a 14.1T MRI scanner of U87wt (left) and U87mut (right) tumor-bearing mice and (B) corresponding tumor size quantification at time of the hyperpolarized experiments.
Figure 3
Figure 3
Representative hyperpolarized 13C data from 1D slab dynamic acquisitions acquired on a 14.1T MRI scanner. (A) [1,3-13C2]AcAc metabolism, showing conversion into [1,3-13C2]β-HB mediated by the β-hydroxybutyrate dehydrogenase (BDH) enzyme with NADH as a co-factor. (B) Stack plot of hyperpolarized 13C data acquired from a 1D 10 mm-thick slab (FA = 20°) covering the whole brain of a control mouse (tumor-free), showing decay of hyperpolarized [3-13C]AcAc (δ[3-13C]AcAc = 210.9 ppm) and [1-13C]AcAc (δ[1-13C]AcAc = 175.5 ppm) and production of hyperpolarized [1-13C]β-HB (δ[1-13C]β-HB = 181.1 ppm) as a function of time (time resolution 4 sec). Hyperpolarized acquisitions were started 10 sec after the beginning of the hyperpolarized injection (350 μL of [1,3-13C2]AcAc injected over 12 sec). All dynamic data were summed. Resonances of [1-13C]AcAc and [1-13C]β-HB were fitted with a Lorentzian-Gaussian line shape using MestreNova for each animal and integrals of the fits normalized to SD of the noise were quantified. (C) Representative hyperpolarized 13C data obtained from the sum of all dynamic data from a control mouse (left), U87wt-bearing mouse (middle) and U87mut-bearing mouse (right), showing that hyperpolarized [1-13C]β-HB production could be detected in all three groups. (D) Quantification of [1-13C]AcAc and [1-13C]β-HB levels and ratio of [1-13C]β-HB-to-[1-13C]AcAc. A significant increase in [1-13C]AcAc level in U87wt tumor-bearing mice and control mice and between U87wt and U87mut tumor-bearing mice was observed. A significant decrease in [1-13C]β-HB-to-[1-13C]AcAc ratio in both tumor models compared to normal mice was detected. No difference between U87wt and U87mut tumor-bearing mice was observed. SNR, signal to noise ratio; A.U., arbitrary units; AcAc, acetoacetate; β-HB, β-hydroxybutyrate.
Figure 4
Figure 4
Representative hyperpolarized 13C data from 1D slab 90° acquisitions acquired on a 14.1T MRI scanner. (A) Representative hyperpolarized 13C data acquired from a 1D 10 mm-thick slab (FA = 90°) in a control mouse (top), U87wt-bearing mouse (middle) and U87mut-bearing mouse (bottom). Signals from hyperpolarized [3-13C]AcAc (δ[3-13C]AcAc = 210.9 ppm), [1-13C]AcAc (δ[1-13C]AcAc = 175.5 ppm) and [1-13C]β-HB (δ[1-13C]β-HB = 181.1 ppm) could be detected in all three groups. Resonances of [1-13C]AcAc and [1-13C]β-HB were fitted with a Lorentzian-Gaussian line shape using MestreNova for each animal and integrals of the fits normalized to SD of the noise were quantified. (B) Quantification of [1-13C]AcAc and [1-13C]β-HB levels and ratio of [1-13C]β-HB-to-[1-13C]AcAc showed a significant increase in [1-13C]AcAc level and a significant decrease in [1-13C]β-HB-to-[1-13C]AcAc ratio in both tumor models compared to normal mice. No difference between U87wt and U87mut tumor-bearing mice was observed. SNR, signal to noise ratio; A.U., arbitrary units; AcAc, acetoacetate; β-HB, β-hydroxybutyrate.
Figure 5
Figure 5
NAD+/NADH ratio and BDH activity quantified by spectrophotometric assays. (A) 1D slab 13C acquisitions were 10 mm-thick and therefore covered the whole brain. In tumor-bearing mice, the slab contained both tumor and normal-appearing brain whereas in tumor-free (control) mice, it contained only normal brain. At sacrifice, both normal-appearing and tumor tissues from tumor-bearing mice and normal brain tissues from control mice were freeze-clamped and kept at −80 °C for spectrophotometric assays. (B) NAD+ and NADH levels were measured and NAD+/NADH ratios were quantified. No differences were observed in NAD+/NADH ratio between control normal brain tissue and tumor-bearing mouse normal-appearing brain tissue and between U87wt and U87mut tumor tissue. A significant increase in NAD+/NADH ratio was observed between controls normal brain and U87wt/U87mut tumor tissues as well as between tumor-bearing normal-appearing brain tissues and U87wt/U87mut tumor tissues. (C) BDH activity from isolated mitochondria was quantified. No differences were observed between controls normal brain tissues and tumor-bearing mice normal-appearing brain tissues. A significant decrease in BDH activity in tumor tissues compared to normal-appearing brain tissues was observed for both tumor models. A significant decrease was measured between U87wt and U87mut tumor tissues and normal brain tissues from healthy controls. N.B., Normal Brain; N-A.B., Normal-Appearing Brain; T., Tumor.

Similar articles

Cited by

References

    1. Ostrom QT, et al. CBTRUS Statistical Report: Primary Brain and Central Nervous System Tumors Diagnosed in the United States in 2008–2012. Neuro Oncol. 2015;17(Suppl 4):iv1–iv62. doi: 10.1093/neuonc/nov189. - DOI - PMC - PubMed
    1. Huse JT, Phillips HS, Brennan CW. Molecular subclassification of diffuse gliomas: seeing order in the chaos. Glia. 2011;59:1190–9. doi: 10.1002/glia.21165. - DOI - PubMed
    1. Louis DN, et al. The 2016 World Health Organization Classification of Tumors of the Central Nervous System: a summary. Acta Neuropathol. 2016;131:803–20. doi: 10.1007/s00401-016-1545-1. - DOI - PubMed
    1. Wen PY, Kesari S. Malignant gliomas in adults. N. Engl. J. Med. 2008;359:492–507. doi: 10.1056/NEJMra0708126. - DOI - PubMed
    1. Claus EB, et al. Survival and low-grade glioma: the emergence of genetic information. Neurosurg. Focus. 2015;38:E6. doi: 10.3171/2014.10.FOCUS12367. - DOI - PMC - PubMed

Publication types