. 2019 May;14(5):465-472.
doi: 10.1038/s41565-019-0392-3. Epub 2019 Mar 4.

Miniature gold nanorods for photoacoustic molecular imaging in the second near-infrared optical window

Affiliations

Miniature gold nanorods for photoacoustic molecular imaging in the second near-infrared optical window

Yun-Sheng Chen et al. Nat Nanotechnol. 2019 May.

Erratum in

Abstract

In photoacoustic imaging, the second near-infrared (NIR-II) window is where tissue generates the least background signal. However, the large size of the few available contrast agents in this spectral range impedes their pharmacokinetics and decreases their thermal stability, leading to unreliable photoacoustic imaging. Here, we report the synthesis of miniaturized gold nanorods absorbing in the NIR-II that are 5-11 times smaller than regular-sized gold nanorods with a similar aspect ratio. Under nanosecond pulsed laser illumination, small nanorods are about 3 times more thermally stable and generate 3.5 times stronger photoacoustic signal than their absorption-matched larger counterparts. These unexpected findings are confirmed using theoretical and numerical analysis, showing that photoacoustic signal is not only proportional to the optical absorption of the nanoparticle solution but also to the surface-to-volume ratio of the nanoparticles. In living tumour-bearing mice, these small targeted nanorods display a 30% improvement in efficiency of agent delivery to tumours and generate 4.5 times greater photoacoustic contrast.


Conflict of interest statement

COMPETING INTERESTS

Dr. Gambhir is co-founder, equity holder, and board member of Endra Inc which develops photoacoustic imaging strategies. The other authors declare no competing financial interests.

Figures

Figure 1.
Figure 1.. Synthesis procedure of small and large AuNRs and size characterization.
(a) Illustration of seed-mediated growth to produce large AuNRs with dimensions of 18 nm by 120 nm. (b) Illustration of seedless growth to produce small AuNRs with dimensions of 8 nm by 49 nm. (c) Illustration of surface functionalization of the AuNRs for targeting GRPR on prostate cancer cells. Transmission electron microscope (TEM) images of as synthesized (d) small and (e) large AuNRs. (f) Size distribution of the AuNRs, confirming the small AuNRs with dimensions of 8 nm by 49 nm and the large AuNRs with dimensions of 18 nm by 120 nm. (g) Normalized extinction spectra of the large and small AuNRs, measured with UV-vis spectroscopy. The increased extinction at shorter wavelengths from large AuNRs indicates their relatively larger scattering cross-section.
Figure 2.
Figure 2.. Comparison of thermal stability of small and large AuNRs.
OD-matched small (blue) and large (red) AuNRs illuminated with 200 laser pulses at (a) 4.0 mJ cm−2, and (b) 18.2 mJ cm−2. The solid lines are moving average of the data points. SEM images of small AuNRs (c) before and (d) after 200 laser pulses at 20 mJ cm−2, showing that majority small AuNRs maintain their rod shape. SEM images of large AuNRs (e) before and (f) after 200 laser pulses at 20 mJ cm−2, showing that ~65% of the large AuNRs are thermally destroyed. (g) A photograph of a tube phantom containing AuNR solutions, from left to right (1st to 4th tubes): small AuNRs (OD = 3), large AuNRs (OD =3), small AuNRs (OD = 3), and large AuNRs (OD = 4.5). The field of view of the photoacoustic image is 13.9 mm × 13.3 mm. (h) Photoacoustic intensities from the tube phantoms, show comparable signals from the first and third tubes containing identical small AuNRs, which are ~3.5 times higher than the second tube containing OD-matched large AuNRs and ~1.9 times higher than the fourth tube containing OD-over-compensated large AuNRs. The centre values are the mean values of the photoacoustic intensities (n= 290) of each tube phantom, and the error bars are the standard deviation. (i) Photoacoustic intensities as a function of laser fluences. The linear dependence of small AuNRs indicates their enhanced thermal stability, compared with the decreased photoacoustic intensities of large AuNRs at higher laser fluences. The centre values are the mean values (n=200), and the error bars are the standard deviation. We repeated each test independently for 3 times and received similar results.
Figure 3.
Figure 3.. Numerical analysis of photoacoustic signal generation from small and large AuNRs.
Only one nanorod is considered in each simulation domain. (a) FDTD simulations of absorption cross-section (σa) of AuNRs with various sizes. The solid curve is linear regression. The left (right) y-axis shows the absolute (normalized) values of the absorption cross-section. When the incident light is linearly polarized along the long axis, electric fields are concentrated at the two ends of the rods (insets). (b) Simulated transient temperature profile on the AuNR surface using COMSOL. The incident laser pulse has a Gaussian temporal profile, shown as the solid red curve (right y-axis), with an input fluence of 8.7 mJ cm−2 at 1064 nm. Peak temperatures of AuNRs are summarized in the inset. (c) Spatial distribution of the normalized photoacoustic signal of the 18-nm AuNRs, showing the signature N-shape. (d) Normalized photoacoustic quantum yield, ϕPA as a function of the nanoparticle volumes, showing that smaller AuNR exhibits a higher photoacoustic quantum yield. (e) Normalized emitted acoustic energy as a function of nanoparticle surface areas, showing a linear relationship. (f) Normalized peak amplitude of the photoacoustic signal, P, and photoacoustic quantum yield, ϕPA, as a function of the surface-to-volume ratio of the AuNRs, showing that ϕPA is linearly proportional to the surface-to-volume ratio, and P is approximately quadratic to the surface-to-volume ratio. The solid curve is quadratic fitting, and the dashed line is linear fitting. All normalizations are with respect to the 8-nm AuNR. Symbols and description are detailed in Supplementary Table 2.
Figure 4.
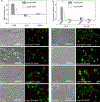
Figure 4.. Targeting specificity of small and large AuNRs for prostate cancer cells.
All cells were genetically encoded with green fluorescent proteins for imaging. (a) Zeta potential measurements of the AuNRs at each surface functionalization step. The centre values are the mean values (n=36), and error bars are the standard deviation. (b) Fluorescent intensities of Cy5 from 30 cancer cells incubated either with targeted (GRPR) or non-targeted (PEG) AuNRs. Higher intensities reflect higher targeting efficiency. The centre values are the mean values (n=30), and error bars are the standard deviation. * p=0.000472 (two-tailed p-value). Bright field and fluorescent images of (c) small targeted AuNRs on PC-3 (GRPR+) cells, strong Cy5 signals indicate efficient targeting; (d) small targeted AuNRs on DU-145 (GRPR-) cells, relatively weak Cy5 signals indicate low targeting efficiency because of the low density of GRPR on this cell line; (e) small non-targeted (PEG terminated) AuNRs on PC-3 cells, weak Cy5 signals indicate good targeting specificity; (f) small non-targeted AuNRs on DU-145 cells, minimal Cy5 signals indicate minimal nonspecific binding; (g) large targeted AuNRs on PC-3 cells, strong Cy5 signals indicate efficient targeting; (h) large targeted AuNRs on DU-145 cells, weak Cy5 signals indicate good targeting specificity; (i) large non-targeted AuNRs on PC-3 cells, weak Cy5 signals indicate good targeting specificity; and (j) large non-targeted AuNRs on DU-145 cells, minimal Cy5 signals indicate minimal nonspecific binding. Field-of-view of (c)-(j) is 275 μm × 200 μm. We repeated the imaging experiments independently for 3 times and received similar results.
Figure 5.
Figure 5.. Imaging of targeted small and large AuNRs in a murine model of prostate cancer.
Photograph and photoacoustic imaging of tumor-bearing mouse with non-targeted (a) large and (b) small AuNRs; and with targeted (c) large and (d) small AuNRs. The photoacoustic signal intensities are displayed as colour maps, overlaid with the ultrasound images for anatomical information. The in vivo photoacoustic imaging is done with one replicate. The scanning volume for panels (a) to (d) is 23 mm (x) × 19 mm (y) × 16 mm (z). (e) A representative fluorescent image of harvested kidney, tumor, heart, spleen and liver from the tumor-bearing mouse with targeted small AuNRs, showing that these nanoparticles are most aggregated at the tumor and the liver. Similar results are received from all three mice in the same group. (f) Represent fluorescent imaging of the harvested tumors from 4 mice, m1 to m4, showing strongest signal from the mouse in group 4, which is GRPR-targeted small AuNRs, demonstrating their highest binding specificity and efficiency. Similar results are received from all three mice in each group. (g) Collective measurements of the fluorescent intensities from the major organs and tumors from the 4 groups of mice, indicating that all AuNRs will accumulate mainly at the liver and similarly at the other organs, but only small GRPR-targeted AuNRs show highest binding specificity at the tumor site. The centre values are the mean values (n=3), and error bars are the standard deviation,* p=0.3915, ** p=0.0484, *** p=0.0053, ****p=0.0398 (two-tailed p-value).

References

    1. Smith AM, Mancini MC & Nie S Bioimaging: Second window for in vivo imaging. Nature Nanotechnology 4, 710–711 (2009). - PMC - PubMed
    1. Homan K et al. Prospects of molecular photoacoustic imaging at 1064 nm wavelength. Optics Letters 35, 2663–2665 (2010). - PMC - PubMed
    1. Weber J, Beard PC & Bohndiek SE Contrast agents for molecular photoacoustic imaging. Nature Methods 13, 639–650 (2016). - PubMed
    1. Nie LM & Chen XY Structural and functional photoacoustic molecular tomography aided by emerging contrast agents. Chemical Society Reviews 43, 7132–7170 (2014). - PMC - PubMed
    1. Jiang Y et al. Broadband absorbing semiconducting polymer nanoparticles for photoacoustic imaging in second near-infrared window. Nano Letters 17, 4964–4969 (2017). - PubMed

Publication types