. 2019 Apr;22(4):627-632.
doi: 10.1038/s41593-019-0353-z. Epub 2019 Mar 4.

Spontaneous synchronization to speech reveals neural mechanisms facilitating language learning

Affiliations

Spontaneous synchronization to speech reveals neural mechanisms facilitating language learning

M Florencia Assaneo et al. Nat Neurosci. 2019 Apr.

Abstract

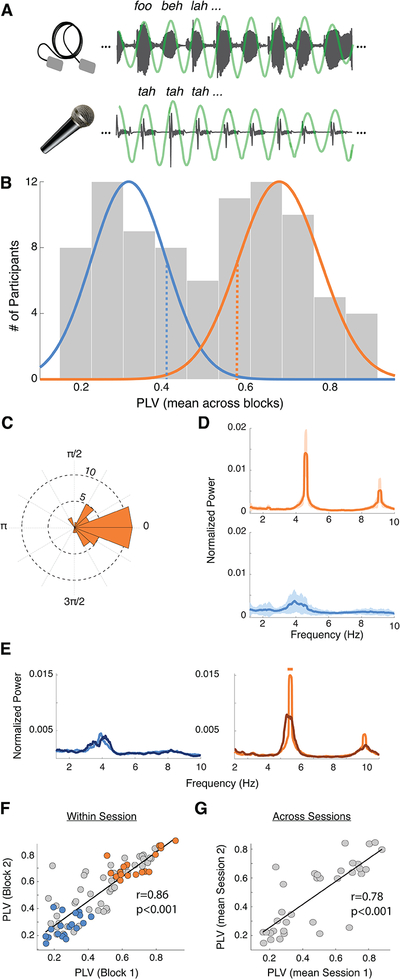
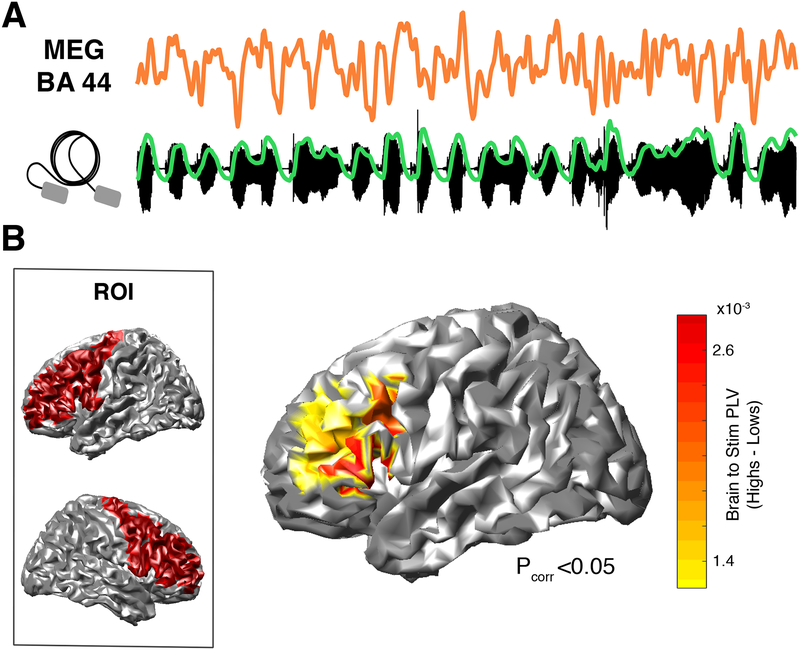
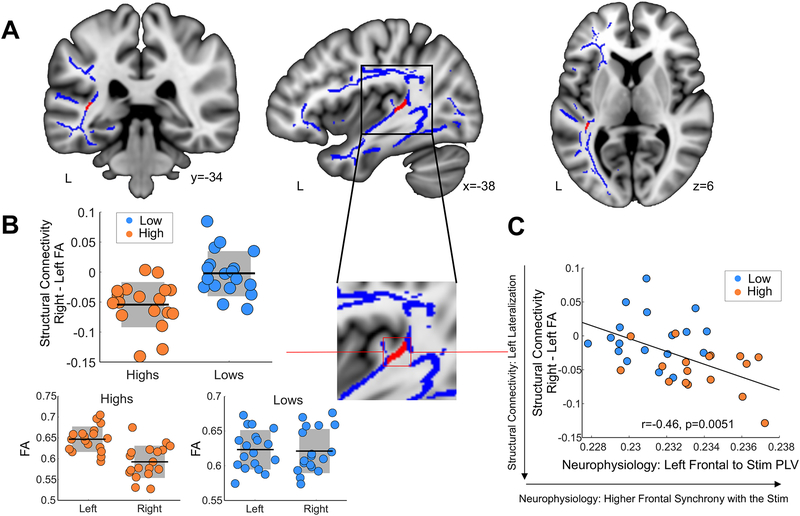
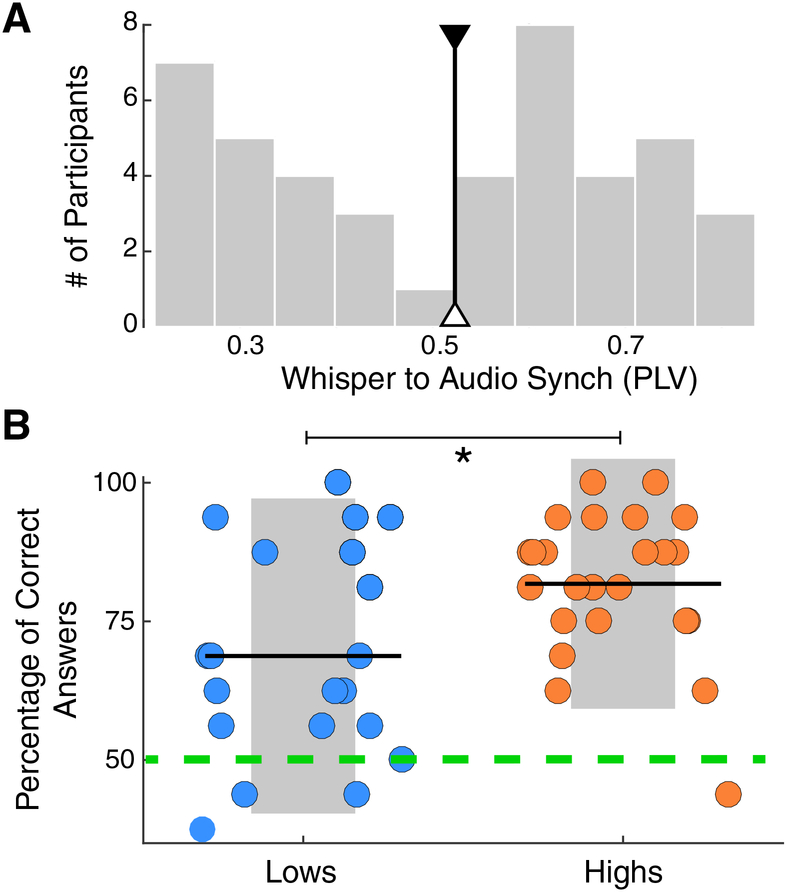
We introduce a deceptively simple behavioral task that robustly identifies two qualitatively different groups within the general population. When presented with an isochronous train of random syllables, some listeners are compelled to align their own concurrent syllable production with the perceived rate, whereas others remain impervious to the external rhythm. Using both neurophysiological and structural imaging approaches, we show group differences with clear consequences for speech processing and language learning. When listening passively to speech, high synchronizers show increased brain-to-stimulus synchronization over frontal areas, and this localized pattern correlates with precise microstructural differences in the white matter pathways connecting frontal to auditory regions. Finally, the data expose a mechanism that underpins performance on an ecologically relevant word-learning task. We suggest that this task will help to better understand and characterize individual performance in speech processing and language learning.


Conflict of interest statement

Competing interests

The authors declare no competing interests.

Figures

Fig. 1.
Fig. 1.. Spontaneous speech synchronization reveals a bimodal distribution.
(A) SSS-test: example of the perceived (upper panel) and produced (lower panel) signals. Produced signals were independently recorded for each participant (N=84). Green line: the envelope bandpass filtered between 3.5–5.5 Hz. To eliminate auditory interference induced by listeners’ own speech output, participants wore foam earplugs and whispered softly. (B) PLV histogram (average across blocks). Colored lines: normal distributions fitted to each of the two clusters obtained by a kmeans algorithm (the number of participants in each cluster is: Nhigh = 43, Nlow = 41), low (blue)/high (orange) groups. Participants subsequently completing neurophysiology and neuroimaging sessions were randomly selected from below/above one sigma from the mean (blue/orange dashed lines). (C) Phase histogram for the lag between perceived and produced syllables. Histogram computed just for the high group. Low participants are not synchronized, thus it is not possible to define a phase lag. (D) Average spectra of the utterances’ envelopes (Nhigh = 43, Nlow = 41). Shadowed regions: SD. (E) Average spectra for a subgroup of participants (Nhigh = 13, Nlow = 12). Dark/light lines correspond to no-rhythm/rhythm conditions. Straight lines on top: significant difference between conditions (Wilcoxon signed rank test, two-sided p < 0.05, FDR-corrected). (F) PLV scatter plot of the correlation between first and second blocks (Spearman correlation coefficient r = 0.86, p < 0.001). Dots: individual subjects (N=84). Colored dots: participants selected to complete subsequent neurophysiology and neuroimaging sessions (Nhigh = 18, Nlow = 19). (G) Scatterplot of the correlation between the mean PLV in the first and second sessions (one month apart; Spearman correlation coefficient r = 0.78, p < 0.001). Orange/blue correspond to high/low synchronizers, respectively, in all panels.
Fig. 2.
Fig. 2.. Neural distinction between groups: neurophysiological data.
(A) Activity from a high synchronizer generated in BA44 (upper panel) during passive listening to the stimulus (lower panel; in green, stimulus envelope). Similar signals were obtained for the others (N=17) high synchronizers. (B) Brain-to-stimulus synchronization. Left panel: ROI comprising bilateral pre-central, middle frontal and inferior frontal gyri. Right panel: Brain surface map showing PLV differences between groups (Nhigh = 18, Nlow = 19; Mann-Whitney-Wilcoxon test, two-sided p < 0.05, FDR-corrected).
Fig. 3.
Fig. 3.. Structural distinction between groups: anatomic connectivity data.
(A) Laterality maps (using tract based spatial statistics, TBSS) of Fractional Anisotropy (FA), right minus left values. In red, white matter pathways differentiating between groups (Nhigh = 18, Nlow = 18, FWE-corrected, two-sided p < 0.05 using threshold free cluster enhancement) over the mean group skeleton (blue). Neurological convention is used, with MNI coordinates at the bottom of each slice. (B) To facilitate the visualization of the pattern of results, box-plots (Nhigh=18, Nlow=18) with the mean (center line) and SD (grey areas) FA value of the significant cluster for each participant are shown for the laterality (right-left, top) and for each group and hemisphere separately (bottom). (C) Scatter plots (N=36) display the correlation between mean FA laterality values (negative values imply a leftward structural lateralization) and the synchrony of the left inferior/middle frontal gyri with the speech syllable rate (Spearman r = −0.46, p=0.0051; Skipped Spearman r = −0.44, t = −2.90, CI = −0.14, −0.68). Orange/light blue, high/low synchronizers. Dots: individual participants. Black lines: mean across participants. Shadowed region: SD.
Fig. 4.
Fig. 4.. Spontaneous Speech Synchronization test predicts word learning.
(A) SSS-test outcome. Histogram of the PLVs between the envelope of the perceived and produced speech signals, bandpass filtered at 3.5–5.5 Hz. The median of the first cohort’s distribution is displayed (black line; individuals above/below this line are labeled as high/low). (B) Percent correct answers for the statistical word-learning task (Nhigh =24, Nlow=20; Mann-Whitney-Wilcoxon test, two-sided p=0.024). Orange/light blue correspond to high/low synchronizers. Dots: individual participants. Black lines: mean across participants. Asterisk: p<0.05. Shadowed region: SD. Green dashed line: chance level in a two alternative forced-choice post-learning task.

References

    1. Condon WS & Sander LW Neonate movement is synchronized with adult speech: interactional participation and language acquisition. Science 183, 99–101 (1974). - PubMed
    1. Repp BH Sensorimotor synchronization: A review of the tapping literature. Psychonomic Bulletin and Review 12, 969–992 (2005). - PubMed
    1. Woodruff Carr K, White-Schwoch T, Tierney AT, Strait DL & Kraus N Beat synchronization predicts neural speech encoding and reading readiness in preschoolers. Proc. Natl. Acad. Sci 111, 14559–14564 (2014). - PMC - PubMed
    1. Patel AD The Evolutionary Biology of Musical Rhythm: Was Darwin Wrong? PLoS Biol 12, (2014). - PMC - PubMed
    1. Janata P & Grafton ST Swinging in the brain: Shared neural substrates for behaviors related to sequencing and music. Nature Neuroscience 6, 682–687 (2003). - PubMed

Methods-only references

    1. Pernet CR, Wilcox R & Rousselet GA Robust correlation analyses: False positive and power validation using a new open source matlab toolbox. Front. Psychol 3, (2013). - PMC - PubMed
    1. Rousseeuw PJ & Van Driessen K A fast algorithm for the minimum covariance determinant estimator. Technometrics 41, 212–223 (1999).
    1. Verboven S & Hubert M LIBRA: A MATLAB library for robust analysis. Chemom. Intell. Lab. Syst 75, 127–136 (2005).
    1. Rousselet GA & Pernet CR Improving standards in brain-behavior correlation analyses. Front. Hum. Neurosci 6, (2012). - PMC - PubMed
    1. Cureton EE Rank-biserial correlation. Psychometrika 21, 287–290 (1956).

Publication types