. 2019 Apr;25(4):656-666.
doi: 10.1038/s41591-019-0374-x. Epub 2019 Mar 4.

Siglec-15 as an immune suppressor and potential target for normalization cancer immunotherapy

Affiliations

Siglec-15 as an immune suppressor and potential target for normalization cancer immunotherapy

Jun Wang et al. Nat Med. 2019 Apr.

Abstract

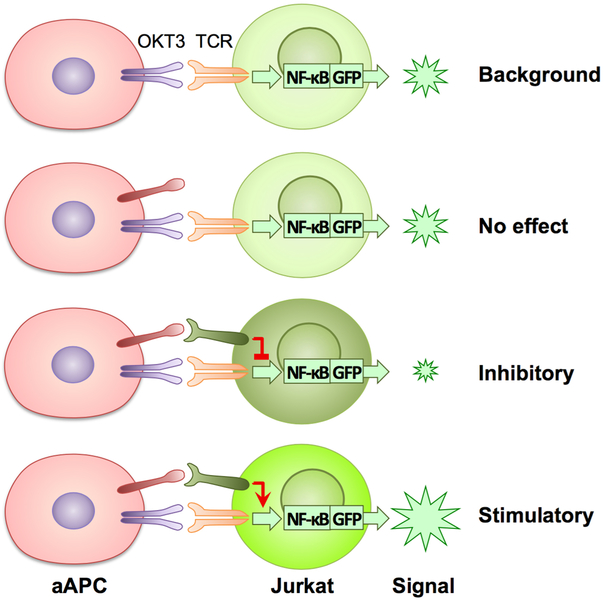
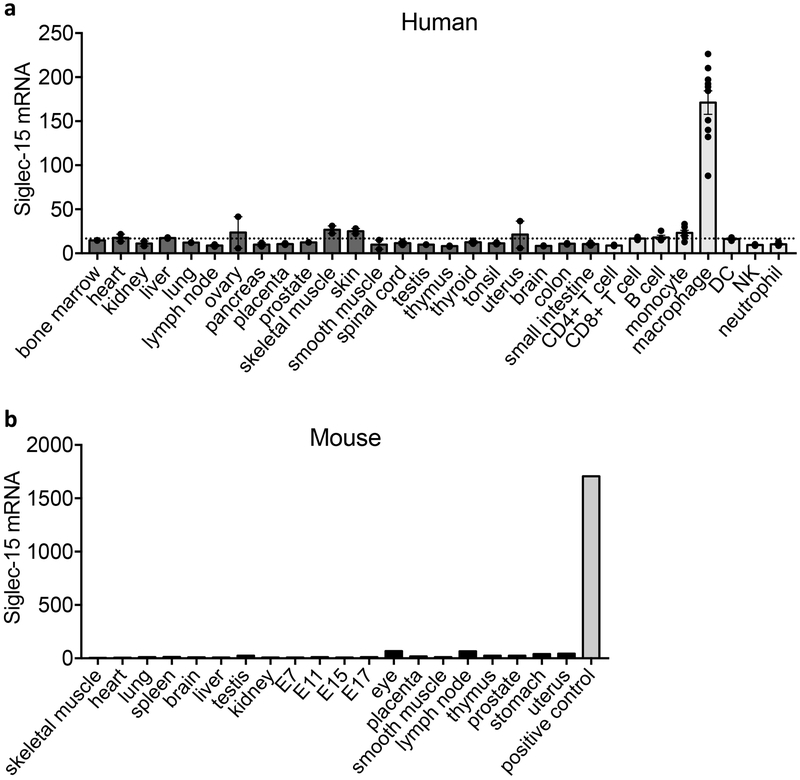
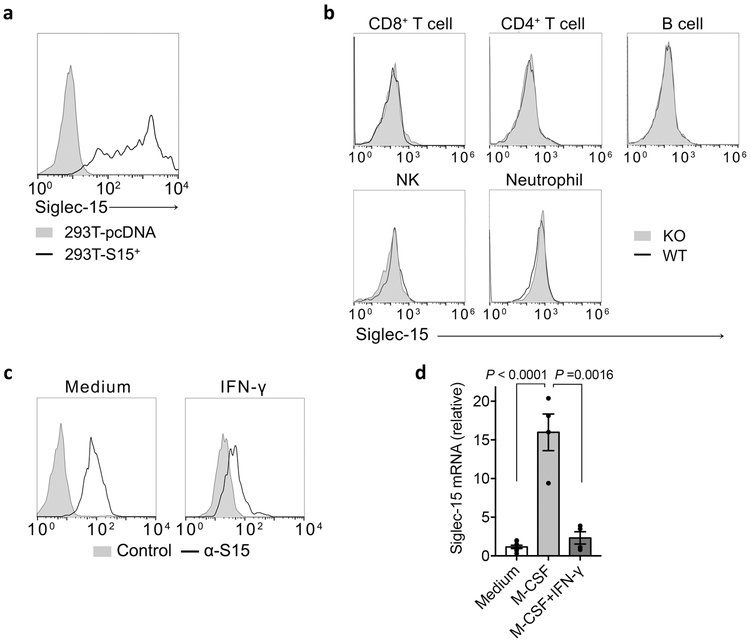
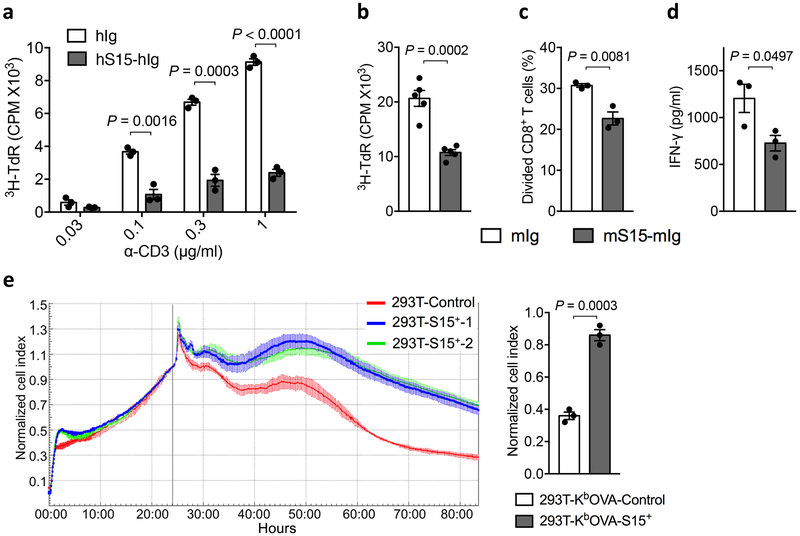
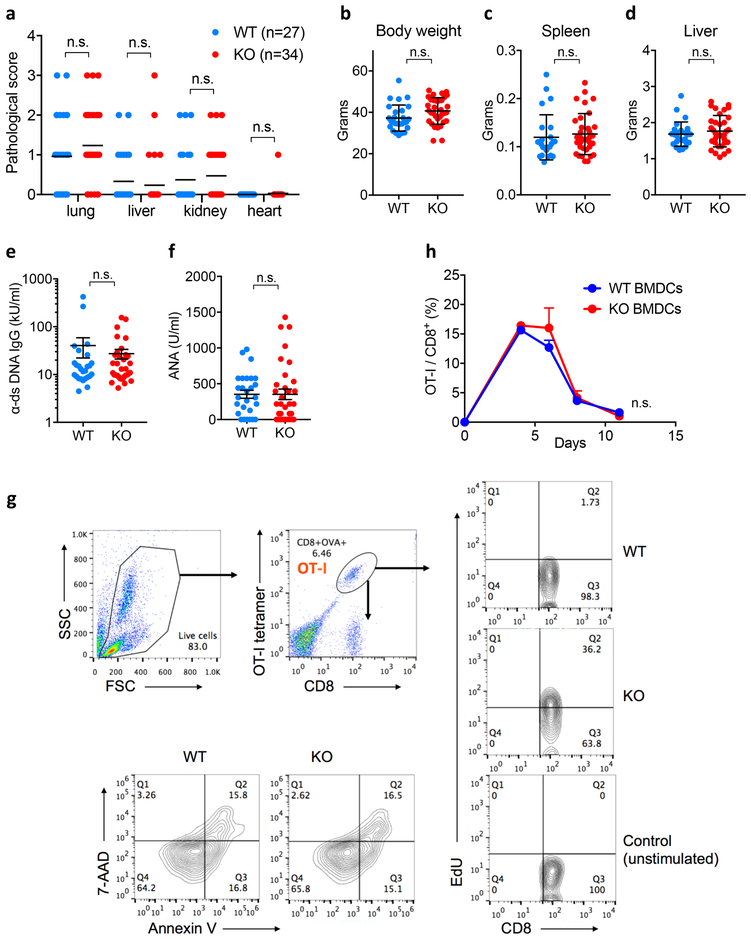
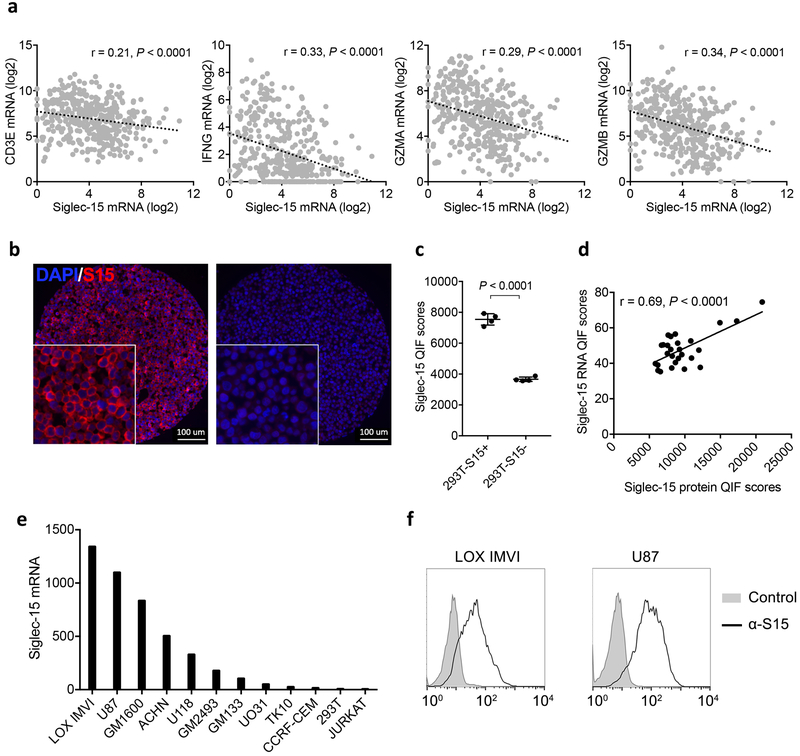
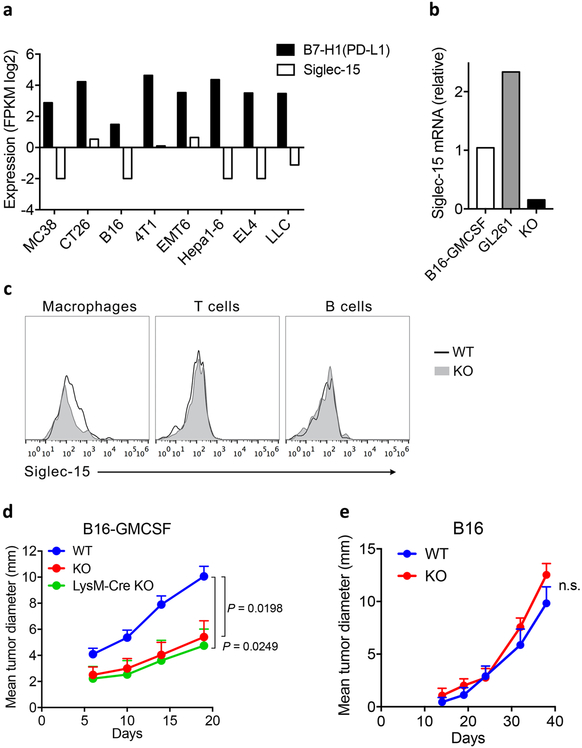
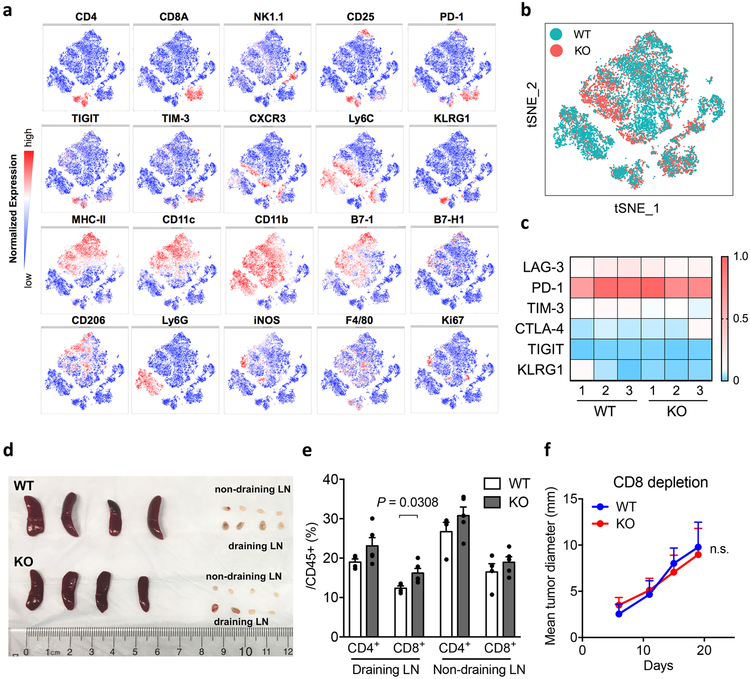
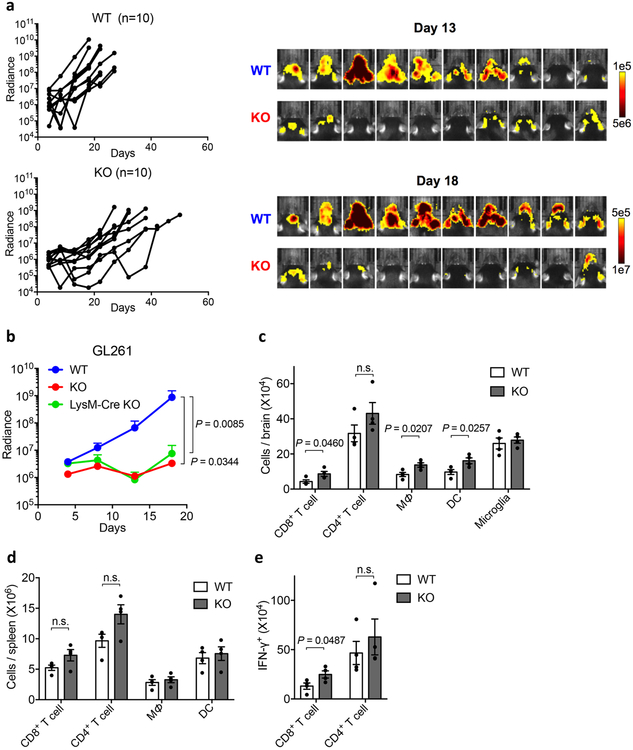
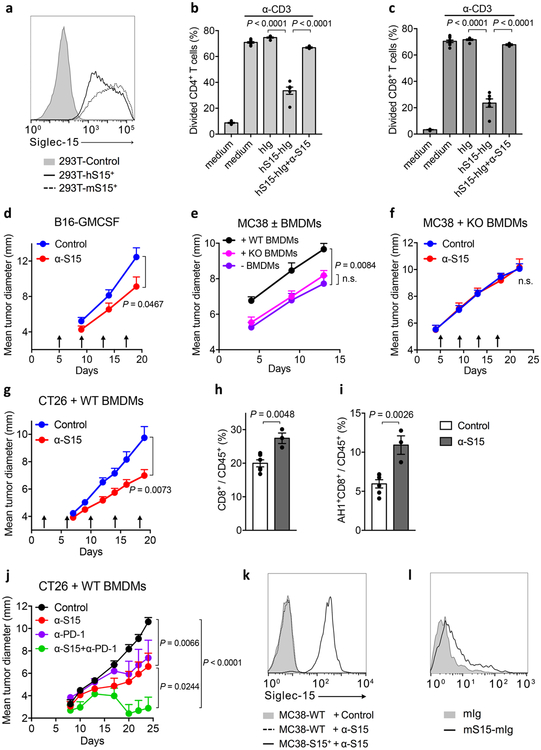
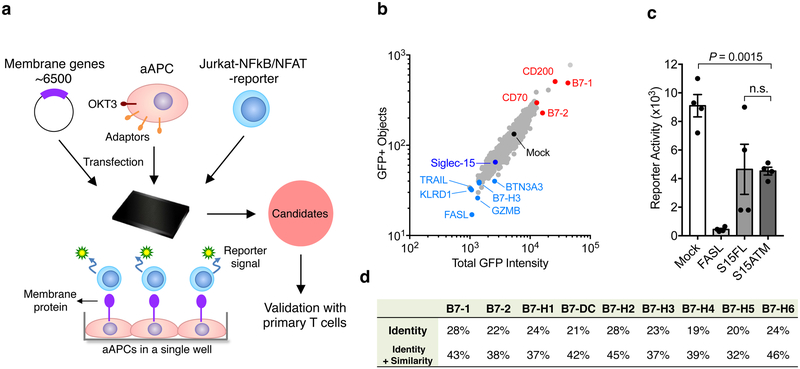
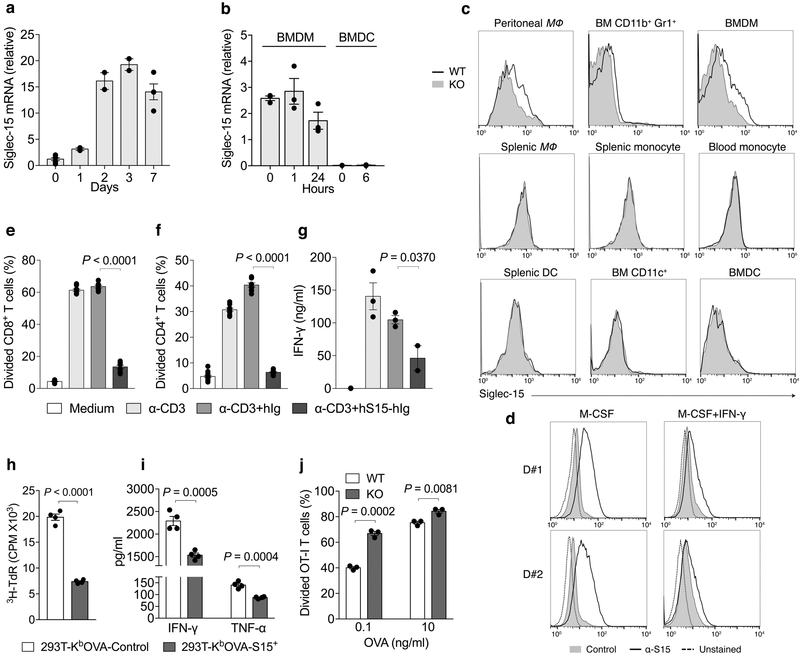
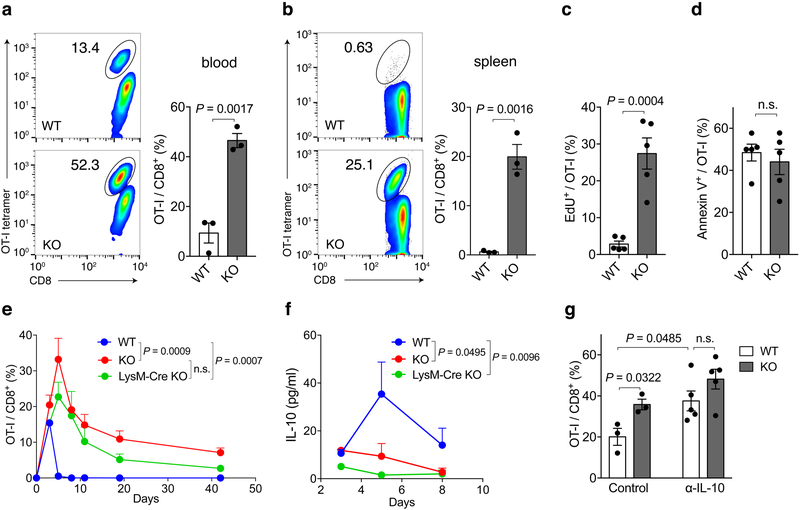
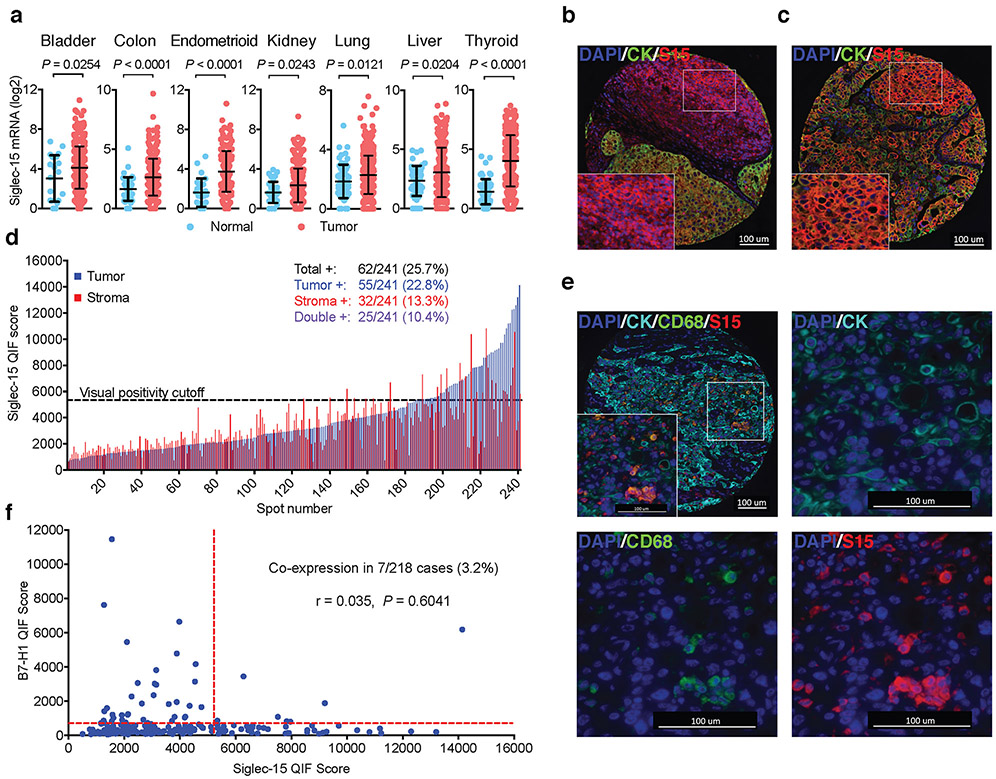
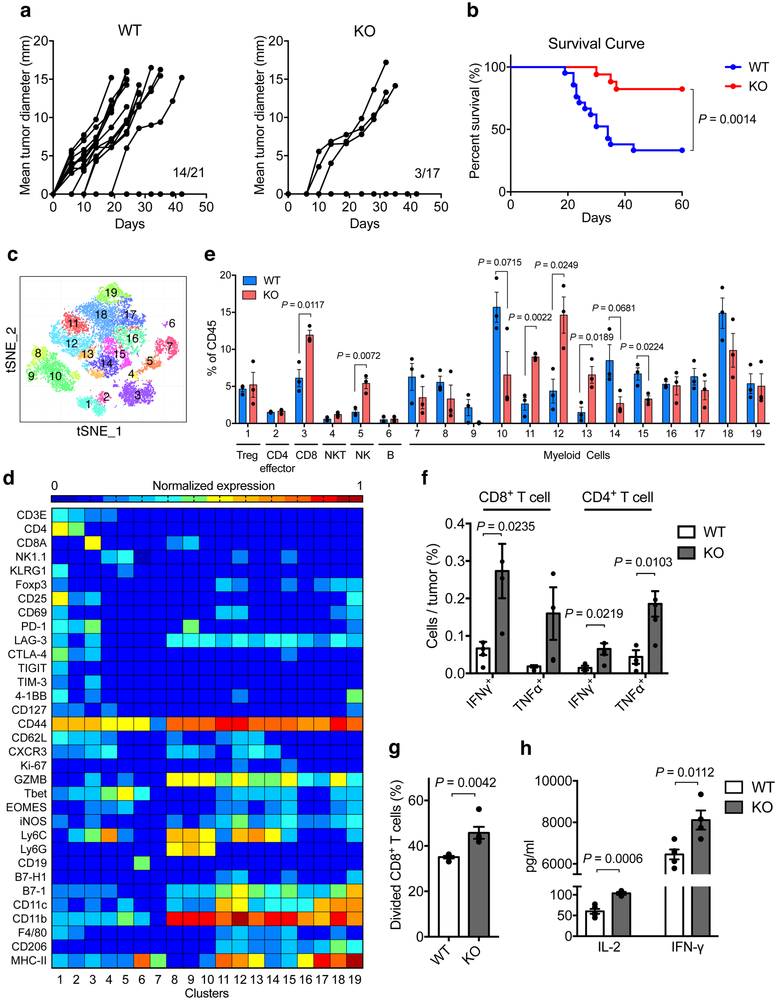
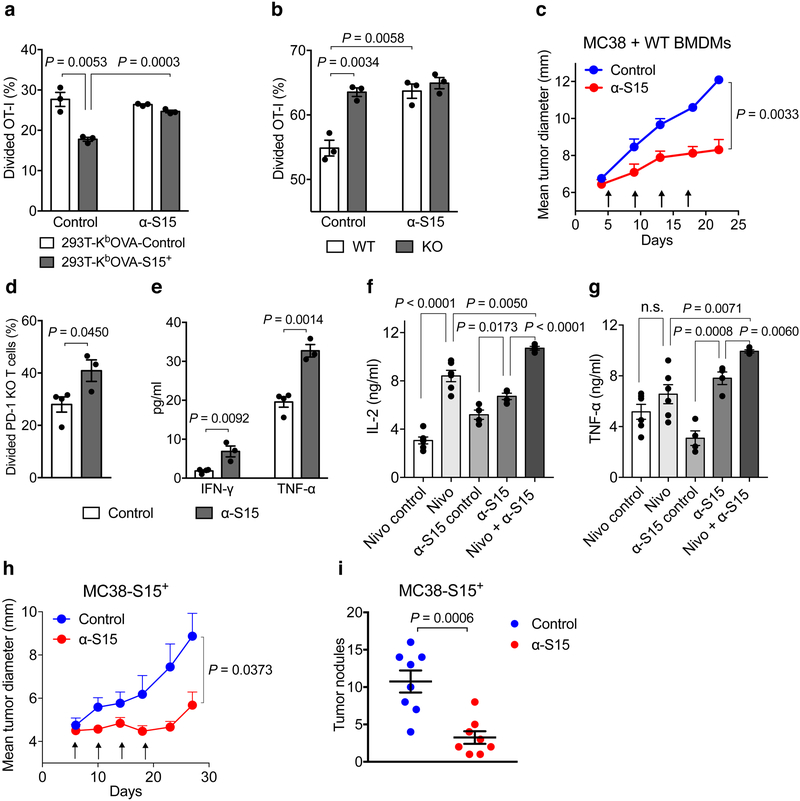
Overexpression of the B7-H1 (PD-L1) molecule in the tumor microenvironment (TME) is a major immune evasion mechanism in some patients with cancer, and antibody blockade of the B7-H1/PD-1 interaction can normalize compromised immunity without excessive side-effects. Using a genome-scale T cell activity array, we identified Siglec-15 as a critical immune suppressor. While only expressed on some myeloid cells normally, Siglec-15 is broadly upregulated on human cancer cells and tumor-infiltrating myeloid cells, and its expression is mutually exclusive to B7-H1, partially due to its induction by macrophage colony-stimulating factor and downregulation by IFN-γ. We demonstrate that Siglec-15 suppresses antigen-specific T cell responses in vitro and in vivo. Genetic ablation or antibody blockade of Siglec-15 amplifies anti-tumor immunity in the TME and inhibits tumor growth in some mouse models. Taken together, our results support Siglec-15 as a potential target for normalization cancer immunotherapy.


Figures

Extended Data Figure 1
Extended Data Figure 1. Schematic representation of the outcome from the TCAA screening
The 293T cells stably expressing membrane associated anti-human CD3 antibody (OKT3) scFv were used to stimulate the activation of Jurkat-NF-κB-reporter cells to generate GFP signals. Expression of an individual plasmid encoding human transmembrane gene would engage a potential receptor on Jurkat T-cells to co-stimulate or co-inhibit OKT3-induced T-cell activation. Unchanged GFP signal upon the transfection of 293T cells indicates the lack of costimulatory or coinhibitory activity.
Extended Data Figure 2
Extended Data Figure 2. Siglec-15 mRNA expression in normal tissues of human and mouse origin
(a) Siglec-15 mRNA relative levels in human tissues and immune cell subsets from BioGPS database. A dash line was added to indicate the flow cytometry detection threshold (verified by Siglec-15 negative staining on CD8 T cells). Data are mean ± s.e.m. (tissues, n = 2; monocyte, n = 6; macrophage, n = 10; other immune subsets, n = 4 samples). (b) Siglec-15 mRNA expression in mouse tissues was tested by RT-PCR, quantified by ImageJ software (NIH) and normalized to the levels of reference gene GAPDH. The 293T-cells overexpressing Siglec-15 were used as a positive control. E7, day 7 embryos.
Extended Data Figure 3:
Extended Data Figure 3:. Siglec-15 protein expression on human and mouse immune cells
(a) Flow cytometry analysis of 293T-cells transfected with empty vector (pcDNA) or plasmid with full length Siglec-15 gene and stained by m03 (anti-Siglec-15 mAb). (b) Siglec-15 expression on lymphocytes and neutrophils from S15KO and WT mice by flow cytometry analysis with m03. In a and b, data are representative of three independent experiments. (c) Flow cytometry analysis of Siglec-15 expression on the RAW264.7 macrophage line treated with or without 20 ng/ml recombinant murine IFN-γ for 48 hrs. (d) Human CD14+ monocytes from peripheral blood were incubated for 7 days in the presence of 100 ng/ml M-CSF (M-CSF group) or M-CSF for 4 days followed by M-CSF plus 50 ng/ml IFN-γ for 3 more days (M-CSF + IFN-γ group) or medium only as control (Medium). Siglec-15 mRNA levels was determined by RT-PCR. Data are presented as mean ± s.e.m. after intra-sample normalization to the reference gene GAPDH (n = 4 cell cultures). P values by two-tailed unpaired t-test. In c and d, data are representative of two independent experiments.
Extended Data Figure 4
Extended Data Figure 4. Effect of Siglec-15 as recombinant protein or cell surface protein on human and mouse T-cell functions
(a) The effect of plate-coated hSiglec-15-hIg or control hIg (5 μg/ml) on human T-cell proliferation in the presence of plate-coated anti-human CD3 mAb at the indicated concentrations. Proliferation of T-cells was indicated by 3H-thymidine incorporation at 72 hrs. (b) The effect of plate-coated mSiglec-15-mIg or control mIg (5 μg/ml) on mouse splenic T-cell proliferation in the presence of plate-coated anti-mouse CD3 mAb (1 μg/ml). Proliferation of T-cells was indicated by 3H-thymidine incorporation at 72 hrs. (c, d) The effect of soluble mSiglec-15-mIg or control mIg (5 μg/ml) on mouse splenic CD8+ T-cells in the presence of coated anti-mouse CD3 mAb (1 μg/ml). The cell proliferation as indicated by CSFE dilution (c) and IFN-γ in the culture medium (d) at 72 hrs are shown. (e) The 293T-KbOVA-S15+ or S15 negative control cells were placed in a 384-well plate at 1×10⁴/well for 24 hrs, followed by the addition of OT-I (1×10⁴/well) pre-activated with OVA257-264. Real-time survival of target cells was monitored by the xCELLigence cellular impedance assay (left panel) and normalized by the value right before adding OT-I cells (normalized cell index). Data at 72 hrs are shown as a bar in the right panel. All data above are mean ± s.e.m. (n = 3 or 4 cell cultures) and representative of two independent experiments. P values by two-tailed unpaired t-test.
Extended Data Figure 5
Extended Data Figure 5. Normal phenotype of Siglec-15 deficient mice
(a) Tissue histological analysis was performed on 18-month-old Siglec-15 KO mice and WT littermate and is shown as the pathological score (see Materials and Methods). The indicated tissues were fixed in formalin, embedded with paraffin, and stained with hematoxylin and eosin. The inflammatory status of tissues was evaluated based on a semi-quantitative method that describes the level of immune infiltration. Data are presented as mean. (b-d) The body (b), spleen (c) and liver (d) weight of Siglec-15 KO and WT mice. Data are presented as mean ± s.d. (e, f) The levels of anti-dsDNA IgG antibodies (e) and anti-nuclear antibodies (ANA) (f) in sera of 18-month-old Siglec-15 KO and WT mice were quantified by specific sandwich ELISA. Data are presented as mean ± s.e.m. In a-f, data are analyzed by two-tailed unpaired t-test (WT n = 27 mice; KO n = 34 mice; n.s., not significant). (g) Gating strategy for OT-I T-cell EdU incorporation and apoptosis analysis by flow cytometry. (h) Siglec-15 KO or WT BMDCs pulsed with OVA257-264 peptide were injected i.p. into WT mice at 5×10⁵/mouse followed by i.p. injection of OT-I T-cells at 2×10⁶/mouse 6 hrs later. The OT-I in the blood at the indicated time-points were analyzed by flow cytometry. The results are shown as the percentage of OT-I among total CD8+ T-cells. Data are mean ± s.e.m. (n= 5 mice per group). Data are analyzed by two-way ANOVA.
Extended Data Figure 6
Extended Data Figure 6. Analysis of Siglec-15 mRNA expression in human cancers
(a) The inverse correlation of mRNA expression levels between Siglec-15 and T-cell signature genes (CD3E, IFNG, GZMA and GZMB) in bladder cancer by meta-analysis of TCGA databases. Pearson r score and P value are shown (n=407 human samples). (b-d) Validation of anti-Siglec-15 antibody clone PA5-48221. Representative quantitative immunofluorescence images of positive staining on 293T cells overexpressing Siglec-15 (293T-S15+, left panel) compared to mock transfected 293T cells (293T-S15-, right panel) (DAPI [blue] and S15 [red]) (b) Data are representative of four independent experiments. QIF scores of 293T-S15+ and 293T-S15- cell lines (c). Data are mean ± s.e.m. (n= 4 independent experiments). P values by two-tailed unpaired t-test. Comparison of Siglec-15 protein and RNA expression using RNAscope in situ detection by QIF (d). Pearson r score and P value are shown (n = 27 human samples). (e) The relative levels of Siglec-15 mRNA in human cancer cell lines from the BioGPS database. (f) Cell surface expression of Siglec-15 on LOX IMVI and U87 human cancer lines by staining with anti-Siglec-15 and control mAb and analyzed with flow cytometry. Data are representative of three independent experiments.
Extended Data Figure 7
Extended Data Figure 7. Expression and function of Siglec-15 in mouse tumors
(a) Siglec-15 mRNA expression in tumors from indicated mouse models by comparison to B7-H1, analyzed from the CrownBio MuBase database. (b) Siglec-15 mRNA levels in tumors of B16-GMCSF and GL261 model was determined by RT-PCR on day14 after inoculation. Spleen from a S15KO mouse was used as negative control. Data are relative levels to reference gene RPL13a. (c) Flow cytometric analysis of Siglec-15 expression on infiltrating immune cell subsets of B16-GMCSF tumors from Siglec-15 WT and KO mice on day 14 after inoculation. Data are representative of two independent experiments. (d, e) B16-GMCSF tumor cells at 1.5×10⁶/mouse or wild type B16 tumor cells at 1×10⁶/mouse were injected s.c. into Siglec-15 WT, KO or LysM-Cre KO as indicated. Tumor growth was measured regularly and is shown as the mean tumor diameter ± s.e.m. (n=6 mice per group). P values by two-way ANOVA (n.s., not significant; P = 0.3180).
Extended Data Figure 8
Extended Data Figure 8. Immunophenotyping of B16-GMCSF tumors
(a-c) Mass cytometry analysis of tumor-infiltrating leukocytes isolated at day 14 after B16-GMCSF tumor cell inoculation as described in Figure 5 (n = 3 mice per group). t-SNE plot of tumor infiltrating leukocytes overlaid with the expression of indicated markers (a). Density t-SNE plots of an equal number of CD45+ tumor-infiltrating leukocytes in Siglec-15 KO and WT mice (b). The normalized expression value (mean mass intensity) of checkpoint receptors on tumor-infiltrating CD8+ T-cells (c). (d, e) On day 14 after B16-GMCSF tumor cell inoculation, spleens and lymph nodes (LN) from WT and KO mice were dissected (d). The percentage of CD4+ and CD8+ T-cells in the draining and non-draining lymph nodes (LN) was analyzed by flow cytometry (e). Data are mean ± s.e.m. (n = 4 mice per group). P values by two-tailed unpaired t-test. (f) B16-GMCSF tumor cells were injected s.c. into Siglec-15 WT and KO at 1.5×10⁶/mouse. Mice were treated with 200μg anti-CD8 antibody every 3 to 4 days since 3 days before tumor inoculation. Tumor growth was measured regularly and is shown as the mean tumor diameter ± s.e.m. (n=5 mice per group). P values by two-way ANOVA (n.s., not significant; P = 0.9372).
Extended Data Figure 9
Extended Data Figure 9. Growth of GL261 Glioblastoma in Siglec-15 deficient mice and analysis of immune infiltration.
(a, b) GL261-luc cells were injected i.c. into Siglec-15 WT, KO or LysM-Cre KO mice at 4×10⁵/mouse. Mice were subsequently treated with a 4Gy whole brain radiation on day 4. Tumor volume in mice was measured by the IVIS imaging system every 4 to 5 days. Tumor growth in individual Siglec-15 WT or KO mice (left) and imaging at day 13 and 18 after tumor inoculation (right) are shown in (a) (n=10 mice per group). Data are representative of two independent experiments. The GL261-luc tumor growth in Siglec-15 WT, KO and LysM-Cre KO mice is mean bioluminescence in radiance ± s.e.m. over time (b) (WT, n = 10 mice; KO, n = 10 mice; LysM-Cre KO, n=8 mice). P values by two-tailed Mann-Whitney test. (c-e) Flow cytometry analysis of tumor-infiltrating immune cells at day 14 after GL261 tumor inoculation (n=4 per group). CD8+ T-cells, CD4+ T-cells, CD11b+ CD45high macrophages (MØ), CD11b+ CD45low microglia, and CD11c+ dendritic cells (DC) in brain (c) or spleen (d) were quantified by flow cytometry. Brain mononuclear cells were further re-stimulated with irradiated GL261-luc cells for 5 days. Total number of IFN-γ-producing CD8+ T-cells and CD4+ T-cells was determined by live cell counting and intracellular staining (e). Data are mean ± s.e.m. (n = 4 mice per group) and representative of two independent experiments. P values by two-tailed unpaired t-test (n.s., not significant; c, P = 0.1937; d, P = 0.0916 and 0.0624; e, P = 0.4820).
Extended Data Figure 10
Extended Data Figure 10. Effect of α-S15 on established mouse tumors with tumor-associated macrophages
(a) Binding of PE-labeled α-S15 (5G12) to 293T cells overexpressing human or mouse Siglec-15. 293T parental cells served as controls. Data are representative of three independent experiments. (b, c) Human PBMCs were stimulated by coated OKT3 (0.1 μg/mL) in 96-well plates for 3 days in the presence of 5 μg/ml hS15-hIg or control hIg with or without α-S15 at 12 μg/ml. The proliferation of CD4+ T-cell (b) and CD8+ T-cell (c) was indicated by CFSE dilution. Data are mean ± s.e.m. (n = 6 cell cultures) and representative of three independent experiments. P values by two-tailed unpaired t-test. (d) B16-GMCSF tumor cells were s.c. injected into WT C57BL/6 mice at 1.5×10⁶/mouse and subsequently treated with 200 μg α-S15 or isotype control mAb at day 5, 9, 13 and 17 (n= 7 mice per group). P values by two-tailed unpaired t-test. (e) MC38 tumor cells (3×10⁵) mixed with or without WT or KO BMDMs (2×10⁵) were s.c. injected into C57BL/6 mice (n= 5 mice per group). P values by two-way ANOVA (n.s., not significant; P = 0.4920). (f) MC38 tumor cells (3×10⁵) mixed with Siglec-15 KO BMDMs (2×10⁵) were s.c. injected into C57BL/6 mice and subsequently treated with 200 μg α-S15 or isotype control mAb at day 5, 9, 13 and 17 (n= 7 mice per group). P values by two-way ANOVA (n.s.; P = 0.9727). (g) CT26 tumor cells (1.5×10⁵) mixed with Balb/c BMDMs (1.5×10⁵) were s.c. injected into Balb/c mice and subsequently treated with 200 μg α-S15 or isotype control mAb as described in the methods (n= 10 mice per group). Data are representative of two independent experiments. P values by two-way ANOVA. (h, i) On day 15 after CT26 tumor inoculation as described in (g), tumor infiltrating CD8+ T-cells (h) and CT26 tumor-specific CD8+ T-cells (i) were stained with anti-CD8 mAb and AH1 dextramer+ and analyzed by flow cytometry (control, n = 5 mice; α-S15, n = 3 mice). P values by two-tailed unpaired t-test. (j) CT26 tumor cells (1.5×10⁵) mixed with Balb/c BMDMs (1.5×10⁵) were s.c. injected into Balb/c mice. Mice were treated with 200 μg α-S15 or isotype control mAb and/or 100 μg anti-PD-1 mAb as described in the methods (n= 10 mice per group). P values by two-way ANOVA. In d-j, data are presented as mean ± s.e.m. (k) Expression of Siglec-15 on transduced MC38 cells (MC38-S15+) or parental cells (MC38-WT) as determined by staining with m03 mAb or control antibody and flow cytometry analysis. Data are representative of three independent experiments. (l) OT-I T-cells from OT-I/Rag-1 KO mice were injected i.v. into C57BL/6 mice that are subsequently immunized with OVA257-264 peptide and adjuvant as described in Fig. 3. Spleen cells were isolated on day 5 and stained by mouse Siglec-15 recombinant fusion protein or by control Ig for flow cytometry analysis. Data are shown in a histogram as specific binding to OT-I T-cells gated by anti-CD8 mAb and OT-I tetramer positive staining. Data are representative of two independent experiments.
Figure 1.
Figure 1.. Identification of Siglec-15 as a T-cell suppressive molecule in the TCAA
(a) Schematic representation of TCAA for rapid screening of cell surface molecules with co-stimulatory and co-inhibitory activity. cDNA plasmids coding human membrane proteins were individually transfected into an artificial antigen presenting cell line (aAPC) overnight together with a pre-expressing transmembrane form of anti-human CD3 antibody (OKT3) scFv. Jurkat-NFκb/ NFAT-reporter T-cells were added into the wells and the effect of each transmembrane protein on OKT3-stimulated reporter activity is indicated as intensity of GFP fluorescence. The function of the candidate genes is further validated on primary human T-cells. Siglec-15 is one of the molecules selected for further study. (b) A representative result of TCAA. GFP signals of Jurkat-NFκb reporter cells were quantified based on the GFP positivity of the objects (y -axis) and the GFP density (x -axis) in each well of the array. The results of ~1,500 genes in the TCAA shown as different dots are displayed. The GFP signal in the well transfected with the mock plasmid is shown as a black dot. The activity of several genes with known T-cell stimulatory (red), apoptotic or inhibitory (light blue) activity, as well as Siglec-15 (dark blue) is indicated. Data are representative of two independent experiments. (c) A representative reporter activity of Jurkat-NFAT cells after co-culture with aAPC transfected with Fas ligand (FASL), full length Siglec-15 (S15FL), Siglec-15 ectodomain fused with B7-H6 transmembrane motif (S15ATM), or mock plasmid is displayed. Data are mean ± s.e.m. (n=4 cell cultures). P values by two-tailed unpaired t-test (n.s., not significant; P = 0.9462). (d) The homology of human Siglec-15 with B7 family members. Shown are the % identity or identity plus similarity of amino acid sequences in the extracellular domains. See also Extended Data Fig. 1.
Figure 2.
Figure 2.. Expression of Siglec-15 by macrophages and its inhibitory activity for T-cells
(a, b) Quantitative PCR (Q-PCR) estimation on Siglec-15 mRNA levels in human macrophages derived from CD14+ peripheral blood monocytes with 100ng/ml M-CSF (a), or LPS-treated mouse BMDMs or BMDCs (b) at indicated time points. Data are mean ± s.e.m. after normalization to reference gene GAPDH (a), or RPL13a (b), and representative of two independent experiments. (c) Flow cytometry analysis of Siglec-15 expression by anti-Siglec-15 mAb (clone m03) staining on mouse myeloid cell subsets from blood, spleen, bone marrow (BM) or peritoneal cavity of S15KO and WT mice. , macrophage. Data are representative of three independent experiments. (d) Human macrophages were generated from CD14+ peripheral blood monocytes from two healthy donors (D#1 and D#2) with M-CSF for 7 days. Alternatively, monocytes were cultured with M-CSF for 4 days followed by M-CSF + IFN-γ for 3 more days. Siglec-15 expression was analyzed by flow cytometry with anti-Siglec-15 (clone 1H3) or an isotype control mAb staining.Data are representative of two independent experiments. (e-g) The % of divided human peripheral CD8+ (e) or CD4+ T-cells (f) as indicated by CFSE dilution, as well as IFN-γ in the culture medium (g) after stimulation with 0.1 μg/ml of anti-CD3 in the presence of 5 μg/ml human Siglec-15 fusion protein (hS15-hIg) or control (hIg) for 3 days. (e and f, n = 6 cell cultures; g, n = 3 cell cultures from the same donor) (h, i) OT-I T-cells pre-activated with OVA257-264 (1×10⁵/well) were co-cultured with irradiated 293T-KbOVA cells stably expressing Siglec-15 (293T-KbOVA-S15+) or mock (293T-KbOVA-Control) (2×10⁴/well) in a 96-well plate. OT-I T-cell proliferation was determined by 3H-thymidine incorporation at 72 hrs (h). The cytokine levels in the culture medium were analyzed at 48 hrs (i). (n = 4 cell cultures from the same mouse) (j) The % of divided OT-I T-cells as indicated by CFSE dilution after co-cultured for 3 days with S15KO or WT peritoneal macrophages pulsed with OVA257-264 at the indicated concentrations. (n = 3 cell cultures) In e-j, data are presented as mean ± s.e.m. and representative of two or three independent experiments. P values by two-tailed unpaired t-test. See also Extended Data Figs. 2-4.
Figure 3.
Figure 3.. Inhibitory effect of Siglec-15 on antigen-specific T-cell responses in vivo
Splenic cells from OT-I/Rag-1 KO mice were injected i.v. into WT, Siglec-15 KO or LysM-Cre KO mice on day −1. On day 0, mice were immunized i.p. with 100 μg OVA257-264 peptide plus 100μg poly(I:C). OT-I T-cells in blood on day 4 (a) and in spleen on day 5 (b) were analyzed by flow cytometry with H-2KbOVA257-264 tetramer (OT-I tetramer) and CD8 mAb staining. Representative flow cytometry analysis and quantification of OT-I T-cells among total CD8+ T-cells are shown. Data are mean ± s.e.m. (n = 3 mice per group) and representative of three independent experiments. P values by two-tailed unpaired t-test. In some experiments, WT and KO were fed with EdU at 0.8mg/ml in drinking water from day 0 of immunization. On day 5, the % of EdU+ OT-I T-cells (c) and Annexin V+ OT-I T-cells in the spleen (d) were analyzed by flow cytometry. Data are mean ± s.e.m. (n = 5 mice per group) and representative of two independent experiments. P values by two-tailed unpaired t-test (n.s., not significant; P = 0.5566). (e, f) The kinetics of OT-I T-cells in the blood (e) and IL-10 levels in the plasma (f) of WT, Siglec-15 KO and LysM-Cre KO mice after OVA257-264/poly(I:C) immunization are shown. Data are mean ± s.e.m. (WT n = 4 mice; KO or LysM-Cre KO n=3 mice) and representative of three independent experiments. P values by two-way ANOVA (n.s.; P = 0.1475). (g) WT and KO mice were treated with 200 μg anti-IL-10 mAb or isotype control mAb daily after OT-I T-cell transfer. The % of OT-I T-cells among total CD8 T-cells in blood at day 5 is shown. Data are mean ± s.e.m. (control, n = 3 mice per group; α-IL-10, n = 5 mice per group). P values by two-tailed unpaired t-test (n.s., not significant, P = 0.1581). See also Extended Data Fig. 5.
Figure 4.
Figure 4.. Siglec-15 is abundant in human cancers
(a) The mRNA expression levels of Siglec-15 in human cancers versus corresponding normal tissues by meta-analysis of the TCGA database. Data are mean ± s.d. (bladder, n = 407 vs 20; colon, n = 288 vs 41; endometrioid, n = 175 vs 24; kidney, n = 291 vs 32; lung, n = 510 vs 58; liver, n = 373 vs 50; thyroid, n= 513 vs 59 samples of human tumor vs normal tissues). P values by two-tailed unpaired t-test. (b-f) Siglec-15 expression on an NSCLC patient cohort by Quantitative Immunofluorescence (QIF). Representative images of formalin-fixed paraffin-embedded tissue sections with positive Siglec-15 staining on stroma (b) and tumor (c) cells using anti-Siglec-15(S15) antibody PA5-48221 (4’,6-diamidino-2-phenylindole (DAPI) [blue], cytokeratin (CK) [green], and S15 [red]). Data are representative of three independent experiments. QIF score distribution of Siglec-15 expression in tumor and stroma compartments in the NSCLC cohort (d). Numbers and percentage of patient cases with visually positive Siglec-15 on total, tumor, stromal, or both cell types are shown. Representative images of an NSCLC tumor case with Siglec-15 and CD68 co-expression (DAPI [blue], CK [cyan], CD68 [green], and S15 [red]) (e). Top left: overlay of all multiplexed markers (10X magnification); top right: CK and DAPI (40X); bottom left: CD68 and DAPI (40X); bottom right: S15 and DAPI (40X). Data are representative of three independent experiments. The correlation between B7-H1 and Siglec-15 expression was assessed on serial tumor sections of the same cohort (f). Pearson r score and P value are shown. See also Extended Data Fig. 6.
Figure 5.
Figure 5.. Effect of Siglec-15 on tumor growth in syngeneic mice
(a, b) B16-GMCSF tumor cells at 1.5×10⁶ were injected s.c. into Siglec-15 WT and KO mice. Tumor incidence and growth in individual mouse (a) and percentage of survival (b) are shown. (WT, n = 21 mice; KO, n =17 mice; results were pooled from two independent experiments). P values by two-sided Log-rank test. (c-e) Mass cytometry analysis of tumor-infiltrating leukocytes at day 14 after B16-GMCSF tumor inoculation. t-SNE plot of tumor infiltrating leukocytes overlaid with color-coded clusters (c). Heatmap displaying normalized marker expression of each immune cluster (d). Frequency of clusters of indicated immune cell subsets (e). Data are mean ± s.e.m. (n = 3 mice per group). P values by two-tailed unpaired t-test. (f-h) The ex vivo function analysis of B16-GMCSF tumor-infiltrating T-cells or myeloid cells. T-cells (f) or myeloid cells (g, h) were isolated from B16-GMCSF tumors from WT and KO mice at day 14. The % of IFN-γ and TNF-α producing T-cells were analyzed by intracellular staining after 4 hrs re-stimulation with PMA and ionomycin (f). CD11b+ myeloid cells were co-cultured with CSFE-labeled naïve splenic CD8+ T-cells stimulated with anti-CD3. T-cell proliferation (g) and cytokine production (h) was analyzed at 48 hrs. Data are mean ± s.e.m. (n = 4 mice per group) and representative of two independent experiments. P values by two-tailed unpaired t-test. See also Extended Data Figs. 7-9.
Figure 6.
Figure 6.. Effect of Siglec-15 mAb on established tumors in syngeneic mice
(a) The % of divided OT-I T-cells (1×10⁵/well) was analyzed by CFSE dilution after co-culture with irradiated 293T-KbOVA-S15+ or control cells (2×10⁴/well) in a 96-well plate for 5 days with 10 μg/ml Siglec-15 antibody (α-S15) or isotype control mAb (Control). (b) The % of divided OT-I T-cells (2×10⁵/well) was analyzed by CFSE dilution after co-culture for 3 days with S15KO or WT BMDMs (2×10⁴/well) pulsed with 0.1ng/ml OVA257-264 in the presence of 10 μg/ml α-S15 or isotype control antibody. In a and b, data are mean ± s.e.m. (n = 3 cell cultures). P values by two-tailed unpaired t-test. (c) MC38 tumor cells (3×10⁵) mixed with WT BMDMs (2×10⁵) were s.c. injected into WT C57BL/6 mice. Mice were treated with 200μg α-S15 or control antibody from day 5, every 4 days for 4 doses in total. Data are mean ± s.e.m. (n = 5 mice per group). P values by two-way ANOVA. (d, e) Naïve splenic CD8+ T-cells isolated from PD-1 KO mice were labeled with CFSE and co-cultured with WT BMDMs in the presence of anti-CD3 and α-S15 or control antibody. T-cell proliferation (d) and cytokine production (e) was analyzed at 72 hrs. Data are mean ± s.e.m. (n = 3 or 4 cell cultures). P values by two-tailed unpaired t-test. (f, g) IL-2 (f) and TNF-α (g) production from human PBMCs after stimulation with anti-CD3 and SEB in the presence of α-S15, α-PD-1 (Nivolumab) or their control antibodies for 72hrs. Data are mean ± s.e.m. (n = 5 cell cultures). P values by two-tailed unpaired t-test (n.s., not significant; P = 0.1759). (h) MC38-S15+ cells were s.c. injected into WT C57BL/6 mice (4×10⁵/mouse). Mice were treated with 200μg α-S15 or control antibody from day 6, every 4 days for 4 doses in total. Data are mean ± s.e.m. (n = 5 mice per group). P values by two-way ANOVA. (i) MC38-S15+ cells were i.v. injected into WT C57BL/6 mice (1×10⁵/mouse). Mice were treated with 400 μg α-S15 or control antibody from day 2, every 4 days for 6 doses in total. Lungs were harvested on day 28 and tumor nodules were counted. Data are mean ± s.e.m. (n = 8 mice per group). P values by two-tailed unpaired t-test. All data are representative of two or three independent experiments. See also Extended Data Fig. 10.

Comment in

References

    1. Chen L & Flies DB Molecular mechanisms of T cell co-stimulation and co-inhibition. Nat Rev Immunol 13, 227–242 (2013). - PMC - PubMed
    1. Chen L Co-inhibitory molecules of the B7-CD28 family in the control of T-cell immunity. Nat Rev Immunol 4, 336–347 (2004). - PubMed
    1. Greenwald RJ, Freeman GJ & Sharpe AH The B7 family revisited. Annu Rev Immunol 23, 515–548 (2005). - PubMed
    1. Chen L, et al. Costimulation of antitumor immunity by the B7 counterreceptor for the T lymphocyte molecules CD28 and CTLA-4. Cell 71, 1093–1102 (1992). - PubMed
    1. Leach DR, Krummel MF & Allison JP Enhancement of antitumor immunity by CTLA-4 blockade. Science 271, 1734–1736 (1996). - PubMed

Publication types