. 2019 Apr;25(4):612-619.
doi: 10.1038/s41591-019-0356-z. Epub 2019 Mar 4.

Glutaminyl cyclase is an enzymatic modifier of the CD47- SIRPα axis and a target for cancer immunotherapy

Affiliations

Glutaminyl cyclase is an enzymatic modifier of the CD47- SIRPα axis and a target for cancer immunotherapy

Meike E W Logtenberg et al. Nat Med. 2019 Apr.

Abstract

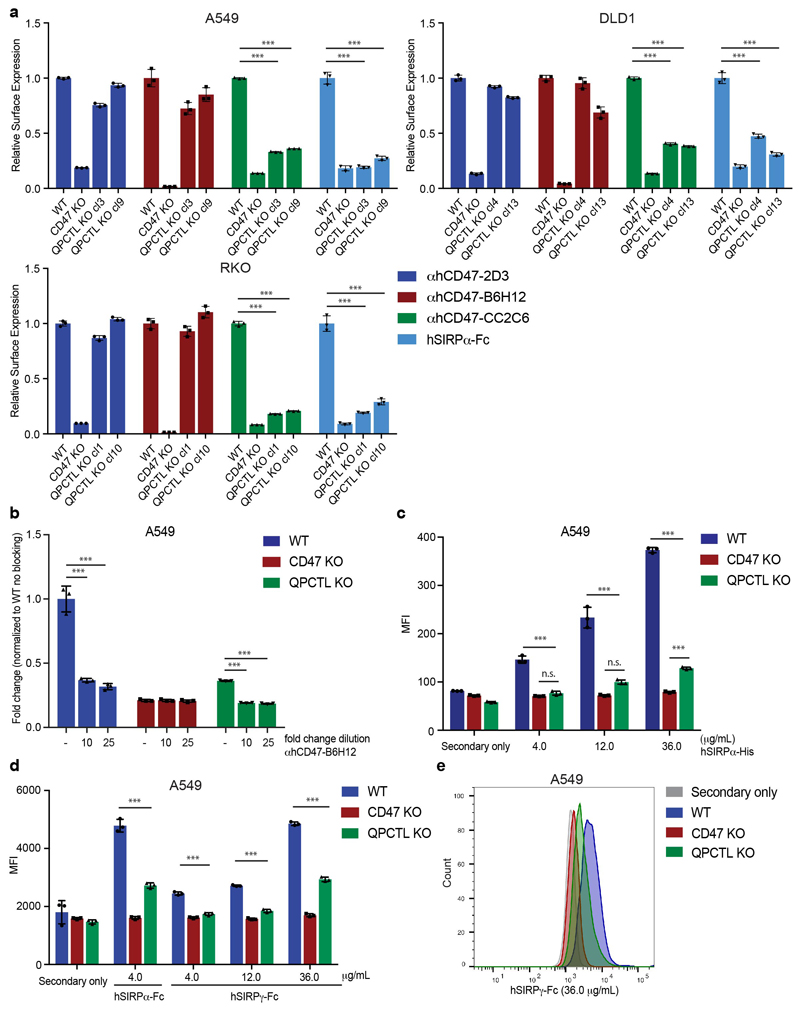
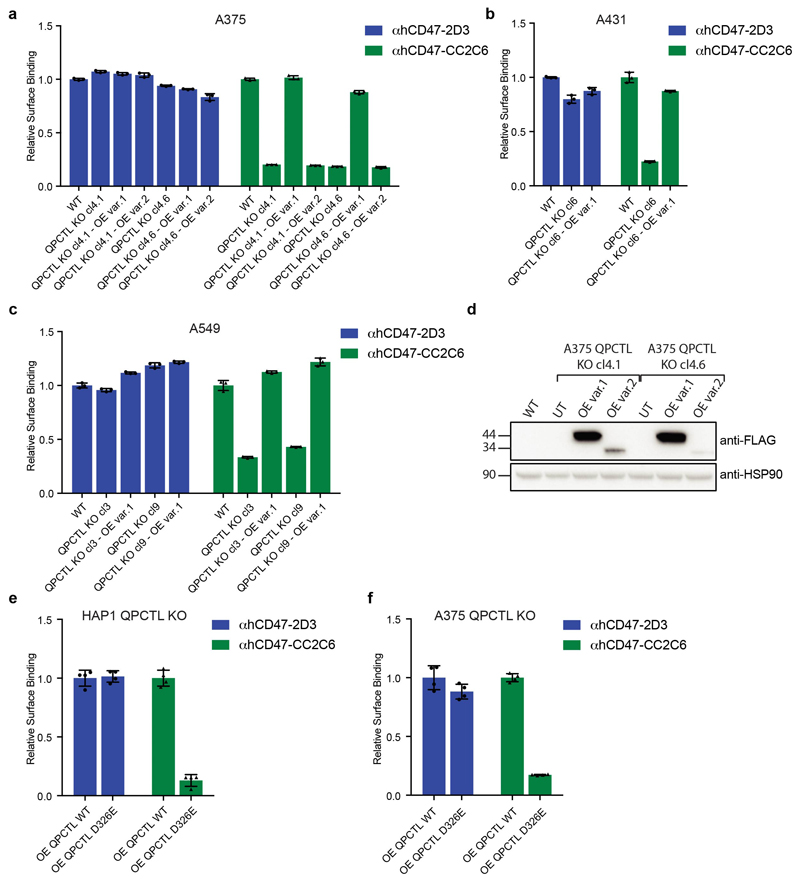
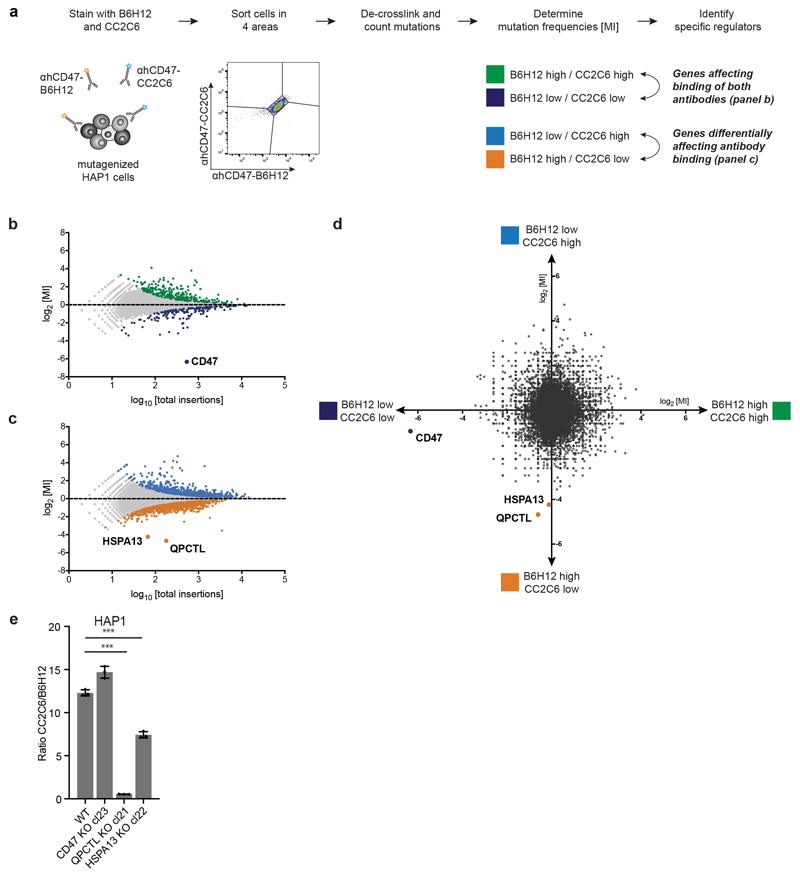
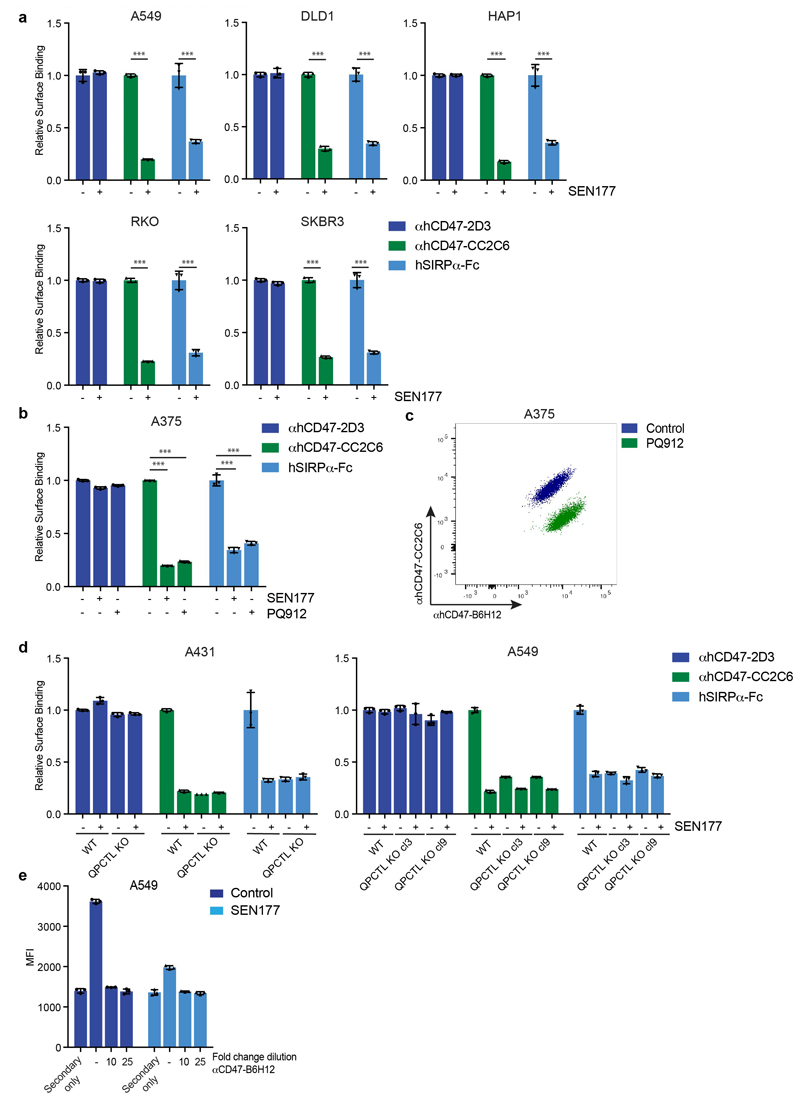
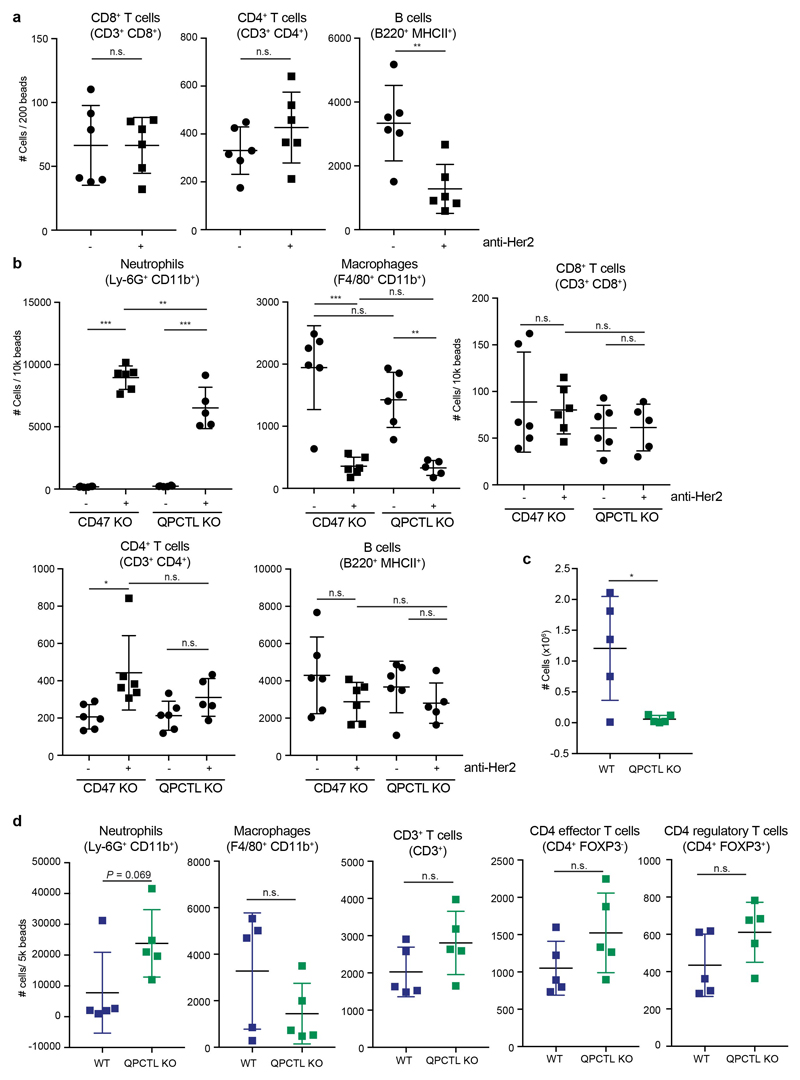
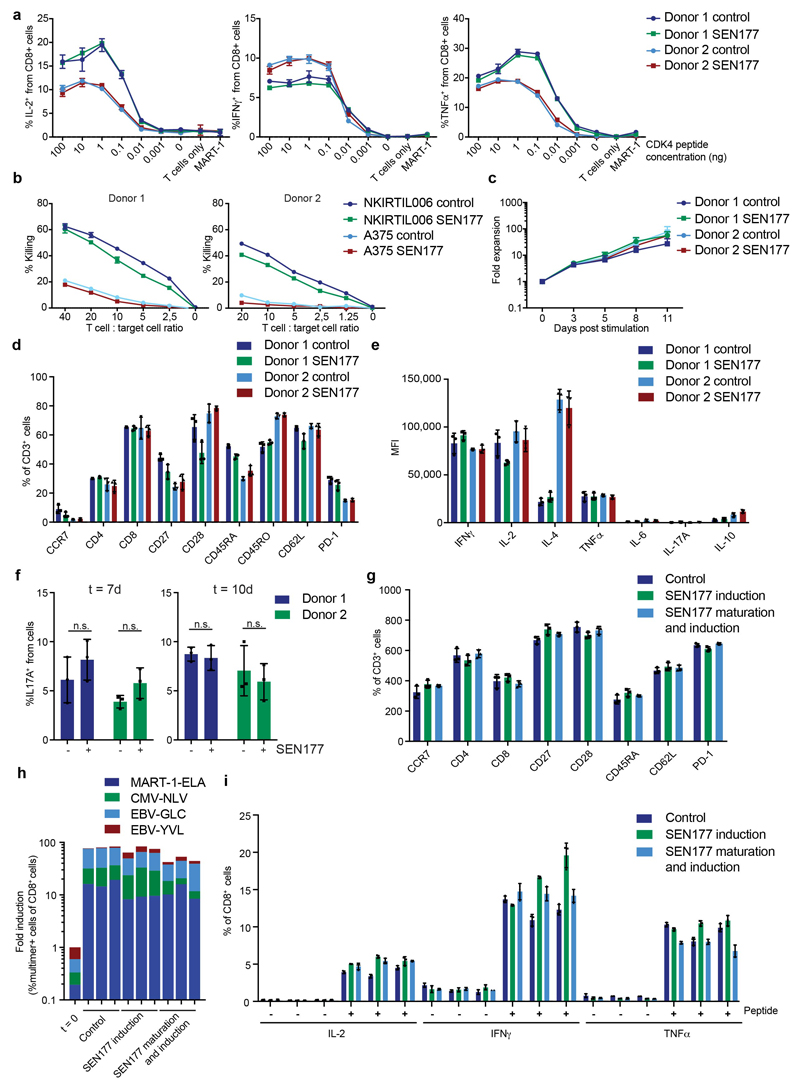
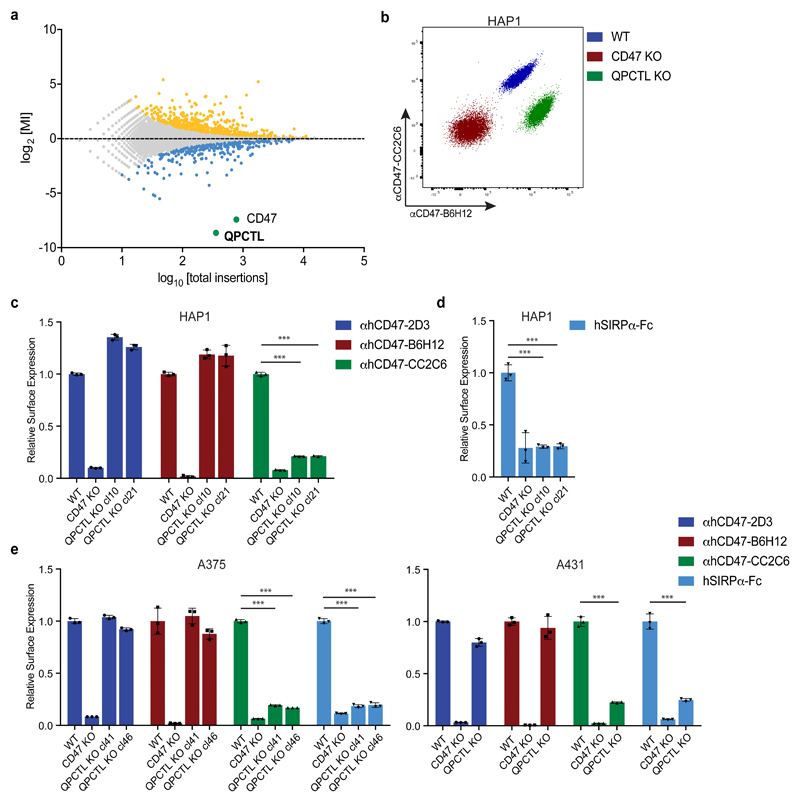
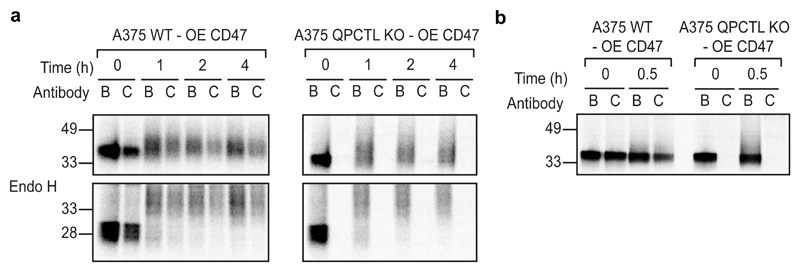
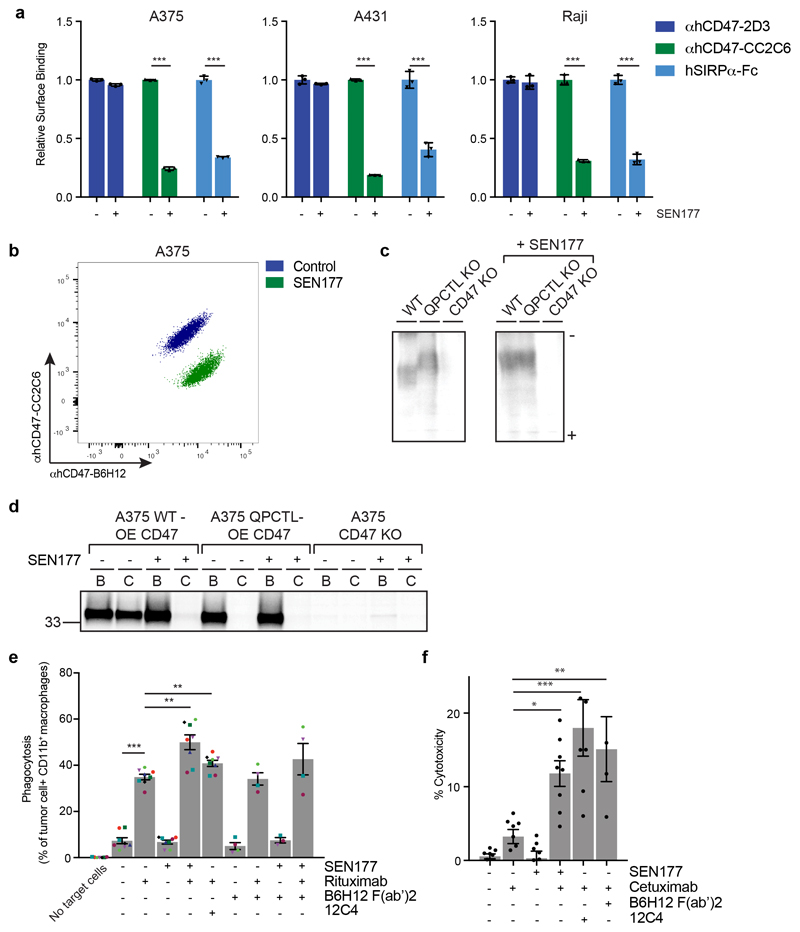
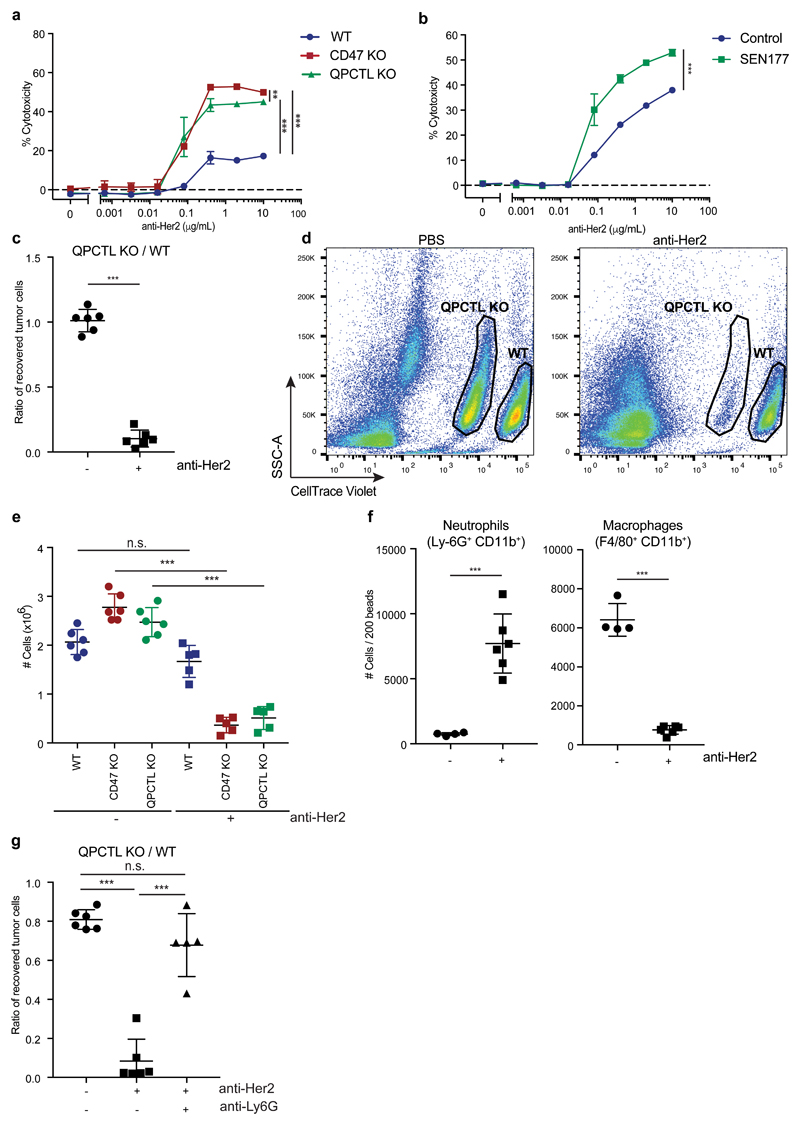
Cancer cells can evade immune surveillance through the expression of inhibitory ligands that bind their cognate receptors on immune effector cells. Expression of programmed death ligand 1 in tumor microenvironments is a major immune checkpoint for tumor-specific T cell responses as it binds to programmed cell death protein-1 on activated and dysfunctional T cells1. The activity of myeloid cells such as macrophages and neutrophils is likewise regulated by a balance between stimulatory and inhibitory signals. In particular, cell surface expression of the CD47 protein creates a 'don't eat me' signal on tumor cells by binding to SIRPα expressed on myeloid cells2-5. Using a haploid genetic screen, we here identify glutaminyl-peptide cyclotransferase-like protein (QPCTL) as a major component of the CD47-SIRPα checkpoint. Biochemical analysis demonstrates that QPCTL is critical for pyroglutamate formation on CD47 at the SIRPα binding site shortly after biosynthesis. Genetic and pharmacological interference with QPCTL activity enhances antibody-dependent cellular phagocytosis and cellular cytotoxicity of tumor cells. Furthermore, interference with QPCTL expression leads to a major increase in neutrophil-mediated killing of tumor cells in vivo. These data identify QPCTL as a novel target to interfere with the CD47 pathway and thereby augment antibody therapy of cancer.


Conflict of interest statement

Competing interest

M.E.W.L., M.R., T.R.B., F.A.S., J.H.W.L. and T.N.S. are inventors on a patent application that covers manipulation of the CD47 – SIRPα axis via QPCTL.

T.N.S. is advisor for Adaptive Biotechnologies, AIMM Therapeutics, Allogene Therapeutics, Amgen, Merus, and Neon Therapeutics, is recipient of grant/research support from MSD, Bristol-Myers Squibb, and Merck KgaA, is stockholder in AIMM Therapeutics, Allogene Therapeutics, Merus, Neogene Therapeutics and Neon Therapeutics, and is venture partner at Third Rock Ventures. T.R.B. is cofounder and SAB member of Haplogen GmbH and cofounder and managing director of Scenic Biotech. J.H.W.L. is founder, advisor and shareholder of TigaTx. J.H.B. is recipient of grant/ research support from Bristol-Myers Squibb, Medimmune and Neon Therapeutics. K.F., H.L.M. and T.K.v.d.B are recipients of research support from Synthon Biopharmaceuticals BV. J.B.A.G.H. is advisor to Bristol-Myers Squibb, MSD, Novartis, Roche/Genentech, Pfizer, IPSEN, AZ/MedImmune, Bayer, Seattle Genetics, Immunocore, Gadeta, Neon Therapeutics, and Celsius Therapeutics, and is recipient of grant/ research support from Bristol-Myers Squibb, MSD, Novartis, Neon Therapeutics.

Figures

Extended Figure 1
Extended Figure 1. QPCTL deletion leads to reduced binding of recombinant SIRPα and SIRPγ
a, Cell surface binding of αhCD47-2D3, αhCD47-B6H12, αhCD47-CC2C6 and hSIRPα-Fc to WT, CD47 and QPCTL KO lung cancer (A549) (upper left panel), colorectal cancer (DLD1) (upper right panel) and rectal carcinoma (RKO) (lower left panel) cells, as determined by flow cytometry. b, Cell surface binding of human SIRPα-Fc (hSIRPα-Fc) to lung cancer (A549) WT, CD47 KO and QPCTL KO cells alone or in combination with blocking antibody αhCD47-B6H12, as determined by flow cytometry. c, Cell surface binding of indicated concentrations of human SIRPα-His (hSIRPα-His) to WT, CD47 KO and QPCTL KO lung cancer (A549) cells, as determined by flow cytometry. d, Cell surface binding of indicated concentrations of hSIRPα-Fc and human SIRPγ-Fc (SIRPγ-Fc) to WT, CD47 KO and QPCTL KO lung cancer (A549) cells, as determined by flow cytometry. e, Representative plot (see d) of hSIRPγ-Fc binding (36.0 μg/mL) to WT, CD47 KO and QPCTL KO lung cancer (A549) cells. Values in a-d indicate MFI relative to WT cells stained with the same reagent (a), MFI relative to WT cells without blocking antibody (b) or MFI values (c, d). Data represent n=3 biological replicates (a-e) and mean ± s.d. of triplicates (a-d). ***P≤0.0001 by one-way ANOVA with multiple comparison correction (a-c) or unpaired two-sided t-test (d); n.s., not significant. Data are representative of at least two (a-e) independent experiments. MFI, mean fluorescence intensity; WT, wild-type; KO, knock-out.
Extended Figure 2
Extended Figure 2. QPCTL regulates binding of αhCD47-CC2C6
a, Cell surface binding of αhCD47-2D3 and αhCD47-CC2C6 to WT, QPCTL KO and QPCTL KO cells reconstituted with FLAG-tagged cDNA of QPCTL isoform 1 (OE var.1) or QPCTL isoform 2 (OE var.2) melanoma (A375) (a) epidermoid carcinoma (A431) (b) and lung cancer (A549) cells (c), as determined by flow cytometry. d, Western blot analysis of WT, QPCTL KO and QPCTL KO melanoma (A375) cells reconstituted with FLAG-tagged cDNA of QPCTL isoform 1 (OE var.1) or QPCTL isoform 2 (OE var.2). Blot image has been cropped to show the relevant bands, and molecular mass markers are indicated (in kD). See Source Data for the uncropped western blot. e, Cell surface binding of αhCD47-CC2C6 and αhCD47-2D3 to HAP1 QPCTL KO cells reconstituted with QPCTL var.1 or a catalytically inactive QPCTL variant (QPCLT var.1 D326E), as determined by flow cytometry. f, Cell surface binding of αhCD47-CC2C6 and αhCD47-2D3 to QPCTL KO melanoma (A375) cells reconstituted with QPCTL var.1 or QPCTL var.1 (D326E), as determined by flow cytometry. Values in a-c, e, f indicate MFI relative to WT cells stained with the same reagent. Data represent n=3 biological replicates and mean ± s.d. of triplicates (a-c, e-f). Data are representative of at least two (a-c, d, e-f) independent experiments. OE, over-expression.
Extended Figure 3
Extended Figure 3. Two-dimensional genetic screen to reveal selective modifiers of αhCD47-CC2C6 binding
a, Schematic overview of FACS-based haploid genetic screen on αhCD47-BH612 (“B6H12”) and αhCD47-CC2C6 (“CC2C6”) double-stained cells, employing a 4-way sorting strategy to distinguish regulators that affect CD47 levels or that affect the αhCD47-CC2C6/SIRPα binding site of CD47. b, c, Results of the genetic screen for general CD47 modulators (b) and αhCD47-CC2C6/SIRPα binding site regulators (c). Dots represent individual genes. The relative mutation frequency (MI) in the B6H12HIGH/CC2C6HIGH versus B6H12LOW/CC2C6LOW (b) and B6H12LOW/CC2C6HIGH versus B6H12HIGH/CC2C6LOW cell population (c) is plotted against the total number of insertions mapped per gene. Significantly enriched genes (FDR-corrected P<0.05) are colored according to channel (B6H12HIGH/CC2CHIGH, green; B6H12LOW/CC2CLOW, dark blue; B6H12LOW/CC2CHIGH, light blue; B6H12HIGH/CC2C6LOW, orange) and selected regulators are labelled. n=3,253,240 (b) and n=3,209,992 insertions (c) were identified and data were analysed by two-sided Fisher’s Exact test with multiple comparison correction. d, Combined results for 4-way-sort screen. Dots represent individual genes. x-axis shows relative mutation frequency (MI) for the B6H12HIGH/CC2C6HIGH versus B6H12LOW/CC2C6LOW cell population, y-axis shows relative mutation frequency for the B6H12LOW/CC2C6HIGH versus B6H12HIGH/CC2C6LOW cell population. Selected regulators are highlighted. e, Ratio of αhCD47-CC2C6 and αhCD47-BH612 cell surface binding to HAP1 WT, CD47 KO, QPCTL KO and HSPA13 KO cells, as determined by flow cytometry. Values indicate ratio of MFI of αhCD47-CC2C6/αhCD47-BH612 for each cell population. Data represent n=3 biological replicates and mean ± s.d. of triplicates. ***P=0.0001 by one-way ANOVA with multiple comparison correction. Data are representative of one (a-d) or two (e) independent experiments MI, mutation index; WT, wild-type; KO, knockout; MFI, mean fluorescence intensity.
Extended Figure 4
Extended Figure 4. Glutaminyl cyclase inhibition leads to reduced binding of recombinant hSIRPγ
a, Cell surface binding of αhCD47-2D3, αhCD47-CC2C6 and hSIRPα-Fc to control (DMSO)-treated (-) or SEN177-treated (+) lung cancer (A549), colorectal (DLD1), HAP1, rectal carcinoma (RKO) and breast cancer (SKBR3) cells, as determined by flow cytometry. Data represent n=3 biological replicates and mean ± s.d. of triplicates. ***P≤0.000695 by unpaired two-sided t-test. b, Cell surface binding of αhCD47-2D3, αhCD47-CC2C6 and hSIRPα-Fc to control (DMSO)-treated (-), SEN177-treated, and PQ912-treated melanoma (A375) cells, as determined by flow cytometry. Data represent n=3 biological replicates and mean ± s.d. of triplicates. ***P=0.0001 by one-way ANOVA with multiple comparison correction. c, Flow cytometry plot of surface binding of αhCD47-B6H12 and αhCD47-CC2C6 to control-treated and PQ912-treated melanoma (A375) cells. Data are representative of two independent experiments with similar results (n=3 biological replicates per experiment). d, Cell surface binding of αhCD47-2D3, αhCD47-CC2C6 and hSIRPα-Fc to control (DMSO)-treated (-) and SEN177-treated (+) wild-type and QPCTL-knockout epidermoid carcinoma (A431) and lung cancer (A549) cells, as determined by flow cytometry. Data represent n=3 biological replicates and mean ± s.d. of triplicates. e, Cell surface binding of secondary antibody alone, hSIRPα-Fc (followed by secondary antibody) or hSIRPα-Fc in the presence of the CD47 blocking antibody αhCD47-B6H12 (followed by secondary antibody) to control (DMSO)-treated (-) or SEN177-treated lung cancer (A549) cells, as determined by flow cytometry. Data represent n=3 biological replicates and mean ± s.d. of triplicates. Values indicate MFI relative to WT cells stained with the same reagent (a, b, d) or MFI (e). Data are representative of one (e) or at least two independent experiments (a-d)
Extended Figure 5
Extended Figure 5. Analysis of phagocytosis.
a,b Representative images of gating strategy and phagocytosis (a) and examples of staining (b), as determined by ImageStream analysis. Data are representative of four independent experiments with similar results.
Extended Figure 6
Extended Figure 6. Synergy between blockade of CD47 pyroglutamate formation and tumors opsonization in tumor cell killing by macrophages and neutrophils.
a, MFI of lamin B-Turquoise of the total CD11b+ macrophage population in samples incubated with control (DMSO)-treated (-) or SEN177-treated (+) Turquoise-expressing Burkitt’s lymphoma (Raji) cells in the presence or absence of the anti-human CD20 antibody Rituximab, CD47-blocking F(ab’)2 fragment B6H12, or SIRPα blocking antibody 12C4, as determined by ImageStream analysis. Symbols represent individual donors. Data represent mean ± s.d. of independent donors. ***P<0.0001; **P=0.0016; *P=0.0256 by one-way ANOVA with multiple comparison correction. b, Specific lysis of control (DMSO)-treated (-) or SEN177-treated (+) WT, QPCTL KO or CD47 KO epidermoid carcinoma (A431) cells by human neutrophils in the presence or absence of the anti-human EGFR antibody cetuximab in a 4 hour 51Cr-release assay. Data represent mean ± s.d. of independent donors. ***P<0.0001; 0.0325≥*P0.0207 by one-way ANOVA with multiple comparison correction. n.s.; not significant. c, Flow cytometry plot of cell surface binding of anti-human CD20 antibody to Burkitt’s lymphoma (Raji) cells (left panel) and anti-human EGFR antibody to epidermoid carcinoma (A431) cells (right panel) treated with control (DMSO) or SEN177 for 4 days. Data are representative of one (c) or at least three independent experiments (a, b) representing 4 donors (for B6H12(Fab’)2 conditions), 8 donors (all other conditions) (a), and 8 donors (b).
Extended Figure 7
Extended Figure 7. QPCTL deficiency and QPCTL inhibition enhances tumor-specific antibody-induced killing of mouse tumor cells by mouse effector cells.
a, Cell surface binding of anti-mouse CD47 antibody MIAP301 (αmCD47-MIAP301) and mouse SIRPα-Fc (mSIRPα-Fc) to WT, CD47 KO and QPCTL bulk KO (KO#1 and KO#2) murine melanoma (B16F10) cells, and WT, CD47 KO and QPCTL KO (cl8 and cl30) Her2-expressing mouse pro-B (Ba/F3-Her2) cells, as determined by flow cytometry. b, Cell surface binding of αmCD47-MIAP301 and mSIRPα-Fc to WT, QPCTL KO or QPCTL KO murine melanoma (B16F10) cells reconstituted with the murine QPCTL cDNA (OE), as determined by flow cytometry. c, Cell surface binding of αmCD47-MIAP301 and mSIRPα-Fc to control (DMSO)-treated (-) or SEN177-treated (+) murine melanoma (B16F10) or Her2-expressing murine pro-B (Ba/F3-Her2) cells, as determined by flow cytometry. (a-c) Data represent n=3 biological replicates and mean ± s.d. of triplicates. ***P≤0.0001 by one-way ANOVA with multiple comparison correction (a) or unpaired two-sided t-test (c). d, Flow cytometry plots of cell surface binding of anti-human Her2 antibody to WT, CD47 KO or QPCTL KO Ba/F3-Her2 cells (left), or control (DMSO)-treated or SEN177-treated Ba/F3-Her2 cells (right), as determined by flow cytometry. Data are representative of two independent experiments with similar results (n=3 biological replicates per experiment) (left graph) or one experiment with two biological replicates (right graph). e, Specific lysis of control (DMSO)-treated (-) and SEN177-treated (+) CD47 KO and QPCTL KO murine pro-B cells (Ba/F3-Her2) by human neutrophils in the presence of anti-Her2 (IgA1) in a 4 hour 51Cr-release assay. Data are representative of n=3 biological replicates and represent ± s.d. of triplicates of one representative donor. f, Specific lysis of WT, CD47 KO and QPCTL KO murine pro-B cells (Ba/F3-Her2) by murine immune cells isolated from whole blood in the presence or absence of anti-Her2 (IgA1) in a 4 hour 51Cr-release assay. Data are representative of n=3 biological replicates and represent mean ± s.d. of triplicates of one representative donor. ***P≤0.0007 by one-way ANOVA with multiple comparison correction. g, Specific lysis of control (DMSO)-treated (-) or SEN177-treated (+) murine pro-B cells (Ba/F3-Her2) by murine immune cells isolated from whole blood in the presence or absence of anti-Her2 (IgA1) in a 4 hour 51Cr-release assay. Data represent n=3 biological replicates and represent mean ± s.d. of triplicates of one representative donor. ***P<0.0001 by unpaired two-sided t-test. Values in a-c indicate MFI relative to WT cells stained with the same reagent. Data are representative of at least two independent experiments (a-g).
Extended Figure 8
Extended Figure 8. QPCTL deficiency leads to enhanced tumor cell control by tumor specific antibodies
a, Schematic representation of in vivo set-up. b, Absolute number (see Fig. 4c) of recovered tumor cells from mice injected with 1:1 mixtures of WT and QPCTL KO Ba/F3-Her2 cells that were then treated with control (PBS) (-) or anti-Her2 (IgA1) (+). n=6 control-treated animals; n=6 anti-Her2-treated animals. ***P≤0.0003 by unpaired two-sided t-test. c, Ratio of in vivo killing of target cells in mice injected with a 1:1 mixture of WT and CD47-KO cells, or a 1:1 mixture of WT and QPCTL KO Ba/F3-Her2 cells, and that were either treated with control (PBS) (-) or anti-Her2 (IgA1) antibody (+).n=6 control-treated animals (left graph); n=5 anti-Her2-treated animals (left graph); n=6 control-treated animals (right graph); n=6 anti-Her2-treated animals (right graph). ***P<0.0001 unpaired two-sided t-test. d, Absolute number (see Extended Data Fig. 8c) of recovered tumor cells in mice injected with a 1:1 mixture of WT and CD47 KO cells, or a 1:1 mixture of WT and QPCTL KO Ba/F3-Her2 cells, and that were either treated with control (PBS) (-) or anti-Her2 (IgA1) antibody (+). n=6 control-treated animals (left graph); n=5 anti-Her2-treated animals (left graph); n=6 control-treated animals (right graph); n=6 anti-Her2-treated animals (right graph). ***P<0.0001 by one-way ANOVA with multiple comparison correction; n.s., not significant. Dots represent mice treated with control (PBS), squares represent mice treated with anti-Her2 (IgA1) (b-d) and represent mean ± s.d. of individual mice (b-d). Data are representative of two independent experiments (b) or one experiment (c, d).
Extended Figure 9
Extended Figure 9. QPCTL deficiency in combination with tumor specific antibodies leads to an enhanced neutrophil influx
a, Absolute number (see Fig. 4c, d and f) of CD8+ T (CD3+ CD8+), CD4+ T (CD3+ CD4+) or B (B220+ MHCII+) cells present in mice that received a 1:1 mixture of WT and QPCTL KO Ba/F3-Her2 cells, and that were either control (PBS)-treated (-) or treated with anti-Her2 (IgA1) (+). n=6 control-treated animals; n=6 anti-Her2-treated animals. **P=0.0050. by unpaired two-sided t-test; n.s., not significant. b, Absolute number of peritoneal neutrophils (Ly-6G+/CD11b+), macrophages (F4/80+ CD11b+), CD8+ T (CD3+/CD8+), CD4+ T (CD3+/CD4+) and B (B220+/MHCII+) cells present in recipients of a 1:1 mixture of WT and QPCTL KO Ba/F3-Her2 cells that were control (PBS)-treated (-) or treated with anti-Her2 (IgA1) (+)(see Extended Data Fig. 8c). n=6 control-treated animals injected with mixture of WT/CD47 KO cells; n=6 anti-Her2-treated animals injected with mixture of WT/CD47 KO cells; n=6 control-treated animals injected with mixture of WT/QPCTL KO cells; n=5 anti-Her2-treated animals injected with mixture of WT/QPCTL KO cells. ***P<0.0001; 0.0015≤**P≤0.0022; *P=0.0226 by one-way ANOVA with multiple comparison correction; n.s., not significant. c, Absolute number of recovered tumor cells in recipients of WT (blue) or QPCTL KO (green) Ba/F3-Her2 cells that were treated with anti-Her2 (IgA1) antibody. n = 5 animals injected with WT cells. n = 5 animals injected with QPCTL KO cells. *P=0.0161 by unpaired two-sided t-test; n.s., not significant. d, Absolute number of peritoneal neutrophils (Ly-6G+/CD11b+), macrophages (F4/80+ CD11b+) and CD3+ T cells, CD4 effector (CD4+/FOXP3-) and CD4 regulatory (CD4+/FOXP3+) T cells present in recipients of WT (blue) or QPCTL KO (green) Ba/F3-Her2 cells that were treated with anti-Her2 (IgA1) (see Extended Data Fig. 7g). n = 5 animals injected with WT cells. n = 5 animals injected with QPCTL KO cells. n.s., not significant. Dots represent mice treated with control (PBS), squares represent mice treated with anti-Her2 (IgA1) (a-d) and represent mean ± s.d. of individual mice (a-d). Data are representative of two independent experiments (a) or one experiment (b-d).
Extended Figure 10
Extended Figure 10. Expansion, differentiation, cytokine production and killing capacity of human T cells are unaltered by glutaminyl cyclase inhibition
To determine the effect of glutaminyl cyclase inhibition on different aspects of T cell function, in vitro T cell cytokine production and secretion, T cell phenotype, T cell killing capacity, and T cell induction by autologous dendritic cells (DCs) was assessed in the presence of control (DMSO) or SEN177. a and b, CDK4 TCR-transduced T cells (CDK4-specific T cells) from two donors were cultured for 4 days in the presence of control (DMSO) or SEN177 a, Intracellular cytokine production of control (DMSO)-treated or SEN177-treated CDK4-specific T cells upon co-culture with JY cells pulsed with the indicated concentrations of CDK4 or MART-1 peptide, as analysed by flow cytometry. Values indicate percentage of IL-2+ (left), IFNγ+ (middle) and TNFα+ (right) CD8+ cells of total CD8+cells. Data represent n=3 biological replicates and mean ± s.d. of triplicates. b, Specific lysis of CDK4+ (NKIRTIL006) and CDK4- (A375) tumor cells by control (DMSO)-treated or SEN177-treated CDK4-specific T cells, as determined in a 4 hour 51Cr-release assay. Data represent n=3 (Donor 1), n=2 (Donor 2 – NKIRTIL006 cocultures) or n=1 (donor 2 - A375 cocultures) biological replicates and mean ± s.d of triplicates (Donor 1). c-e, Peripheral Blood Lymphocytes (PBLs) from two donors were isolated, stimulated with anti-CD3/CD28 beads (2:1 bead to T cell ratio), and cultured for two weeks in the presence of control (DMSO) or SEN177. Data represent n=3 biological replicates and mean ± s.d. of triplicates. c, Fold expansion of control (DMSO)-treated or SEN177-treated CDK4-specific T cells over a period of 11 days. d, Surface expression of CCR7, CD4, CD8, CD27, CD28, CD45RA, CD45RO, CD62L and PD-1 on CD3+ T cells after 14 days of control (DMSO) treatment or SEN177 treatment, as determined by flow cytometry. Values indicate percentage of CD3+ cells positive for the indicated marker. e, IFNγ, IL-2, IL-4, TNFα, IL-6, IL-17A and IL-10 secretion of T cells after 14 days of control (DMSO) treatment or SEN177 treatment and subsequent re-stimulation with anti-CD3/CD28 beads, as determined by CBA bead array. Values indicate MFI. f, Differentiation of control (DMSO)-treated (-) or SEN177-treated (+) CD4+ T cells into Th17 cells after 7 days (t= 7d) or 10 days (t= 10d) of culture, as determined by flow cytometry. Values indicate the percentage of IL17A+ cells of total lymphocytes. Data represent n=3 biological replicates and mean ± s.d. of triplicates. n.s., not significant by unpaired two-sided t-test. h and i, T cells were induced by autologous dendritic cells (DCs) under three conditions; control (DMSO) was present during DC maturation and during T cell induction (“control”), control (DMSO) was present during DC maturation and SEN177 was present during T cell induction (“SEN177 induction)”, or SEN177 was present during both DC maturation and T cell induction (“SEN177 maturation and induction”). h, Surface expression of CCR7, CD4, CD8, CD27, CD28, CD45RA, CD62L and PD-1 on CD3+ T cells 12 days after start of induction by autologous DCs. Values reflect percentage of CD3+ cells positive for the indicated marker. g, Percentage of MHC multimer positive CD8+ T cells before induction (t = 0) and 11 days after start of induction by autologous DCs, as determined by flow cytometry. Values indicate the percentage of MHC multimer (HLA-A*02:01 multimers loaded with the MART-1-ELA, CMV-NLV, EBV-GLC or EBV-YVL epitopes) CD8+ cells of total CD8+ cells. i, Intracellular cytokine production of CD8+ T cells 6 days after start of induction and subsequent re-stimulation with unloaded DCs (-) or peptide-loaded DCs (+).Values indicate percentage of IL-2+ (left), IFNγ+ (middle) and TNFα+ (right) CD8+ cells of total CD8+ cells. Data are representative of one (a-i) independent experiment.
Fig. 1
Fig. 1. Identification of QPCTL as a modulator of CD47-SIRPα binding.
a, Flow-cytometry-based haploid genetic screen for modulators of CD47, as detected by anti-human CD47 antibody clone CC2C6 (αhCD47-CC2C6) binding. Dots represent individual genes; x axis indicates the number of disruptive insertions per gene; y axis shows the frequency of independent insertions in cells with high CD47 expression (CD47-CC2C6HIGH channel) over the frequency of insertions in cells with low CD47 expression (CD47-CC2C6LOW channel) for each gene. Light-blue and orange dots indicate genes with significant enrichment of insertions within the CD47-CC2C6HIGH and CD47-CC2C6LOW populations, respectively. Green dots represent CD47 and QPCTL. Significant enrichment of insertions (total amount of insertions n=3,254,889) was determined by two-sided Fisher’s Exact test with multiple comparison correction (FDR-corrected P < 0.05). b, Flow cytometry plot of surface binding of anti-human CD47 antibody clone B6H12 (αhCD47-B6H12) and αhCD47-CC2C6 to HAP1 WT, CD47 KO and QPCTL KO (cl21) cells. Data are representative of two independent experiments with similar results (n=3 biological replicates per experiment). c, Cell surface binding of anti-human CD47 antibody clone 2D3 (αhCD47-2D3), αhCD47-B6H12 and αhCD47-CC2C6 to HAP1 WT, CD47 KO or QPCTL KO cells, as determined by flow cytometry. Values indicate MFI relative to WT cells stained with the same reagent. Data represent n=3 biological replicates and mean ± s.d. of triplicates. ***P=0.0001 by one-way analysis of variance (ANOVA). d, Cell surface binding of human SIRPα-Fc (hSIRPα-Fc) to HAP1 WT, CD47 KO or QPCTL KO cells (cl10 and cl21), as determined by flow cytometry. Values indicate MFI relative to WT cells. Data represent n=3 biological replicates and mean ± s.d. of triplicates. ***P=0.0001 by one-way ANOVA. e, Cell surface binding of αhCD47-2D3, αhCD47-B6H12, αhCD47-CC2C6 and hSIRPα-Fc to WT, CD47 KO and QPCTL KO (cl4.1 and cl4.6) A375 melanoma cells and to WT, CD47 KO and QPCTL KO (cl6) A431 epidermoid carcinoma cells, as determined by flow cytometry. Values indicate MFI relative to WT cells stained with the same reagent. Data represent n=3 biological replicates and mean ± s.d. of triplicates. ***P≤0.0001 by one-way ANOVA (left graph) or unpaired two-sided t-test (right graph). Data are representative of one (a), or at least two (b-e) independent experiments. MI, mutation index; MFI, mean fluorescence intensity; WT, wild-type; KO, knock-out.
Fig. 2
Fig. 2. Pyroglutamate formation occurs early in the CD47 protein life-cycle and is fully dependent on QPCTL.
a, SDS-PAGE analysis of αhCD47-B6H12 (B) or αhCD47-CC2C6 (C) immunoprecipitates from CD47-HA-overexpressing WT or QPCTL KO (cl4.1) A375 melanoma cells after a 0, 1, 2 or 4 hours (h) chase period following a 30’ 35S methionine/cysteine labelling. b, SDS-PAGE analysis of αhCD47-B6H12 (B) or αhCD47-CC2C6 (C) immunoprecipitates from CD47-HA-overexpressing WT or QPCTL KO (cl4.1) A375 melanoma after a 0 or 30’ chase following a 10’ 35S methionine/cysteine labelling. Data are representative of two (a, b) independent experiments with similar results. Blot images are cropped to show the relevant bands, and molecular mass markers are indicated (in kD). See Source Data for the uncropped western blots. OE, over expression; B, αhCD47-B6H12; C, αhCD47-CC2C6.
Fig. 3
Fig. 3. Synergy between blockade of CD47 pyroglutamate formation and tumor opsonization in tumor cell killing by macrophages and neutrophils.
a, Cell surface binding of αhCD47-2D3, αhCD47-CC2C6 and hSIRPα-Fc to control (DMSO)-treated (-) or SEN177-treated (+) melanoma (A375), epidermoid carcinoma (A431) and Burkitt’s lymphoma (Raji) cells, as determined by flow cytometry. Values indicate MFI relative to WT cells stained with the same reagent. Data represent n=3 biological replicates and mean ± s.d. of triplicates. ***P≤0.000373 by unpaired two-sided t-test. b, Flow cytometry plot of surface binding of αhCD47-B6H12 and αhCD47-CC2C6 to control-treated or SEN177-treated melanoma (A375) cells. Data are representative of two independent experiments with similar results (n=3 biological replicates per experiment). c, Isoelectric focusing analysis of αhCD47-B6H12 immunoprecipitates from CD47-HA-overexpressing WT, CD47-HA-overexpressing QPCTL KO, or CD47 KO melanoma (A375) cells left untreated (-) or treated with SEN177 (+). Data are representative of two independent experiments with similar results. Gel image is cropped to show the relevant bands. See Source Data for the uncropped gel. d, SDS-PAGE analysis of αhCD47-B6H12 (B) or αhCD47-CC2C6 (C) immunoprecipitates from CD47-HA-overexpressing WT, QPCTL KO (cl4.1), or CD47 KO melanoma (A375) cells after a 30’ 35S methionine/cysteine labelling in the presence (+) or absence (-) of SEN177. Data are from one experiment. Blot image is cropped to show the relevant bands, and molecular mass markers are indicated (in kD). See Source Data for the uncropped western blot. e, Phagocytosis of control-treated (DMSO) (-) or SEN177-treated (+) Burkitt’s lymphoma (Raji) cells in the presence or absence of the anti-human CD20 antibody rituximab, CD47-blocking F(ab’)2 fragment B6H12, or SIRPα blocking antibody 12C4 by human macrophages, as determined by ImageStream analysis. Symbols represent individual donors. Data represent mean ± s.d. of independent donors. ***P<0.0001; 0.0027≥**P≥0.0024 by one-way ANOVA. f, Specific lysis of control-treated (-) or SEN177-treated (+) epidermoid carcinoma (A431) cells by human neutrophils in the presence or absence of the anti-human EGFR antibody cetuximab, CD47-blocking F(ab’)2 fragment B6H12, or SIRPα blocking antibody 12C4 in a 4 hour 51Cr-release assay. Data represent mean ± s.d. of independent donors. *P=0.0207; **P=0.0055; ***P<0.0001 by one-way ANOVA. Data are representative of at least two independent experiments (a, b, e, f), evaluating effector cells from 4 donors (for B6H12(Fab’)2 conditions) or 8 donors (all other conditions) (e, f).
Fig. 4
Fig. 4. QPCTL deficiency and QPCTL inhibition enhance tumor cell control by tumor-specific antibodies.
a, Specific lysis of WT, CD47 KO and QPCTL KO Her2-expressing murine pro-B cells (Ba/F3-Her2) by human neutrophils in the presence or absence of anti-Her2 (IgA1) in a 4 hour 51Cr-release assay. Data represent n=3 biological replicates and depict mean ± s.d. of one representative donor. ***P<0.0002; **P=0.087 by one-way ANOVA. b, Specific lysis of control (DMSO)-treated (-) or SEN177-treated (+) Her2-expressing murine pro-B (Ba/F3-Her2) by human neutrophils in the presence or absence of anti-Her2 (IgA1) in a 4 hour 51Cr-release assay. Data represent n=3 biological replicates and depict mean ± s.d. of one representative donor. ***P=0.0001 by unpaired two-sided t-test. c, In vivo killing of target cells in mice injected with a 1:1 mixture of WT and QPCTL KO Her2-expressing murine pro-B cells (Ba/F3-Her2) and treated with control (PBS) or anti-Her2 (IgA1) antibody. Data represent the ratio between QPCTL KO and WT Ba/F3-Her2 cells in mice treated with PBS (dots) or anti-Her2 (IgA1) (squares). n=6 animals per group. Data represent mean ± s.d. of independent mice. ***P=0.0001 by unpaired two-sided t-test. d, Representative flow analysis plots of (c) of recovered WT and QPCTL KO tumor cells in mice treated with control (PBS) or anti-Her2 (IgA1). Data are representative of three independent experiments with similar results. e, In vivo killing of target cells in mice injected with a 1:1:1 mixture of WT, CD47 KO and QPCTL KO Ba/F3-Her2 cells and treated with control (PBS) or anti-Her2 (IgA1) antibody. Data represent the number of cells in mice treated with PBS (dots) or anti-Her2 (IgA1) (squares). n=6 control-treated animals; n=5 anti-Her2-treated animals. Data represent mean ± s.d. of independent mice. ***P<0.0001 by one-way ANOVA; n.s., not significant. f, Number of peritoneal neutrophils (Ly-6G+CD11b+) and macrophages (F4/80+CD11b+) present in recipients of a 1:1 mixture of WT and QPCTL KO Her2-expressing murine pro-B cells that were either treated with PBS (-) or with anti-Her2 (IgA1) (+) antibody, 16 hours after treatment. n=4 control-treated animals; n=6 anti-Her2-treated animals. Data represent mean ± s.d. of independent mice. ***P≤0.0003 by unpaired two-sided t-test. g, In vivo killing of target cells in mice injected with a 1:1 mixture of WT and QPCTL KO Ba/F3-Her2 cells and treated with control (PBS), anti-Her2 (IgA1) antibody or anti-Her2 (IgA1) antibody plus neutrophil-depleting antibody anti-Ly6G. Data represent the ratio between QPCTL KO and WT Ba/F3-Her2 cells in mice treated with PBS (dots), anti-Her2 (IgA1) (squares) or anti-Her2 (IgA1) plus anti-Ly6G (pyramids). n=6 control-treated animals; n=6 anti-Her2-treated animals, n=5 anti-Her2- plus anti-Ly6G-treated animals. Data represent mean ± s.d. of independent mice. ***P<0.0001 by one-way ANOVA; n.s., not significant.

References

    1. Zou W, Wolchok JD, Chen L. PD-L1 (B7-H1) and PD-1 pathway blockade for cancer therapy: Mechanisms, response biomarkers, and combinations. Science Translational Medicine. 2016;8:328rv4–328rv4. - PMC - PubMed
    1. Jaiswal S, et al. CD47 is upregulated on circulating hematopoietic stem cells and leukemia cells to avoid phagocytosis. Cell. 2009;138:271–285. - PMC - PubMed
    1. Majeti R, et al. CD47 is an adverse prognostic factor and therapeutic antibody target on human acute myeloid leukemia stem cells. Cell. 2009;138:286–299. - PMC - PubMed
    1. Weiskopf K. Cancer immunotherapy targeting the CD47/SIRPα axis. Eur J Cancer. 2017;76:100–109. - PubMed
    1. Willingham SB, et al. The CD47-signal regulatory protein alpha (SIRPa) interaction is a therapeutic target for human solid tumors. Proc Natl Acad Sci USA. 2012;109:6662–6667. - PMC - PubMed

Publication types