

Increasing impacts of land use on biodiversity and carbon sequestration driven by population and economic growth
- PMID: 30833755
- PMCID: PMC6443044
- DOI: 10.1038/s41559-019-0824-3
Increasing impacts of land use on biodiversity and carbon sequestration driven by population and economic growth
Abstract
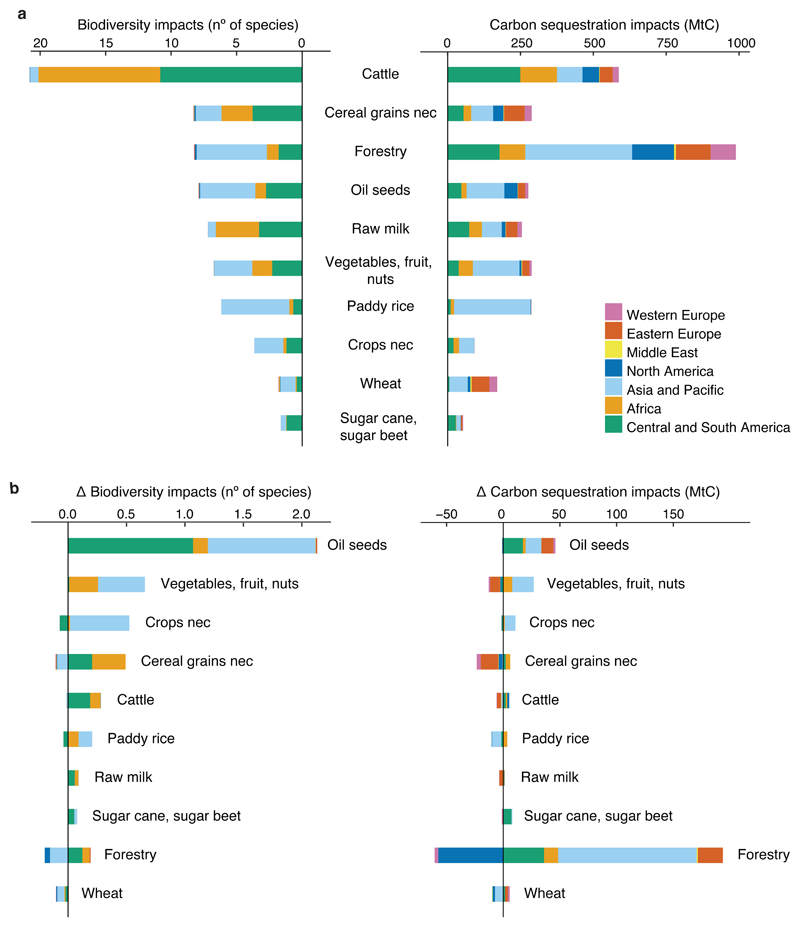
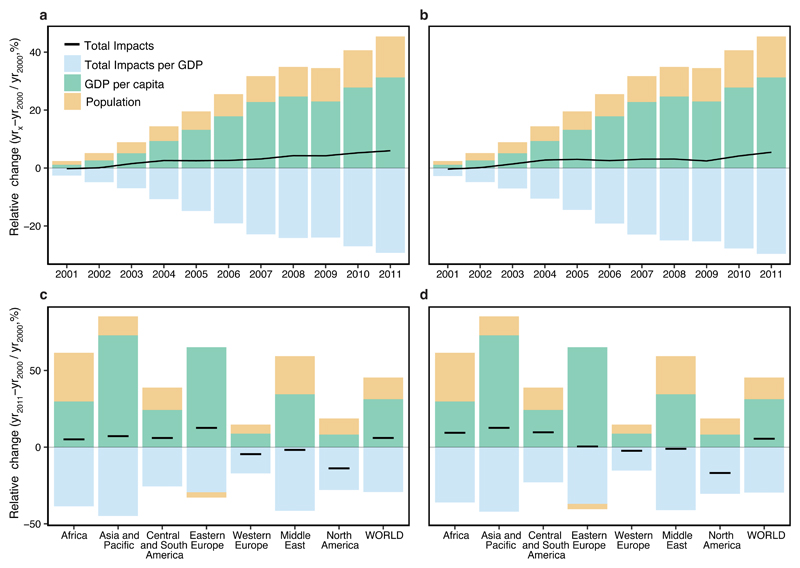
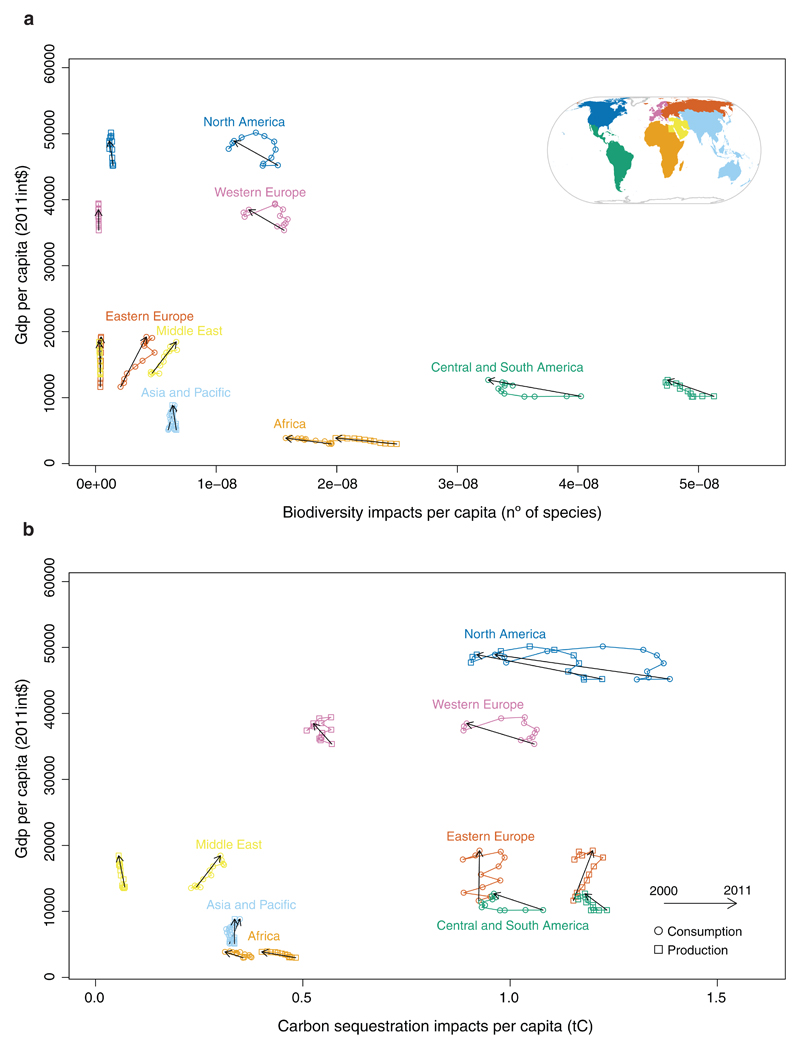
Biodiversity and ecosystem service losses driven by land-use change are expected to intensify as a growing and more affluent global population requires more agricultural and forestry products, and teleconnections in the global economy lead to increasing remote environmental responsibility. By combining global biophysical and economic models, we show that, between the years 2000 and 2011, overall population and economic growth resulted in increasing total impacts on bird diversity and carbon sequestration globally, despite a reduction of land-use impacts per unit of gross domestic product (GDP). The exceptions were North America and Western Europe, where there was a reduction of forestry and agriculture impacts on nature accentuated by the 2007-2008 financial crisis. Biodiversity losses occurred predominantly in Central and Southern America, Africa and Asia with international trade an important and growing driver. In 2011, 33% of Central and Southern America and 26% of Africa's biodiversity impacts were driven by consumption in other world regions. Overall, cattle farming is the major driver of biodiversity loss, but oil seed production showed the largest increases in biodiversity impacts. Forestry activities exerted the highest impact on carbon sequestration, and also showed the largest increase in the 2000-2011 period. Our results suggest that to address the biodiversity crisis, governments should take an equitable approach recognizing remote responsibility, and promote a shift of economic development towards activities with low biodiversity impacts.
Conflict of interest statement
The authors declare no competing interests.
Figures

Comment in
-
The trouble with trade.Nat Ecol Evol. 2019 Apr;3(4):522-523. doi: 10.1038/s41559-019-0816-3. Nat Ecol Evol. 2019. PMID: 30833754 No abstract available.
-
Soils need to be considered when assessing the impacts of land-use change on carbon sequestration.Nat Ecol Evol. 2019 Dec;3(12):1642. doi: 10.1038/s41559-019-1026-8. Epub 2019 Nov 4. Nat Ecol Evol. 2019. PMID: 31686018 No abstract available.
-
Reply to: Soils need to be considered when assessing the impacts of land-use change on carbon sequestration.Nat Ecol Evol. 2019 Dec;3(12):1643-1644. doi: 10.1038/s41559-019-1029-5. Epub 2019 Nov 4. Nat Ecol Evol. 2019. PMID: 31686019 No abstract available.
References
-
- Newbold T, et al. Global effects of land use on local terrestrial biodiversity. Nature. 2015;520:45–50. - PubMed
-
- MA. Millenium Ecosystem Assesment - Ecosystems and human well-being. Island Press; 2005.
-
- West PC, et al. Leverage points for improving global food security and the environment. Science. 2014;345:325–328. - PubMed
-
- Cardinale BJ, et al. Biodiversity loss and its impact on humanity. Nature. 2012;486:59–67. - PubMed
Publication types
MeSH terms
Grants and funding
LinkOut - more resources
Full Text Sources
