. 2019 Mar;26(3):237-247.
doi: 10.1038/s41594-019-0197-y. Epub 2019 Mar 4.

RNA exploits an exposed regulatory site to inhibit the enzymatic activity of PRC2

Affiliations

RNA exploits an exposed regulatory site to inhibit the enzymatic activity of PRC2

Qi Zhang et al. Nat Struct Mol Biol. 2019 Mar.

Abstract

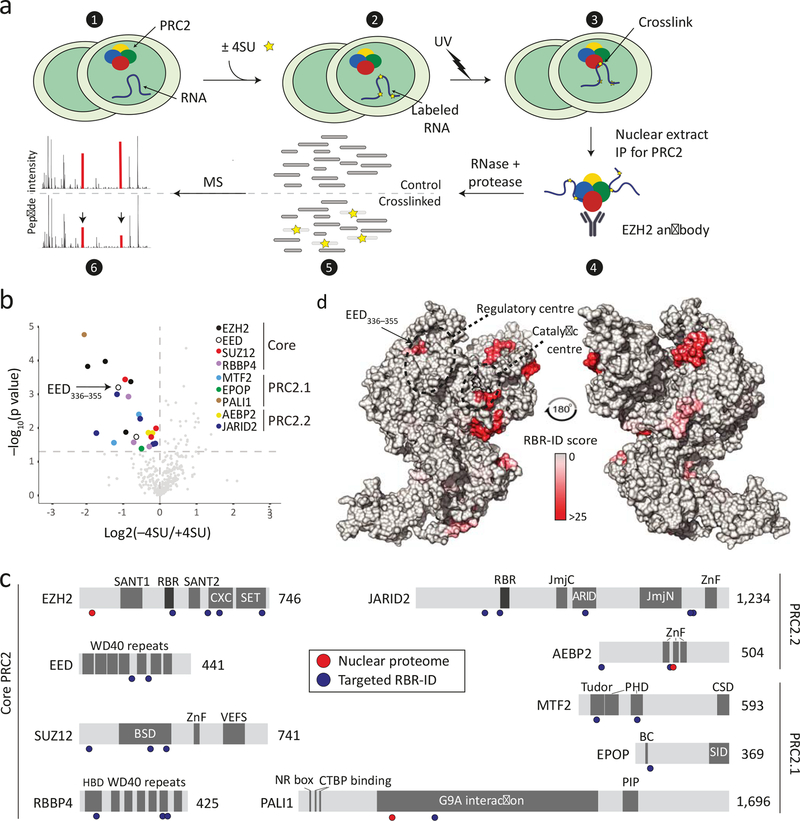
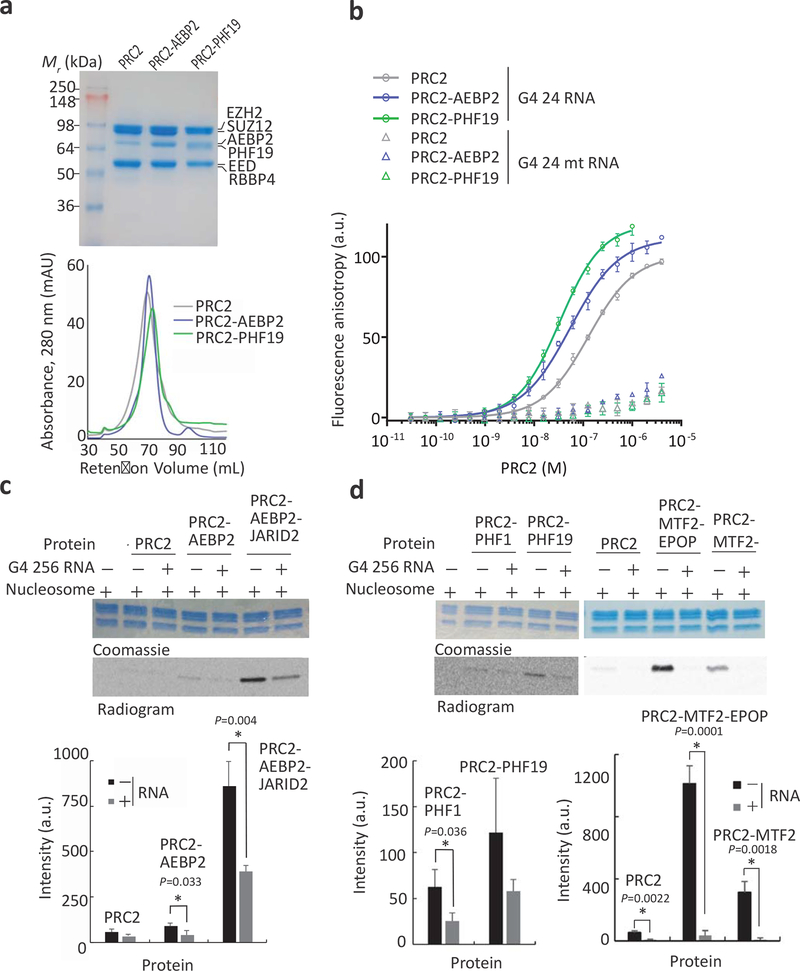
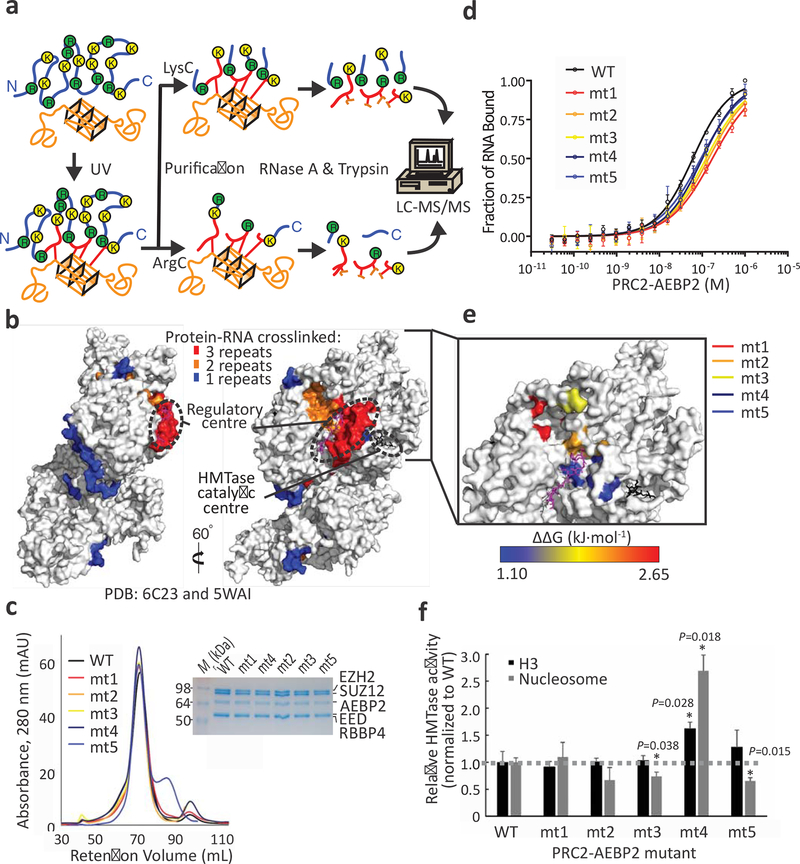
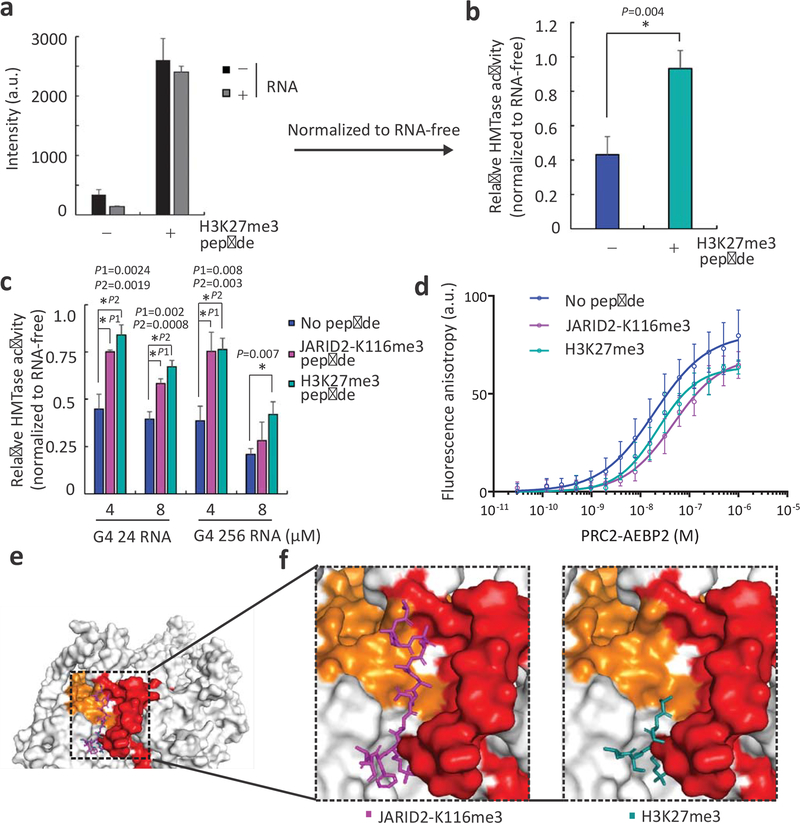
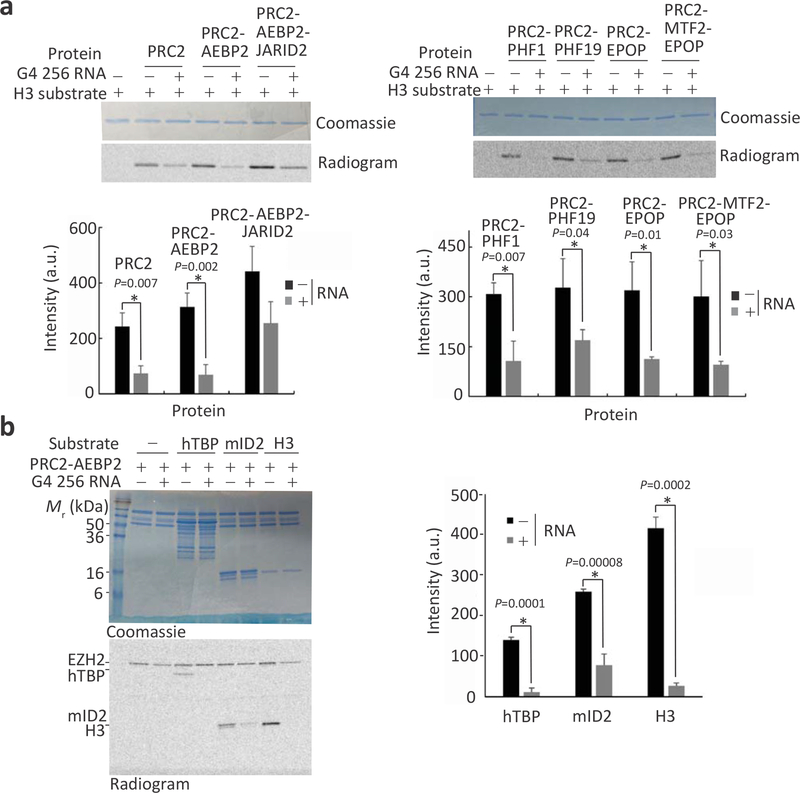
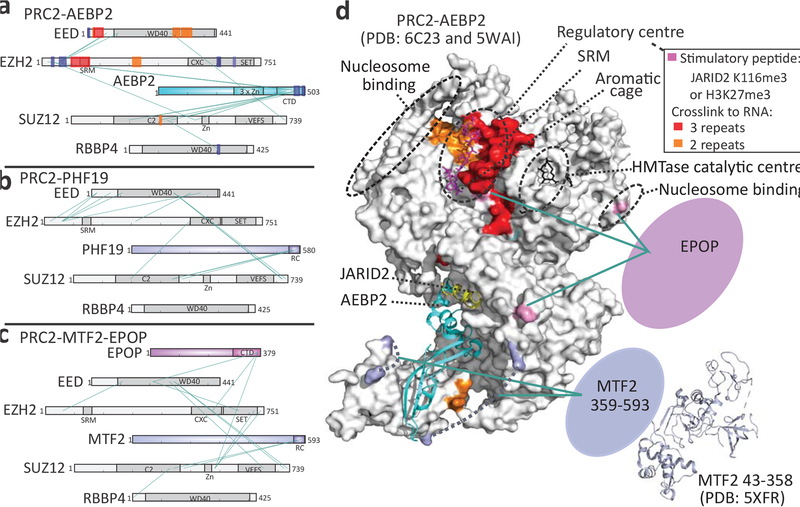
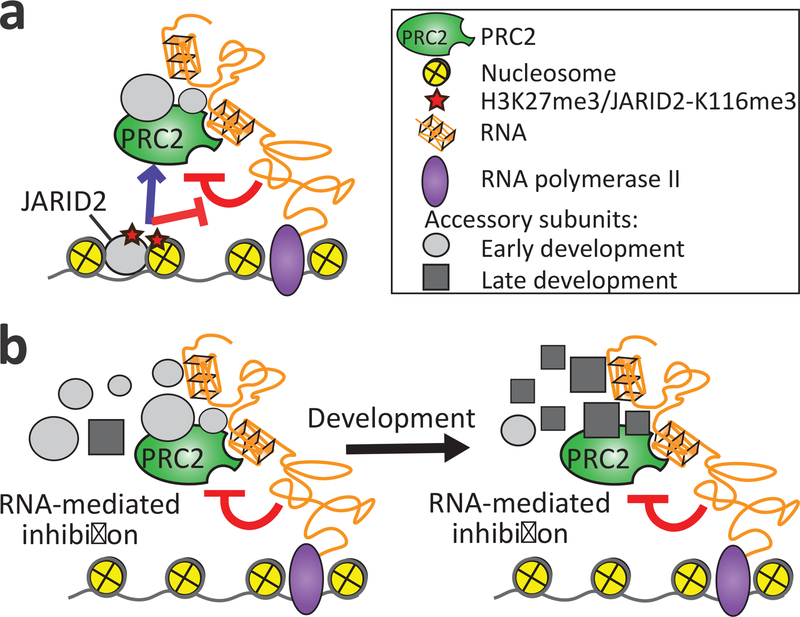
Polycomb repressive complex 2 (PRC2) is a histone methyltransferase that maintains cell identity during development in multicellular organisms by marking repressed genes and chromatin domains. In addition to four core subunits, PRC2 comprises multiple accessory subunits that vary in their composition during cellular differentiation and define two major holo-PRC2 complexes: PRC2.1 and PRC2.2. PRC2 binds to RNA, which inhibits its enzymatic activity, but the mechanism of RNA-mediated inhibition of holo-PRC2 is poorly understood. Here we present in vivo and in vitro protein-RNA interaction maps and identify an RNA-binding patch within the allosteric regulatory site of human and mouse PRC2, adjacent to the methyltransferase center. RNA-mediated inhibition of holo-PRC2 is relieved by allosteric activation of PRC2 by H3K27me3 and JARID2-K116me3 peptides. Both holo-PRC2.1 and holo-PRC2.2 bind RNA, providing a unified model to explain how RNA and allosteric stimuli antagonistically regulate the enzymatic activity of PRC2.


Conflict of interest statement

Competing interests

The authors declare no competing interests.

Figures

Fig. 1:
Fig. 1:. Targeted RBR-ID of PRC2.
a, Targeted RBR-ID experimental design. Mouse ESCs treated with or without 4SU (1 and 2) were crosslinked with UV to generate RNA–protein crosslinks (3). After preparing nuclear extracts, we ‘targeted’ the RBR-ID technique by performing immunoprecipitations for endogenous PRC2 using an EZH2 antibody (4). Following IP, we treated eluted proteins with RNase and protease to remove crosslinked RNA and generate peptides (5), which were analysed via high resolution LC-MS/MS to identify decreases in apparent peptide abundance caused by the crosslink with RNA (6). b, Volcano plot of peptide intensities comparing material from 4SU-pulsed and control (−4SU) cells. Dashed horizontal line indicates P value of 0.05. Peptides on core and accessory PRC2 subunits are highlighted. P values were calculated using paired two-sided Student’s t-tests from three independent experiments and 10 total replicates. c, Mapping to PRC2 subunits of RNA-interacting peptides detected by targeted RBR-ID (blue circles, this study) or proteome-wide RBR-ID (red circles). Known protein domains, including previously identified RNA-binding regions (RBRs) on EZH2 and JARID2 are shown. d, RBR-ID structural mapping. Residue-level RBR-ID scores were calculated according to the level of 4SU-depletion and statistical significance and the resulting heatmap was used to colour the surface of a composite PRC2 model using two published PRC2 structures (PDB: 5WAI and 6C23, see Methods section). The substrate peptide in the catalytic centre is shown in black.
Fig. 2:
Fig. 2:. RNA binds to and inhibits both PRC2.1 and PRC2.2.
a, Coomassie blue-stained SDS-PAGE (top) and gel filtration chromatography (bottom, HiPrep 16/600 Sephacryl S-400 HR) of the PRC2 complexes that were used for binding assays. b Fluorescence anisotropy used to quantify the affinity of PRC2 complexes to G4 24 and G4 24 mutant (mt) RNAs. Data represent the mean of three independent experiments that were carried out on different days, error bars represent standard deviation. See Table 1 for dissociation constants (Kd) and Hill coefficients. c,d, HMTase assays of PRC2.2 (c) and PRC2.1 (d) complexes toward nucleosome substrates were carried out in the presence or absence of 8 μM G4 256 RNA. Histone proteins were visualised using Coomassie (upper gel) and methylation levels of H3 were determined byC-autoradiography (bottom). Bar plots represent the mean of quantification using densitometry and error bars represent standard deviation based on three independent experiments. P values were determined using unpaired two-tailed Student’s t-test; *, P < 0.05. See Supplementary Fig. 2 for complete gel scans, SDS-PAGE and gel filtration chromatography of holo-PRC2 complexes and evidence for nucleosome reconstitution. Source data are available in Supplementary Data Set 5.
Fig. 3:
Fig. 3:. Mapping of protein–RNA interactions within PRC2-AEBP2 in vitro.
a, Schematic representation of the in vitro RBDmap workflow (see Methods section): in vitro reconstituted protein–RNA complexes are crosslinked, followed by tandem proteolytic digestion and LC-MS/MS to reveal peptides adjacent (blue) to the protein–RNA crosslink (red). RNA is shown in orange. b, RBDmap results: amino acids within the PRC2-AEBP2 structure were coloured in blue, orange or red if they resided within peptides that were crosslinked to RNA in 1, 2 or 3 independent RBDmap experiments, respectively. A methylated peptide in the regulatory centre is coloured magenta and the substrate peptide in the catalytic centre is coloured black (PDB accession: 6C23 and 5WAI). c-d, Validation using point mutations. The purity and integrity of the mutant complexes were assessed using SDS-PAGE and gel filtration chromatography (HiPrep 16/600 Sephacryl S-400 HR) (c). Fluorescence anisotropy was used to quantify the affinity of the mutants to G4 24 RNA (d). The resulting dissociation constant (Kd), Hill coefficients and the derived ΔΔG are indicated together with details of the mutated amino acids in EZH2 and EED in Table 2. Error bars in (d) represent standard deviation based on three independent experiments that were done on different days. e, The impaired capacity of the mutants to bind RNA is represented in a ΔΔG heat map using the PRC2-AEBP2 structure. Mutated amino acids are mapped to the structure and ΔΔG colour code is indicated (bottom). f, Mean HMTase activity of indicated PRC2 mutants toward H3 histones (black bars), or nucleosomes (grey bars) normalised to the activity of wild-type PRC2-AEBP2 (dashed line). Error bars represent standard deviation based on three independent experiments. P values were determined using paired two-tailed Student’s t-test; *, P < 0.05. See Supplementary Fig. 3 for HMTase radiograms and gel scans, SDS-PAGE analyses and mass spectrometry intensities resulting from the RBDmap process and additional mutants that were assayed. Source data are available in Supplementary Data Set 6.
Fig. 4:
Fig. 4:. Stimulatory peptides relieve the RNA-mediated inhibition of PRC2.
a, HMTase assays of PRC2 in the presence (+) or absence (−) of 80 μM H3K27me3 peptide and in the presence (+) or absence (−) of 4.0 μM G4 256 RNA. b, HMTase activities of PRC2 in its basal and stimulated states, relative to the HMTase activity of an RNA-free PRC2 within the same state: bar plot based on the same data as in panel a, after normalising each RNA-containing sample (grey bars in panel a) to the corresponding RNA-free sample (black bars in panel a) to yield the relative HMTase activity of PRC2 in either its stimulated (H3K27me3 peptide, in green) or basal (no peptide, in blue) state. c, HMTase activities, relative to an RNA-free sample, of PRC2-AEBP2 in its stimulated (10 μM JARID2-K116me2 peptide, in magenta, or 80 μM H3K27me3 peptide, in green) or its basal (no peptide, in blue) state and in the presence of RNA as indicated (relative activities were calculated as in panel b). Error bars in panels a-c represent standard deviations based on 3 independent experiments. All bar plots are represented means. P values were determined using unpaired two-tailed Student’s t-test; *, P < 0.05. d, The affinity of the PRC2-AEBP2 complex to G4 24 RNA was quantified using fluorescence anisotropy in the presence or absence of 100 μM H3K27me3 or 10 μM JARID2-K116me3 peptides. The KCl concentration in the binding buffer was reduced to 100 mM (rather than 200 mM KCl that was used in Fig 2b–c) in order to mimic the conditions used in the HMTase assays presented in this figure. Error bars represent standard deviations in 11, 6 and 4 independent replicates for the binding curves plotted in blue, purple and green, respectively. Values are represented means. See Table 3 for dissociation constants and Hill coefficients. e, The stimulatory peptides’ binding sites in PRC2 (coordinates: PDB 6C23): Orange and red represent RNA-linked polypeptides (colour code as in Fig. 3b), after superimposing the JARID2-K116me3 peptide (magenta, from PDB: 6C23) and the H3K27me3 peptide (dark green, from PDB: 3IIW). f, Close-up of the two peptides’ binding sites. Source data are available in Supplementary Data Set 7.
Fig. 5:
Fig. 5:. DNA-independent RNA-mediated inhibition of PRC2.
a, HMTase assays carried out in the presence of 0.5 μM PRC2 complexes as indicated, 4 μM H3 histone substrate and in the presence or absence of 1 μM G4 256 RNA. The bar plot (bottom) represents the activity, as recorded by densitometry after SDS-PAGE (top). b, HMTase assays were carried out in the presence of 0.5 μM PRC2-AEBP2, 1 μM H3 or non-histone substrates human TBP (hTBP, 20 μM) or mouse ID2 (mID2, 15 μM), and in the presence or absence of 8 μM G4 256 RNA. The bar plot (right) represents the activity, as recorded by densitometry after SDS-PAGE (left). In all plots within the figure, bars represent means and error bars represent standard deviation based on three independent experiments and P values were determined using unpaired two-tailed Student’s t-test; *, P < 0.05. Complete gel scans are in Supplementary Fig. 5. Source data are available in Supplementary Data Set 8.
Fig. 6:
Fig. 6:. The RNA-binding site in the regulatory centre of PRC2 is exposed within both PRC2.1 and PRC2.2.
a-c BS3 crosslinking with mass spectrometry (BS3 XL-MS) results for PRC2-AEBP2 (a), PRC2-PHF19 (b) and PRC2-MTF2-EPOP (c). Core subunits are coloured grey, accessory subunits are indicated in assorted colours and selected domains are shown in dark colours (see Supplementary Fig. 6d, middle structure, for the same view with the core subunits in assorted colours). Green lines represent inter-molecular protein-protein BS3 crosslinks. Blue, orange and red boxes on the protein representation in panel a represent RNA–protein crosslinks that were identified in 1, 2, or 3 independent RBDmap experiments, respectively (same data as in the 3D representation in Fig. 3b). d, Accessory proteins and RNA-binding sites within the holo-PRC2 complex: surface view of PRC2 was generated as in Fig. 3b. AEBP2 (cyan) and JARID2 (yellow) fragments are shown as a ribbon representation and the N-terminus of MTF2 that was determined crystallographically (PDB: 5XFR) is in light blue, to approximate scale. EPOP (pink) and the C-terminal region of MTF2 (light blue) are indicated as blobs, to approximate scale. Green lines indicate crosslinks between PRC2 core subunits to PCL proteins and EPOP. Residues within core PRC2 subunits that were crosslinked to EPOP are indicated in pink. Residues within core PRC2 subunits that reside at the termini of unstructured loops that were crosslinked to PCL proteins are indicated in light blue and linked with dashed arcs. Protein–RNA contacts that were determined in 2 or 3 independent RBDmap replicates (see Fig. 3 for complete data) are indicated in orange and red, respectively. Other key functional centres or structural features are highlighted using dashed black circles. See Supplementary Fig. 6 for distances histograms of BS3 XL-MS and different views of the structure presented in (d).
Fig. 7:
Fig. 7:. A model for RNA-mediated inhibition of PRC2.
a, Stimulatory effectors of PRC2 — JARID2-K116me3 and H3K27me3 — relieve the inhibitory activity of RNA simultaneously with HMTase stimulation. This process provides a molecular mechanism to overcome RNA-mediated inhibition during the nucleation, spreading and propagation of the H3K27me3 mark at polycomb-target genes,,. b, A model for RNA-mediated inhibition of PRC2 during development: RNA binds to the allosteric regulatory centre of PRC2 and inhibits methyltransferase activity towards histone and non-histone substrates, either when PRC2 is in complex with AEBP2 and JARID2 (PRC2.2) or PHF1, PHF19, MTF2, PALI and EPOP (PRC2.1). RNA-mediated inhibition of PRC2 provides a fail-safe mechanism to prevent substrate methylation by RNA-bound PRC2 at non-target genes, even if the stoichiometry of its common accessory subunits changes during development.

References

    1. Schuettengruber B, Bourbon HM, Di Croce L & Cavalli G Genome Regulation by Polycomb and Trithorax: 70 Years and Counting. Cell 171, 34–57 (2017). - PubMed
    1. Margueron R & Reinberg D The Polycomb complex PRC2 and its mark in life. Nature 469, 343–9 (2011). - PMC - PubMed
    1. Simon JA & Kingston RE Occupying chromatin: Polycomb mechanisms for getting to genomic targets, stopping transcriptional traffic, and staying put. Mol Cell 49, 808–24 (2013). - PMC - PubMed
    1. Comet I, Riising EM, Leblanc B & Helin K Maintaining cell identity: PRC2-mediated regulation of transcription and cancer. Nat Rev Cancer 16, 803–810 (2016). - PubMed
    1. Kasinath V et al. Structures of human PRC2 with its cofactors AEBP2 and JARID2. Science 359, 940–944 (2018). - PMC - PubMed

Publication types