. 2019 Apr;51(4):705-715.
doi: 10.1038/s41588-019-0360-8. Epub 2019 Mar 4.

Chromosome segregation errors generate a diverse spectrum of simple and complex genomic rearrangements

Affiliations

Chromosome segregation errors generate a diverse spectrum of simple and complex genomic rearrangements

Peter Ly et al. Nat Genet. 2019 Apr.

Abstract

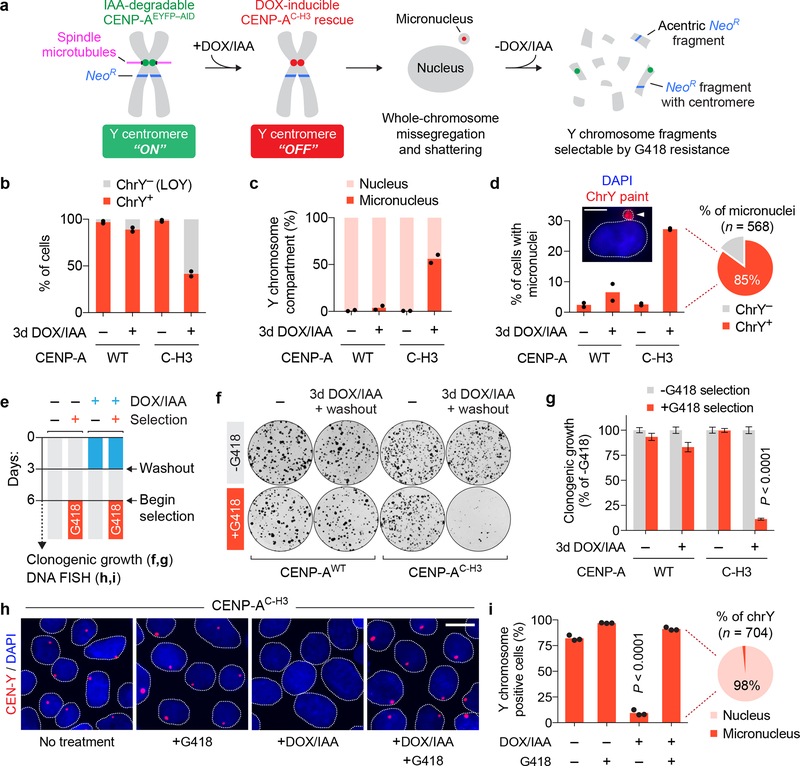
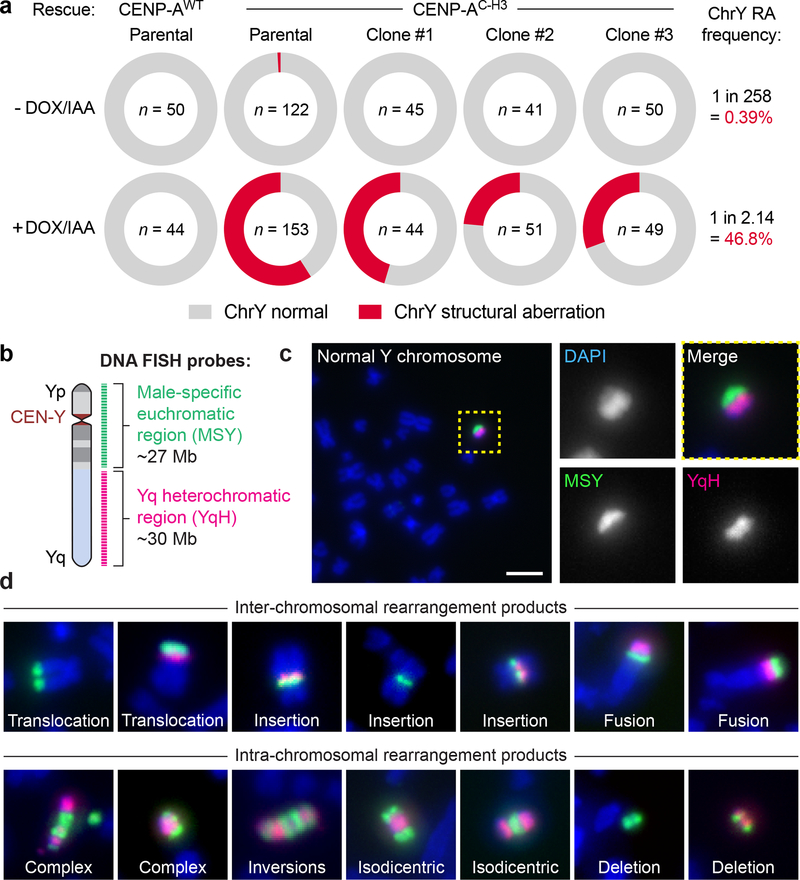
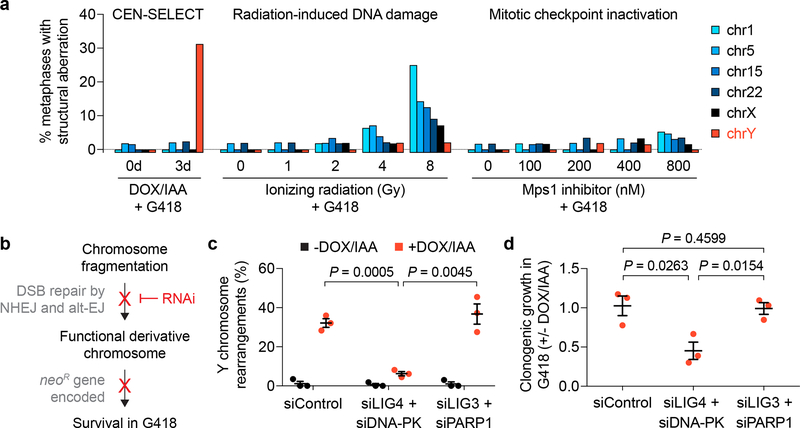
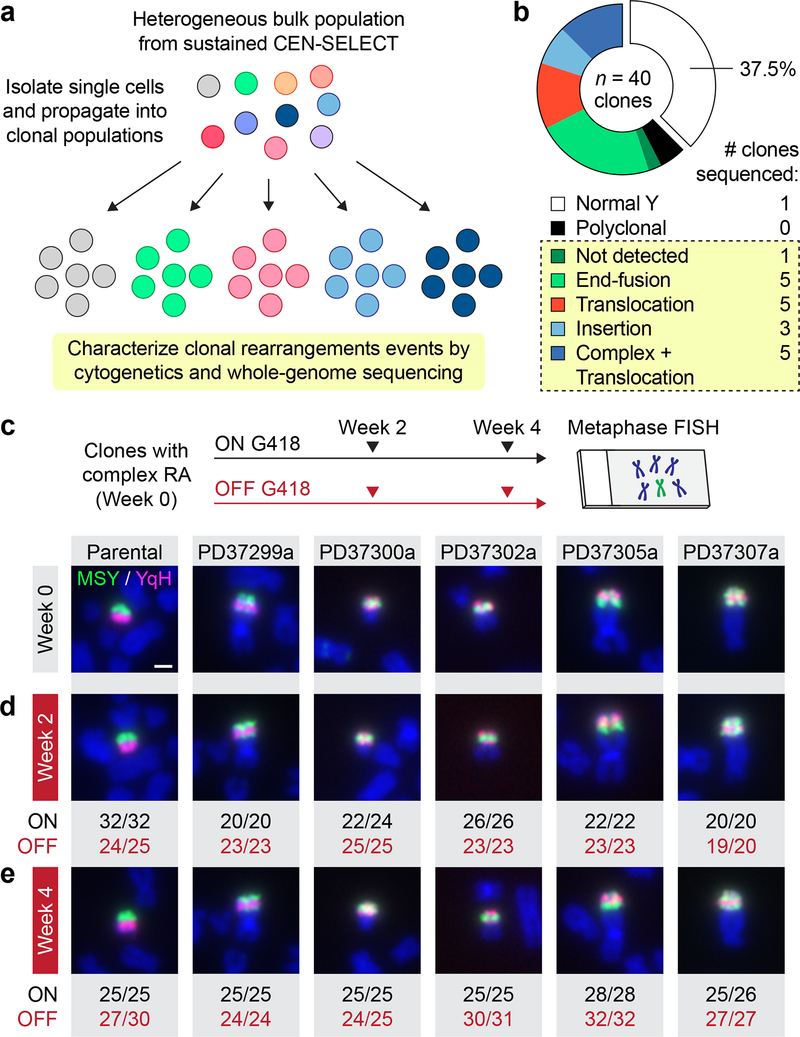
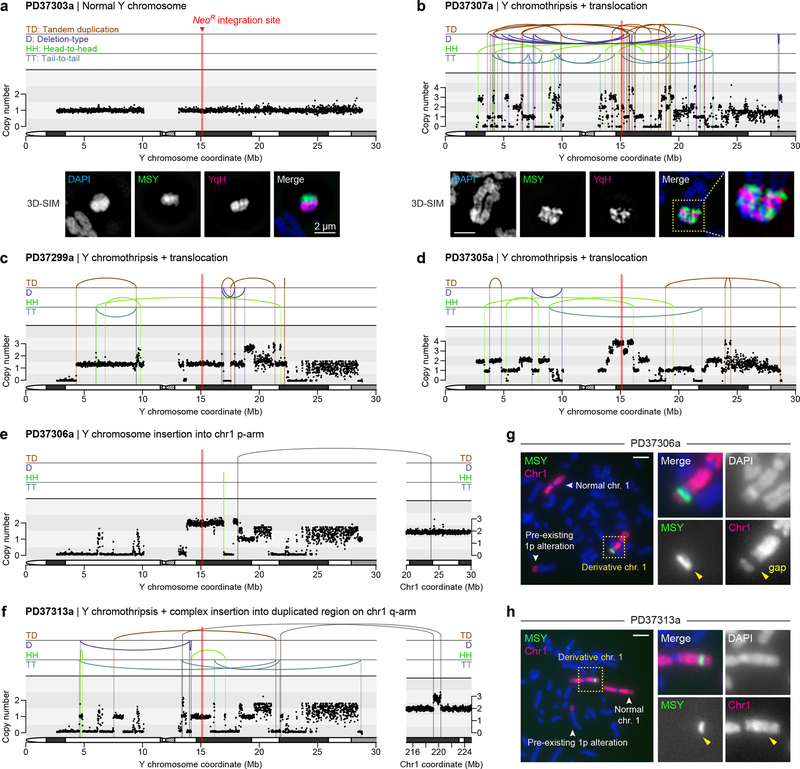
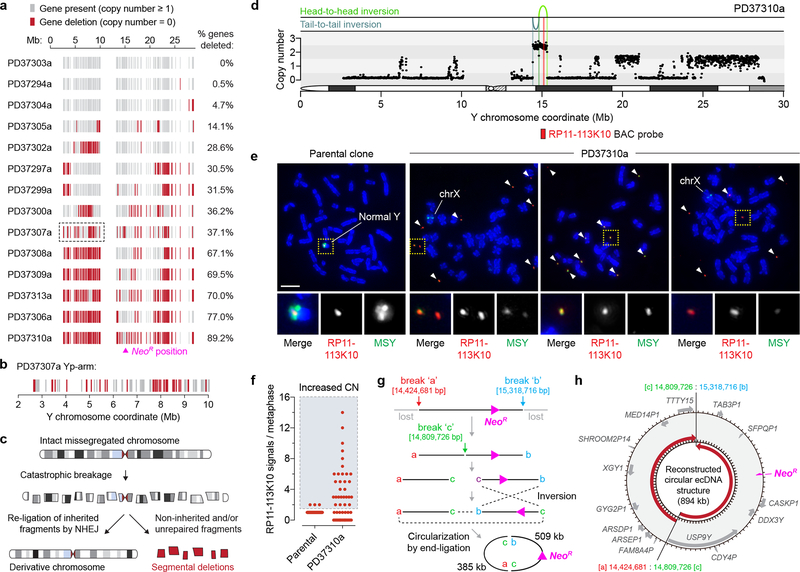
Cancer genomes are frequently characterized by numerical and structural chromosomal abnormalities. Here we integrated a centromere-specific inactivation approach with selection for a conditionally essential gene, a strategy termed CEN-SELECT, to systematically interrogate the structural landscape of mis-segregated chromosomes. We show that single-chromosome mis-segregation into a micronucleus can directly trigger a broad spectrum of genomic rearrangement types. Cytogenetic profiling revealed that mis-segregated chromosomes exhibit 120-fold-higher susceptibility to developing seven major categories of structural aberrations, including translocations, insertions, deletions, and complex reassembly through chromothripsis coupled to classical non-homologous end joining. Whole-genome sequencing of clonally propagated rearrangements identified random patterns of clustered breakpoints with copy-number alterations resulting in interspersed gene deletions and extrachromosomal DNA amplification events. We conclude that individual chromosome segregation errors during mitotic cell division are sufficient to drive extensive structural variations that recapitulate genomic features commonly associated with human disease.


Conflict of interest statement

COMPETING INTERESTS STATEMENT

The authors declare no competing financial interests.

Figures

Figure 1 |
Figure 1 |. A centromere inactivation and chromosome selection system (CEN-SELECT) identifies cells harboring previously missegregated chromosomes.
a) Overview of the CEN-SELECT approach, which combines a CENP-A replacement strategy to induce Y chromosome missegregation and micronucleus-mediated shattering with a CRISPR/Cas9-integrated neomycin-resistance gene (NeoR). b-d) Engineered DLD-1 cells carrying a CENP-AWT or CENP-AC–H3 rescue gene were treated with DOX/IAA and quantified by interphase FISH for b) Y chromosome loss (LOY), c) the compartment of the Y chromosome in chrY-positive cells, and d) the proportion of cells with micronuclei. Pie chart shows the fraction of micronuclei carrying a chrY-positive or chrY-negative micronucleus from CENP-AC–H3 rescued cells treated with DOX/IAA. Data represent the mean of n = 2 independent experiments from b,d) 1,081–2,085 cells or c) 861–1,242 Y chromosomes. Scale bar, 5 μm. e) Experimental schematic for panels f-i. f) Representative colony formation plate scans and g) quantification. Bar graph represents the mean ± SEM of n = 9 biological replicates pooled from 3 independent experiments; P-value derived from two-tailed Student’s t-test compared to untreated cells. h) Representative interphase FISH images of CENP-AC–H3 rescue cells and i) quantification. Scale bar, 10 μm. Bar graph represents the mean ± SEM of n = 3 independent experiments from 833–918 cells; P-value derived from two-tailed Student’s t-test compared to untreated cells. Pie chart represents the fraction of Y chromosomes compartmentalized within the nucleus or micronucleus following DOX/IAA treatment and G418 selection.
Figure 2 |
Figure 2 |. Missegregated chromosomes acquire a broad spectrum of structural genomic rearrangement types.
a) Measurements of Y chromosome rearrangement frequencies in parental cells and 3 independent clonal lines following 0d or 3d DOX/IAA treatment and G418 selection. Metaphase spreads were subjected to DNA fluorescence in situ hybridization (FISH) using Y chromosome-specific paint probes. n = number of metaphase spreads examined. Parental CENP-AC–H3 frequencies were pooled from 3 independent experiments. RA, rearrangement. b) Schematic of multi-colored DNA FISH probes used to characterize structural anomolies of the Y chromosome. c-d) Representative FISH images of c) a normal Y chromosome without visible defects from control metaphases (scale bar, 5 μm) and d) examples of derivative Y chromosomes from 3d DOX/IAA-treated, G418-resistant metaphases. See Supplementary Note for a description of each rearrangement type.
Figure 3 |
Figure 3 |. Systematic classification of the structural rearrangement landscape.
a-b) The distribution of structural rearrangement types quantified from metaphase spreads using MSY/YqH FISH probes following a) transient centromere inactivation induced by 3d DOX/IAA treatment, washout, and G418 selection, or b) prolonged centromere inactivation induced by continuous passage in DOX/IAA and G418 (detailed in Supplementary Fig. 6). The number of each case detected is depicted on the right of each graph.
Figure 4 |
Figure 4 |. Chromosome rearrangements develop with high frequency and specificity through classical non-homologous end joining repair.
a) DLD-1 cells carrying a CENP-AC–H3 rescue gene were treated as indicated in Supplementary Fig. 7e, followed by metaphase spread preparation and hybridization to the indicated chromosome paint probes. Metaphases were examined for structural rearrangements affecting each chromosome. Bar graph represents n = 42–65 metaphases scored per chromosome per condition, analysing a total of 1,968 metaphase spreads (exact sample sizes provided in Supplementary Fig. 7g). b) Schematic of experimental hypothesis tested in panels c and d. NHEJ, non-homologous end joining; alt-EJ, alternative end joining. c-d) DLD-1 CENP-AC–H3 rescue cells were treated with or without 3d DOX/IAA and transfected with the indicated siRNAs simultaneous with DOX/IAA washout for an additional 3d. Cells were then re-plated into G418 medium for c) 10d selection followed by metaphase FISH using MSY/YqH probes (102–159 metaphase spreads per condition) or d) 14d at single-cell density for colony formation assays. Data in c and d represent the mean ± SEM of n = 3 independent experiments; P-values were derived from two-tailed Student’s t-test comparing groups as indicated.
Figure 5 |
Figure 5 |. Isolation and propagation of single cell-derived clones with genetically stable derivative chromosomes.
a) Schematic of approach used to generate clonally propagated Y chromosome rearrangements from a bulk cell population. b) Frequency of Y chromosome rearrangement types obtained from single cell-derived clones. The boxed section indicates clonal rearrangements, and the number of clones subjected to whole-genome sequencing is shown on the right. c-d) Experimental schematic and representative metaphase FISH images from the indicated clones, which were passaged in parallel cultures with (ON) or without (OFF) G418 selection for c) 0 weeks, d) 2 weeks, and e) 4 weeks. Scale bar, 2 μm. Values below the image represent the number of metaphases positive for the depicted derivative chromosome over the total number of metaphases examined. RA, rearrangements.
Figure 6 |
Figure 6 |. Whole-genome sequencing reveals complex rearrangements that include the hallmark signatures of chromothripsis.
a-b) DNA copy-number profiles from WGS (top) and representative metaphase FISH images hybridized to the indicated probes captured by super-resolution microscopy (bottom) from a) clone PD37303a with a normal Y chromosome and b) clone PD37307a with 83 breakpoints detected across the mappable Y chromosome region. 3D-SIM, 3D structured illumination microscopy. c-f) DNA copy-number profiles of additional clones carrying a chromothriptic Y chromosome coupled to c,d) translocations, e) a simple insertion into chromosome 1p, or f) a complex insertion at a duplicated region on chromosome 1q. X-axes of Y chromosome plots are clipped at 30 Mb to exclude the Yq heterochromatic region. g-h) Metaphase FISH images using MSY and chromosome 1 painting probes on clones g) PD37306a and h) PD37313a. Scale bar, 5 μm.
Figure 7 |
Figure 7 |. Gene disruption and extrachromosomal DNA amplification from chromosome missegregation-induced rearrangements.
a) Each grey vertical line represents an individual gene or pseudogene depicted at its chromosomal start position, and red lines represent a copy-number of zero. Clones are ranked from fewest to most gene deletions. b) Magnification of clone PD37307a (boxed region in a) exhibiting oscillating patterns of gene retention and deletion within an 8 Mb segment. c) Schematic of chromosome shattering and reassembly events resulting in a derivative chromosome harboring rearrangements with interspersed deletions. d) DNA copy-number profile of clone PD37310a showing extensive Y chromosome loss except for the region harboring the selection marker accompanied by two inversions. e) Images of metaphase spreads prepared from the parental or PD37310a clone and hybridized to MSY (green) and RP11–113K10 BAC (red) probes recognizing the region shown in d. Arrows denote extrachromosomal DNA fragments hybridizing to the RP11–113K10 probe, and regions of the X chromosome partially hybridize to MSY probes due to X-Y sequence homology. Scale bar, 5 μm. f) Quantification of e. Each data point represents an individual metaphase spread derived from the parental clone (n = 48) or PD37310a clone (n = 56). CN, copy-number. g) Schematic depicting the predicted steps leading to the generation of the extrachromosomal DNA (ecDNA) element through the circular reassembly of two broken DNA fragments. h) Reconstructed ecDNA sequence from WGS. Genes and pseudogenes in the corresponding region are shown, and red arrows depict 5’ to 3’ orientation.

References

    1. Campbell PJ et al. Identification of somatically acquired rearrangements in cancer using genome-wide massively parallel paired-end sequencing. Nat Genet 40, 722–9 (2008). - PMC - PubMed
    1. Stephens PJ et al. Complex landscapes of somatic rearrangement in human breast cancer genomes. Nature 462, 1005–10 (2009). - PMC - PubMed
    1. Carvalho CM & Lupski JR Mechanisms underlying structural variant formation in genomic disorders. Nat Rev Genet 17, 224–38 (2016). - PMC - PubMed
    1. Liu P et al. An Organismal CNV Mutator Phenotype Restricted to Early Human Development. Cell 168, 830–842 e7 (2017). - PMC - PubMed
    1. Redin C et al. The genomic landscape of balanced cytogenetic abnormalities associated with human congenital anomalies. Nat Genet 49, 36–45 (2017). - PMC - PubMed

METHODS-ONLY REFERENCES

    1. Murray AW Cell cycle extracts. Methods Cell Biol 36, 581–605 (1991). - PubMed
    1. Shankaran SS, Mackay DR & Ullman KS A time-lapse imaging assay to study nuclear envelope breakdown. Methods Mol Biol 931, 111–22 (2013). - PMC - PubMed
    1. Li H & Durbin R Fast and accurate long-read alignment with Burrows-Wheeler transform. Bioinformatics 26, 589–95 (2010). - PMC - PubMed
    1. Raine KM et al. ascatNgs: Identifying Somatically Acquired Copy-Number Alterations from Whole-Genome Sequencing Data. Curr Protoc Bioinformatics 56, 15 9 1–15 9 17 (2016). - PMC - PubMed
    1. Nik-Zainal S et al. Landscape of somatic mutations in 560 breast cancer whole-genome sequences. Nature 534, 47–54 (2016). - PMC - PubMed

Publication types