. 2019 Feb 28;25(8):941-954.
doi: 10.3748/wjg.v25.i8.941.

Dynamic changes of key metabolites during liver fibrosis in rats

Affiliations

Dynamic changes of key metabolites during liver fibrosis in rats

Jiong Yu et al. World J Gastroenterol. .

Abstract

Background: Fibrosis is the single most important predictor of significant morbidity and mortality in patients with chronic liver disease. Established non-invasive tests for monitoring fibrosis are lacking, and new biomarkers of liver fibrosis and function are needed.

Aim: To depict the process of liver fibrosis and look for novel biomarkers for diagnosis and monitoring fibrosis progression.

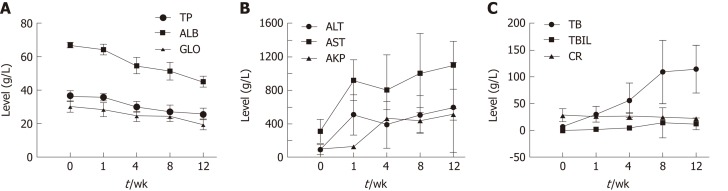
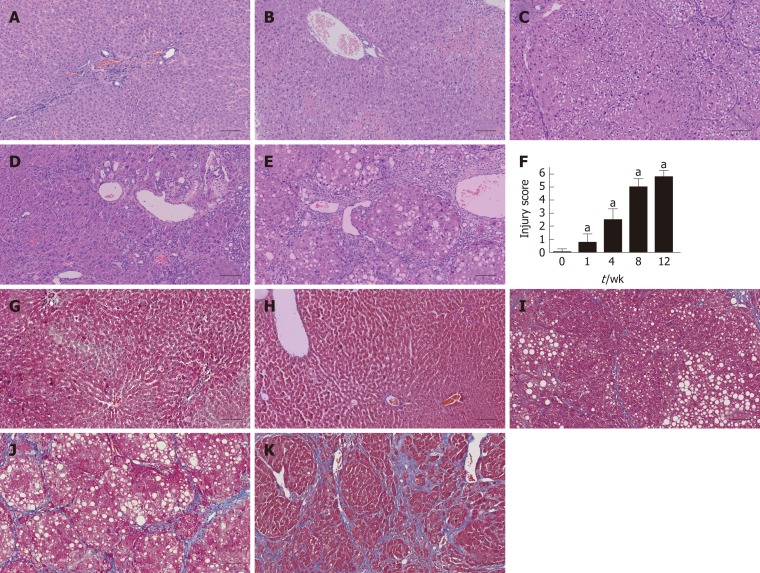
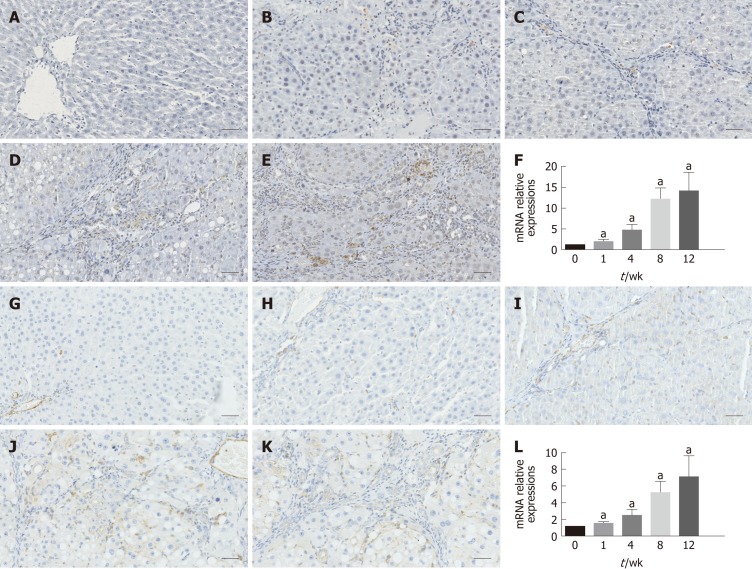
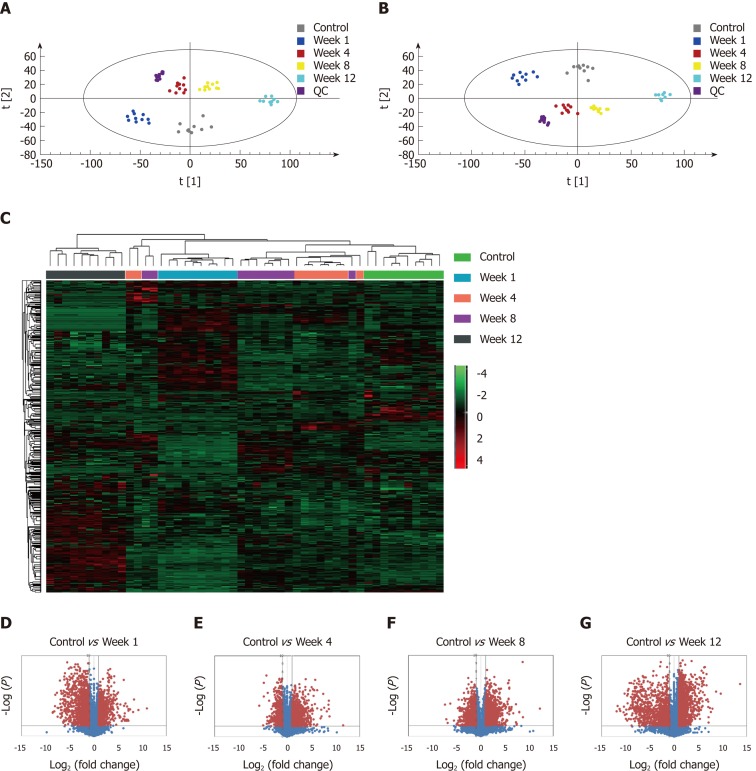
Methods: CCl4 was used to establish the rat liver fibrosis model. Liver fibrosis process was measured by liver chemical tests, liver histopathology, and Masson's trichrome staining. The expression levels of two fibrotic markers including α-smooth muscle actin and transforming growth factor β1 were assessed using immunohistochemistry and real-time polymerase chain reaction. Dynamic changes in metabolic profiles and biomarker concentrations in rat serum during liver fibrosis progression were investigated using ultra-performance liquid chromatography coupled to quadrupole time-of-flight mass spectrometry. The discriminatory capability of potential biomarkers was evaluated by receiver operating characteristic (ROC) curve analysis.

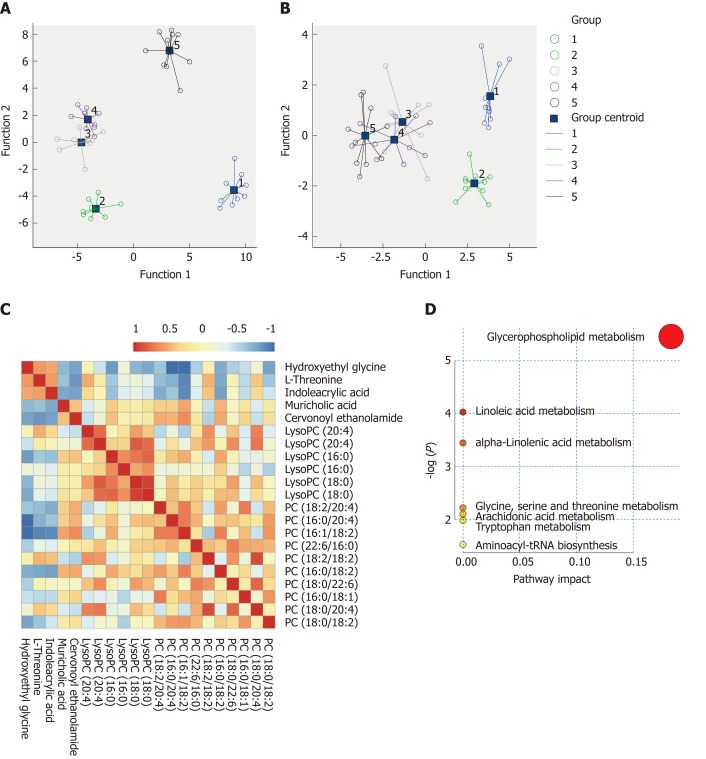
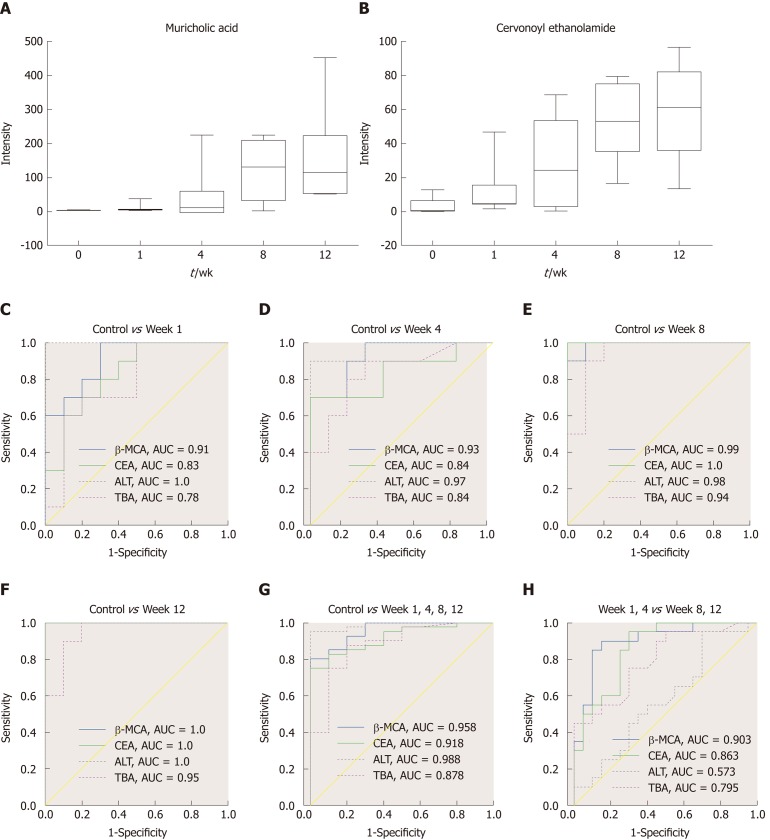
Results: To investigate the dynamic changes of metabolites during the process of liver fibrosis, sera from control and fibrosis model rats based on pathological results were analyzed at five different time points. We investigated the association of liver fibrosis with 21 metabolites including hydroxyethyl glycine, L-threonine, indoleacrylic acid, β-muricholic acid (β-MCA), cervonoyl ethanolamide (CEA), phosphatidylcholines, and lysophosphatidylcholines. Two metabolites, CEA and β-MCA, differed significantly in the fibrosis model rats compared to controls (P < 0.05) and showed prognostic value for fibrosis. ROC curve analyses performed to calculate the area under the curve (AUC) revealed that CEA and β-MCA differed significantly in the fibrosis group compared to controls with AUC values exceeding 0.8, and can clearly differentiate early stage from late stage fibrosis or cirrhosis.

Conclusion: This study identified two novel biomarkers of fibrosis, CEA and β-MCA, which were effective for diagnosing fibrosis in an animal model.

Keywords: Biomarker; Cervonoyl ethanolamide; Liver fibrosis; Metabonomics; Ultra-performance liquid chromatography-mass spectrometry; β-muricholic acid.


Conflict of interest statement

Conflict-of-interest statement: The authors declare no conflict of interest.

Figures

Figure 1
Figure 1
Dynamic changes in serum biochemical parameters during the process of fibrosis. A: Albumin, total protein, and globulin; B: Alanine aminotransferase, aspartate aminotransferase, and alkaline phosphatase; C: Bile acid, total bilirubin, and creatinine. ALB: Albumin; TP: Total protein; GLO: Globulin; ALT: Alanine aminotransferase; AST: Aspartate aminotransferase; AKP: Alkaline phosphatase; BA: Bile acid; TBIL: Total bilirubin; CR: Creatinine.
Figure 2
Figure 2
Histological assessment in each group using hematoxylin and eosin and Masson’s trichrome staining. A-E: Liver tissues were stained with HE in the control and fibrosis model groups at weeks 1, 4, 8, and 12; F: The injury score of fibrosis in each group; G-K: Liver tissues were stained using MTC in the control and fibrosis model groups at weeks 1, 4, 8, and 12 (aP < 0.01 vs control). Scale bars: 100 μm. HE: Hematoxylin and eosin; MTC: Masson’s trichrome.
Figure 3
Figure 3
Immunohistochemistry results and relative mRNA expression levels of α-smooth muscle actin and transforming growth factor β1. A-E: Immunohistochemical staining for α-SMA; F: qRT-PCR results of α-SMA at each time point; G-K: Immunohistochemical staining for TGF-β1; L: qRT-PCR results of TGF-β1 at each time point. The data are presented as the mean ± SD (error bars) and were statistically analyzed using a Student’s t-test. aP < 0.01 vs control. Scale bars: 100 μm. α-SMA: α-smooth muscle actin; TGF-β1: Transforming growth factor-β1; qRT-PCR: Quantitative real-time polymerase chain reaction.
Figure 4
Figure 4
Metabolomic profiling and flux analyses. A: Principle component analysis for the control and fibrosis model groups at weeks 1, 4, 8, and 12; B: Orthogonal partial least squares discriminant analysis score plots for the control and fibrosis model groups at weeks 1, 4, 8, and 12; C: Heat map generated from the liquid chromatography-mass spectrometry data using the hierarchical clustering algorithm; D-G: Volcano plot analyses were used to determine the significant metabolites in the fibrosis model groups compared to controls at weeks 1, 4, 8, and 12. Data points with fold changes > 2 and P < 0.05 are labeled in red.
Figure 5
Figure 5
Metabolite quantification and identification. A and B: Scatter plots of discriminant analyses in five groups based on metabolic profiles and biochemical parameters; C: Correlation analyses of the metabolic profiles. The color saturation of red and blue represents positive and negative correlation coefficients, respectively, between markers; D: Overview of pathway analyses based on selected metabolites.
Figure 6
Figure 6
Biomarker candidates for liver fibrosis. A and B: Dynamic changes in the identified metabolites in each group; C-H: Receiver operator characteristic curves for the diagnosis of liver fibrosis based on the potential biomarkers, TBA and ALT. TBA: Total bile acid; ALT: Alanine aminotransferase; AUC: Area under the curve; CEA: Cervonoyl ethanolamide; β-MCA: β-muricholic acid.

References

    1. Bataller R, Brenner DA. Liver fibrosis. J Clin Invest. 2005;115:209–218. - PMC - PubMed
    1. Zhang S, Wu J, Wang H, Wang T, Jin L, Shu D, Shan W, Xiong S. Liposomal oxymatrine in hepatic fibrosis treatment: Formulation, in vitro and in vivo assessment. AAPS PharmSciTech. 2014;15:620–629. - PMC - PubMed
    1. Eng FJ, Friedman SL. Fibrogenesis I. New insights into hepatic stellate cell activation: The simple becomes complex. Am J Physiol Gastrointest Liver Physiol. 2000;279:G7–G11. - PubMed
    1. Marcellin P, Asselah T, Boyer N. Fibrosis and disease progression in hepatitis C. Hepatology. 2002;36:S47–S56. - PubMed
    1. Chao DT, Lim JK, Ayoub WS, Nguyen LH, Nguyen MH. Systematic review with meta-analysis: The proportion of chronic hepatitis B patients with normal alanine transaminase ≤ 40 IU/L and significant hepatic fibrosis. Aliment Pharmacol Ther. 2014;39:349–358. - PubMed

MeSH terms