Steady-State Visually Evoked Potentials Elicited by Multifrequency Pattern-Reversal Stimulation
- PMID: 30834172
- PMCID: PMC6396688
- DOI: 10.1167/tvst.8.1.24
Steady-State Visually Evoked Potentials Elicited by Multifrequency Pattern-Reversal Stimulation
Abstract
Purpose: It has been shown that multifrequency stimulation with multifocal electroretinography can reduce recording time without a loss in signal-to-noise ratio. Here, we studied the applicability of multifrequency stimulations for steady-state visually evoked potential (VEP) recordings.
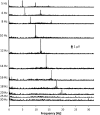
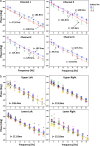
Methods: Multifrequency VEPs were recorded monocularly from 10 healthy subjects using pattern-reversal stimuli. The reversal frequency varied between 5 and 30 Hz. Pattern-reversal checkerboard stimuli were generated using four square arrays, each containing 100 light-emitting diodes (LEDs), positioned in four quadrants. Each array had a temporal frequency that differed slightly from the nominal frequency. The long duration of the data acquisition ensured that the slightly different stimulus frequencies in the four LED arrays can be resolved and that the responses to the stimulus in each array can be distinguished (e.g., with a frequency resolution: 0.011 Hz at 12 Hz). The best response from the four recording electrode configuration, defined as the recording with the maximal signal-to-noise ratio, was used for further analysis. Algorithmic latencies were calculated from the ratio of phase data and frequencies in a range of 4 and 20 Hz.
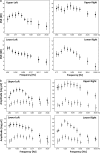
Results: Quadrant-VEPs with simultaneous pattern-reversal stimulation yielded a significant dependency on temporal frequency and stimulus location. The frequency range leading to the maximal response amplitude was between 10 and 12 Hz. Response phases decreased approximately linearly, with increasing temporal frequency suggesting a mean algorithmic latency between 112 and 126 ms.
Conclusions: Multifrequency stimulation using LED arrays is an efficient method for recording pattern-reversal VEPs while all stimuli are presented at the same time.
Translational relevance: Simultaneously recorded VEPs as performed by the multi-frequency method can be used for objective measurements of visual field defects.
Keywords: multifocal VEP; objective visual field test; pattern reversal; signal-to-noise ratio; steady-state.
Figures


Similar articles
-
Objective detection of visual field defects with multifrequency VEPs.Doc Ophthalmol. 2024 Feb;148(1):15-24. doi: 10.1007/s10633-023-09949-4. Epub 2023 Sep 26. Doc Ophthalmol. 2024. PMID: 37749441 Free PMC article.
-
Steady-state multifocal visual evoked potential (ssmfVEP) using dartboard stimulation as a possible tool for objective visual field assessment.Graefes Arch Clin Exp Ophthalmol. 2016 Feb;254(2):259-68. doi: 10.1007/s00417-015-3214-9. Epub 2015 Nov 9. Graefes Arch Clin Exp Ophthalmol. 2016. PMID: 26553198
-
[Transient and steady-state electroretinograms and visual evoked potentials to pattern and uniform-field stimulation in humans].Fukuoka Igaku Zasshi. 1994 Jul;85(7):225-34. Fukuoka Igaku Zasshi. 1994. PMID: 8070753 Japanese.
-
Monocular and binocular steady-state flicker VEPs: frequency-response functions to sinusoidal and square-wave luminance modulation.Doc Ophthalmol. 2011 Feb;122(1):63-70. doi: 10.1007/s10633-011-9260-7. Epub 2011 Jan 29. Doc Ophthalmol. 2011. PMID: 21279419
-
Visually evoked potentials.Handb Clin Neurol. 2019;160:501-522. doi: 10.1016/B978-0-444-64032-1.00034-5. Handb Clin Neurol. 2019. PMID: 31277872 Review.
Cited by
-
Blue-Yellow VEP with Projector-Stimulation in Glaucoma.Graefes Arch Clin Exp Ophthalmol. 2022 Apr;260(4):1171-1181. doi: 10.1007/s00417-021-05473-w. Epub 2021 Nov 25. Graefes Arch Clin Exp Ophthalmol. 2022. PMID: 34821990 Free PMC article.
-
Objective detection of visual field defects with multifrequency VEPs.Doc Ophthalmol. 2024 Feb;148(1):15-24. doi: 10.1007/s10633-023-09949-4. Epub 2023 Sep 26. Doc Ophthalmol. 2024. PMID: 37749441 Free PMC article.
References
-
- Regan D. Some characteristics of average steady-state and transient responses evoked by modulated light. Electroencephalogr Clin Neurophysiol. 1966;20:238–248. - PubMed
-
- Perlstein WM, Cole MA, Larson M, Kelly K, Seignourel P, Keil A. Steady-state visual evoked potentials reveal frontally-mediated working memory activity in humans. Neurosci Lett. 2003;342:191–195. - PubMed
-
- Gray M, Kemp AH, Silberstein RB, Nathan PJ. Cortical neurophysiology of anticipatory anxiety: an investigation utilizing steady state probe topography (SSPT) Neuroimage. 2003;20:975–986. - PubMed
-
- Horn FK, Selle F, Hohberger B, Kremers J. Steady-state multifocal visual evoked potential (ssmfVEP) using dartboard stimulation as a possible tool for objective visual field assessment. Graefes Arch Clin Exp Ophthalmol. 2016;254:259–268. - PubMed
-
- Kusel R, Wesemann W, Rassow B. A new laser interferometer for the stimulation of pattern-reversal visual evoked potentials. Clin Phys Physiol Meas. 1985;6:239–246. - PubMed
LinkOut - more resources
Full Text Sources

