. 2019 May;23(5):3549-3562.
doi: 10.1111/jcmm.14254. Epub 2019 Mar 4.

Effect of sonic hedgehog on motor neuron positioning in the spinal cord during chicken embryonic development

Affiliations

Effect of sonic hedgehog on motor neuron positioning in the spinal cord during chicken embryonic development

Ciqing Yang et al. J Cell Mol Med. 2019 May.

Abstract

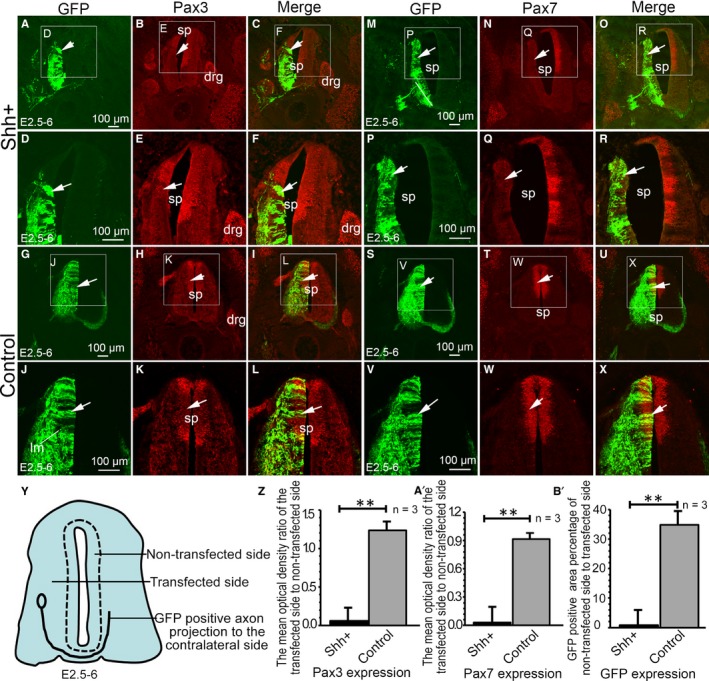
Sonic hedgehog (SHH) is a vertebrate homologue of the secreted Drosophila protein hedgehog and is expressed by the notochord and floor plate in the developing spinal cord. Sonic hedgehog provides signals relevant for positional information, cell proliferation and possibly cell survival, depending on the time and location of expression. Although the role of SHH in providing positional information in the neural tube has been experimentally proven, the underlying mechanism remains unclear. In this study, in ovo electroporation was employed in the chicken spinal cord during chicken embryo development. Electroporation was conducted at stage 17 (E2.5), after electroporation the embryos were continued incubating to stage 28 (E6) for sampling, tissue fixation with 4% paraformaldehyde and frozen sectioning. Sonic hedgehog and related protein expressions were detected by in situ hybridization and fluorescence immunohistochemistry and the results were analysed after microphotography. Our results indicate that the ectopic expression of SHH leads to ventralization in the spinal cord during chicken embryonic development by inducing abnormalities in the structure of the motor column and motor neuron integration. In addition, ectopic SHH expression inhibits the expression of dorsal transcription factors and commissural axon projections. The correct location of SHH expression is vital to the formation of the motor column. Ectopic expression of SHH in the spinal cord not only affects the positioning of motor neurons, but also induces abnormalities in the structure of the motor column. It leads to ventralization in the spinal cord, resulting in the formation of more ventral neurons forming during neuronal formation.

Keywords: chicken embryo; in ovo electroporation; motor neuron; sonic hedgehog; spinal cord.


Conflict of interest statement

The authors declare that they have no known conflicts of interest associated with this publication.

Figures

Figure 1
Figure 1
In situ hybridization demonstrates the ectopic expression of SHH. (A‐C) SHH ectopic expression following pCAGGS‐SHH and pCAGGS‐GFP co‐transfection; (D‐F) Control group after pCAGGS‐GFP transfection; (A) at stage 24 (E4), (B) at stage 27 (E5), (C) at stage 28 (E6), (D) at stage 24 (E4), (E) at stage 27 (E5) and (F) at stage 28 (E6), Arrows (→) indicate the areas of SHH ectopic expression. fp, floor plate; nc, notochord; sp, spinal cord; Scale bar =100 μm in F for A‐F
Figure 2
Figure 2
The effect of SHH ectopic expression on motor neuron (MNR2) positioning within the motor column in the chicken spinal cord. (A‐H) SHH ectopic expression following pCAGGS‐SHH and pCAGGS‐GFP co‐transfection at stage 17 (E2.5) to stage 28 (E6). DAPI nuclear staining (E, higher magnification of the boxed area in A), GFP expression (F, higher magnification of the boxed area in F, green), MNR2 expression (G, higher magnification of the boxed area in C, red) and merged images (H, higher magnification of the boxed area in D). I‐P: Control group after pCAGGS‐GFP transfection at stage 28 (E6). DAPI nuclear stain (M, higher magnification of the boxed area in I), GFP expression (N, higher magnification of the boxed area in J), MNR2 expression (O, higher magnification of the boxed area in K, red) and the merged image (P, higher magnification of the boxed area in L). Q, the pattern of the SHH ectopic expression, R, the pattern of the control, S, the MNR2 positive neuron ratio of the transfected to non‐transfected sides. Data are presented as mean ±SD ns, no difference (P > 0.05). n = 3, sample number is 3. mc, motor column, Arrows (→) indicate the area of MNR2 expression. Scale bars, 100 µm in A, E, I, M for A‐P, respectively
Figure 3
Figure 3
The effect of SHH ectopic expression on FoxP1, Islet1 and Nkx2.2 labelled neurons in the chicken spinal cord. (A‐H) FoxP1 labelling of neurons in the chicken spinal cord. (A‐D) SHH ectopic expression following pCAGGS‐SHH and pCAGGS‐GFP co‐transfection at stage 17 (E2.5) to stage 28 (E6). A: DAPI staining (blue), B: GFP expression (green), C: FoxP1 expression (red) and merged images are shown in D. E‐H: Control group pCAGGS‐GFP transfection at stage 17 (E2.5) to stage 28 (E6). E: DAPI staining (blue), F: GFP expression (green), G: Fox P1 expression (red) and merged images are shown in H. Arrows (→) denote FoxP1 positive cells. I‐P: Islet‐1 labelling of neuronal in the chicken spinal cord. I‐L: SHH ectopic expression following pCAGGS‐SHH and pCAGGS‐GFP co‐transfection at stage 17 (E2.5) to stage 28 (E6). I: DAPI staining (blue), J: GFP expression (green), K: Islet‐1 expression (red) and merged images are shown in L. M‐P: Control group pCAGGS‐GFP transfection at stage 17 (E2.5) to stage 28 (E6). M: DAPI staining (blue), N: GFP expression (green), O: Islet‐1 expression (red) and merged images are shown in P. Arrows (→) denote Islet‐1 positive cells. Q‐X: Nkx 2.2 labelling of neurons in the chicken spinal cord. Q‐T: SHH ectopic expression following pCAGGS‐SHH and pCAGGS‐GFP co‐transfection at stage 17 (E2.5) to stage 28 (E6). Q: DAPI staining (blue), R: GFP expression (green), S: Nkx 2.2 expression (red) and merged images are shown in T. U‐X: Control group pCAGGS‐GFP transfection at stage 17 (E2.5) to stage 28 (E6). U: DAPI staining (blue), V: GFP expression (green), W: Nkx 2.2 expression (red) and merged images are shown in X. Arrowheads (→) denote Nkx2.2 positive cells. drg, dorsal root ganglion; mc, motor column; sp, spinal cord. Scale bars, 100 µm in A, E, I, M, Q, U for A‐X, respectively
Figure 4
Figure 4
The effect of SHH ectopic expression on neuroepithelial cell proliferation in the developing chicken spinal cord. (A‐D) SHH ectopic expression following pCAGGS‐SHH and pCAGGS‐GFP co‐transfection for stage 24. DAPI nuclear staining (A), GFP expression (B, green), BrdU expression (C, red) and merged images (D). E, the pattern of spinal tissue slice section at stage 24 h. F‐I: Control group after pCAGGS‐GFP transfection at stage 24. DAPI nuclear stain (F, blue), GFP expression (G, green), BrdU expression (H, red) and merged image (I). J, the ratio of BrdU‐positive cell numbers on the transfected side to non‐transfected side (T/N) at stage 24; K‐N: SHH ectopic expression following pCAGGS‐SHH and pCAGGS‐GFP co‐transfection at stage 28. DAPI nuclear staining (U, higher magnification of the boxed area in K), GFP expression (V, higher magnification of the boxed area in L, green), BrdU expression (W, higher magnification of the boxed area in M, red) and merged images (X, higher magnification of the boxed area in N). O, the pattern of spinal tissue slice section at 84 h. P‐S: Control group after pCAGGS‐GFP transfection at stage 28. DAPI nuclear stain (Z, higher magnification of the boxed area in P), GFP expression (A’, higher magnification of the boxed area in Q), BrdU expression (B’, higher magnification of the boxed area in R, red) and merged image (C’, higher magnification of the boxed area in S). T, the ratio of BrdU‐positive cell numbers on the transfected side to non‐transfected side (T/N) at stage 28; Y’, the pattern of spinal tissue slice section in ventral areas at stage 28. D’, the ratio of BrdU‐positive cell numbers on the transfected side to non‐transfected side (T/N) in ventral areas at stage 28. Data are presented as mean ±SD **P < 0.01. n = 3, sample number is 3. ne, neuroepithelial cells. Scale bars, 100 µm in A, E, I, M, Q, U for A‐X, respectively
Figure 5
Figure 5
The effect of SHH ectopic expression on Pax3 and Pax7 in the developing chicken spinal cord. (A‐F) SHH ectopic expression group with pCAGGS‐SHH and pCAGGS‐GFP plasmid co‐transfection, showing GFP (D, higher magnification of the boxed area in A), Pax3 (E, higher magnification of the boxed area in B) expression and merged image (F, higher magnification of the boxed area in C). G‐L: Control group with pCAGGS‐GFP plasmid transfection, showing GFP (J, higher magnification of the boxed area in G), Pax3 (K, higher magnification of the boxed area in H) expression and merged image (L, higher magnification of the boxed area in I). M‐R: SHH ectopic expression group with pCAGGS‐SHH and pCAGGS‐GFP plasmid co‐transfection, showing GFP (M, higher magnification in P), Pax7 (N, higher magnification in Q) expression and merged image (R, higher magnification of the boxed area in O). S‐X: Control group with pCAGGS‐GFP plasmid transfection, showing GFP (V, higher magnification of the boxed area in S), Pax7 (W, higher magnification of the boxed area in T) expression and merged image (X, higher magnification of the boxed area in U). Y, the pattern of spinal tissue slice section. Z, the mean optical density ratio of the transfected side to non‐transfected side; A’, the mean optical density ratio of the transfected side to non‐transfected side; B’, percentage of GFP positive area non‐transfected side to transfected side (%). Data are presented as mean ±SD **P < 0.01. n = 3, sample number is 3. drg, dorsal root ganglion; sp, spinal cord. Arrows (→) indicate the areas of Pax3 or Pax7 expression. Scale bars, 100 µm in A, D, G, J for A‐L. 100 µm in M, P, S, V for M‐X, respectively
Figure 6
Figure 6
The effect of SHH ectopic expression on microtubule‐associated protein‐2 (MAP2) expression within the motor column in the developing chicken spinal cord. (A‐H) SHH ectopic expression following pCAGGS‐SHH and pCAGGS‐GFP co‐transfection at stage 28. DAPI nuclear staining (E, higher magnification of the boxed area in A), GFP expression (F, higher magnification of the boxed area in B,green), MAP2 expression (G,higher magnification of the boxed area in C,red) and merged images (H,higher magnification of the boxed area in D). I‐P: Control group after pCAGGS‐GFP transfection at stage 28. DAPI nuclear stain (M, higher magnification of the boxed area in I), GFP expression (N, higher magnification of the boxed area in J), Map2 expression (O, higher magnification of the boxed area in K, red) and the merged image (P, higher magnification of the boxed area in L). Q, the pattern of spinal tissue slice section, R, DAPI staining nuclei number ratio of transfected to non‐transfected sides in the motor column. Data are presented as mean ±SD **P < 0.01. n = 3, sample number is 3. mc, motor column; sp, spinal cord. Arrows (→) indicate the areas of MAP2 expression. Scale bars, 100 µm in A, E, I, M for A‐P, respectively
Figure 7
Figure 7
The effect of SHH ectopic expression on commissural axon projections in the developing chicken spinal cord. Rostro‐caudal series of transverse sections after electroporation of ectopic SHH expression (SHH ectopic expression; A‐G); H, the pattern of commissural axon projections. The GFP control expression (control; I‐O); P, the pattern of commissural axon projections. In ovo electroporation was performed at stage 17 (2.5 days’ incubation) and the positive embryos were collected at stage 28. Abbreviations: fp, floor plate; ilc, intermediate longitudinal commissural axons; mlc, medial longitudinal commissural axons; rp, roof plate. Scale bar: 100 µm in O for A‐G and I‐O
Figure 8
Figure 8
The effect of SHH ectopic expression on NF labelled neurites in the chicken spinal cord. (A‐D) SHH ectopic expression following pCAGGS‐SHH and pCAGGS‐GFP co‐transfection at stage 17 (E2.5) to stage 28 (E6). DAPI staining (blue, A), GFP expression (green, B), NF expression (red, C) and merged images in (D) are shown. E‐H: Control group pCAGGS‐GFP transfection at stage 17 (E2.5) to stage 28 (E6). DAPI staining (blue, E), GFP expression (green, F), NF expression (red, G) and merged images in (H) are shown. I, the pattern of spinal tissue slice section, J, NF positive area ratio of non‐transfected side to transfected side. Data are presented as mean ±SD ns, no difference (P > 0.05). n = 3, sample number is 3. Arrows (→) denote drg. drg, dorsal root ganglion, sp, spinal cord. Scale bars, 100 µm in A, E for A‐H respectively

Similar articles

Cited by

References

    1. Cayuso J, Ulloa F, Cox B, Briscoe J, Martí E. The Sonic hedgehog pathway independently controls the patterning, proliferation and survival of neuroepithelial cells by regulating Gli activity. Development. 2006;133:517‐528. - PubMed
    1. Pringle NP, Yu WP, Guthrie S, et al. Determination of neuroepithelial cell fate: induction of the oligodendrocyte lineage by ventral midline cells and sonic hedgehog. Dev Biol. 1996;177:30‐42. - PubMed
    1. Yamada T, Placzek M, Tanaka H, Dodd J, Jessell TM. Control of cell pattern in the developing nervous system: polarizing activity of the floor plate and notochord. Cell. 1991;64:635‐647. - PubMed
    1. Yamada T, Pfaff SL, Edlund T, Jessell TM. Control of cell pattern in the neural tube: motor neuron induction by diffusible factors from notochord and floor plate. Cell. 1993;73:673‐686. - PubMed
    1. Tanabe Y, Roelink H, Jessell TM. Induction of motor neurons by sonic hedgehog is independent of floor plate differentiation. Curr Biol. 1995;5:651‐658. - PubMed

Publication types