Comparative Study
. 2019 Mar;24(3):1-8.
doi: 10.1117/1.JBO.24.3.036001.

Comparison of phosphorescent agents for noninvasive sensing of tumor oxygenation via Cherenkov-excited luminescence imaging

Affiliations
Comparative Study

Comparison of phosphorescent agents for noninvasive sensing of tumor oxygenation via Cherenkov-excited luminescence imaging

Jennifer Shell et al. J Biomed Opt. 2019 Mar.

Abstract

Cherenkov emission generated in tissue during radiotherapy can be harnessed for the imaging biochemistry of tissue microenvironments. Cherenkov-excited luminescence scanned imaging (CELSI) provides a way to optically and noninvasively map oxygen-related signals, which is known to correlate to outcomes in radiotherapy. Four candidate phosphorescent reagents PtG4, MM2, Ir(btb)2 ( acac ) , and MitoID were studied for oxygen sensing, testing in a progressive series of (a) in solution, (b) in vitro, and (c) in subcutaneous tumors. In each test, the signal strength and response to oxygen were assessed by phosphorescence intensity and decay lifetime measurement. MM2 showed the most robust response to oxygen changes in solution, followed by PtG4, Ir(btb)2 ( acac ) , and MitoID. However, in PANC-1 cells, their oxygen responses differed with Ir(btb)2 ( acac ) exhibiting the largest phosphorescent intensity change in response to changes in oxygenation, followed by PtG4, MM2, and MitoID. In vivo, it was only possible to utilize Ir(btb)2 ( acac ) and PtG4, with each being used at nanomole levels, to determine signal strength, lifetime, and pO2. Oxygen sensing with CELSI during radiotherapy is feasible and can estimate values from 1 mm regions of tissue when used in the configuration of this study. PtG4 was the most amenable to in vivo sensing on the timescale of external beam LINAC x-rays.

Keywords: Cherenkov radiation; optical imaging; phosphorescence; tumor hypoxia.


Figures

Fig. 1
Fig. 1
Absorbance and emission spectra for oxygen sensors. The absorbance and fluorescence emission spectra for Ir(btb)2(acac) (blue), MitoID (red), PtG4 (green), and MM2 (gray).
Fig. 2
Fig. 2
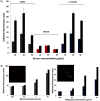
Comparison of commercially available oxygen sensors in PANC-1 cells. (a) MM2 (gray), MitoID (red), and Ir(btb)2(acac) (blue) were incubated with PANC-1 cells overnight. Fluorescence was measured in the presence of ambient oxygen [light gray, MM2, medium gray, MitoID, and dark gray, Ir(btb)2(acac)] and with glucose oxidase catalase enzymatic oxygen scavenging (black). (b) The brightest commercial oxygen sensors were explored at decreasing concentrations (20, 2, 0.2, and 0.02  μg/mL) to determine the lowest concentration that can be detected. Inset shows fluorescence microscopy of each sensor (20  μg/mL) loaded into PANC-1 cells. Excitation and emission were measured at 380 and 660 nm, respectively. The fluorescence intensity represents the average of six experiments ±SEM.
Fig. 3
Fig. 3
Comparison of CEL with phosphorescent oxygen sensors. Increasing concentrations of each sensor indicated by darker shades of each color [0.02, 0.2, 2, and 20  μg/mL, MitoID (red), MM2 (gray), PtG4 (green), and Ir(btb)2(acac) (blue)] were analyzed in ambient oxygen or with enzymatic oxygen scavenger glucose oxidase/catalase (black). A 96-well plate with these reagents in (a) solution or (b) loaded into PANC-1 cells was exposed to 6-MV radiation from a LINAC, and the phosphorescence intensity was measured via ICCD.
Fig. 4
Fig. 4
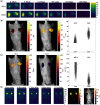
CELSI setup and in vivo imaging with PtG4 and Ir(btb)2(acac). The LINAC gantry head that delivers radiation is placed below the mouse that is positioned on the treatment couch. A mirror above redirects the photons to the ICCD. (a) Lateral view of the mouse depicting passage of radiation sheet in red (b) aerial view as imaged from the ICCD camera. (c) Under anesthesia of isofluorane, 2.5 nmol of each reagent was injected into subcutaneous MDA-MB-231luc-D3H2LN tumors. Maximum intensity projection of PtG4 and of Ir(btb)2(acac) at 4.26  μs delay time, respectively. Tumors are indicated with line arrows.
Fig. 5
Fig. 5
In vivo lifetime imaging with PtG4 and Ir(btb)2(acac). Under anesthesia of isofluorane, the animal was imaged at various delay times based on reported lifetimes of each reagent to gain emission lifetime information alive and 30 min after euthanize, when the drop in blood circulation and respiration causes a marked decrease in pO2 values. (a) Comparison of PtG4 phosphorescence intensity at various delay times based on known PtG4 emission lifetime in subcutaneous tumors alive (top) and 30 min after euthanize(bottom). (b) PtG4 emission lifetime maps and box and whiskers plot of emission lifetimes of alive and euthanized mouse. (c) pO2 maps and box and whiskers plot of oxygen levels in alive and euthanized mouse for PtG4. (d) Phosphorescence intensity of tumors injected with Ir(btb)2(acac) at different delay times informed from the reported Ir(btb)2(acac) emission lifetime, map of emission lifetime, and pO2 map in euthanized mouse. All lifetime maps and subsequent pO2 maps for both reagents were constructed utilizing data from the 4.26-μs delay time.
Fig. 6
Fig. 6
Considerations for CELSI. (a) Cherenkov imaging timing. Experimentally, the gate width is generally set between 5 and 10 times the deoxygenated lifetime (τ0) of the reagent of interest. Luminescence is detected at a series of delay times (red blocks) after the Cherenkov emission (blue column) to assess the emission lifetime of phosphorescent agents. The LINAC generates radiation pulses at a repetition rate between 2.7 and 17 ms (600 to 100  MU/min). (b) Plot of emission decay curves as a function of quantum yield.

Similar articles

Cited by

References

    1. Vaupel P., Mayer A., Hockel M., “Impact of hemoglobin levels on tumor oxygenation: the higher, the better?” Strahlenther. Onkol. 182(2), 63–71 (2006).10.1007/s00066-006-1543-7 - DOI - PubMed
    1. Evans S. M., Koch C. J., “Prognostic significance of tumor oxygenation in humans,” Cancer Lett. 195(1), 1–16 (2003).CALEDQ10.1016/S0304-3835(03)00012-0 - DOI - PubMed
    1. Bussink J., et al. , “Effects of nicotinamide and carbogen on oxygenation in human tumor xenografts measured with luminescense based fiber-optic probes,” Radiother. Oncol. 57(1), 21–30 (2000).10.1016/S0167-8140(00)00275-9 - DOI - PubMed
    1. Turaka A., et al. , “Hypoxic prostate/muscle ratio predicts for outcome in patients with localized prostate cancer: long-term results,” Int. J. Radiat. Oncol. Biol. Phys. 82(3), e433–e439 (2012).10.1016/j.ijrobp.2011.05.037 - DOI - PubMed
    1. Vaupel P., Kelleher D. K., “Blood flow and oxygenation status of prostate cancers,” Adv. Exp. Med. Biol. 765, 299–305 (2013).10.1007/978-1-4614-4989-8 - DOI - PubMed

Publication types