

Recent development of carbon quantum dots regarding their optical properties, photoluminescence mechanism, and core structure
- PMID: 30834912
- PMCID: PMC6467229
- DOI: 10.1039/c8nr10059d
Recent development of carbon quantum dots regarding their optical properties, photoluminescence mechanism, and core structure
Abstract
Carbon quantum dots (CDs) are a relatively new class of carbon nanomaterials which have been studied very much in the last fifteen years to improve their already favorable properties. The optical properties of CDs have drawn particular interest as they display the unusual trait of excitation-dependent emission, as well as high fluorescence quantum yields (QY), long photoluminescence (PL) decay lifetimes, and photostability. These qualities naturally lead researchers to apply CDs in the field of imaging (particularly bio-imaging) and sensing. Since the amount of publications regarding CDs has been growing nearly exponentially in the last ten years, many improvements have been made in the optical properties of CDs such as QY and PL lifetime. However, a great deal of confusion remains regarding the PL mechanism of CDs as well as their structural properties. Therefore, presented in this review is a summary and discussion of the QYs and PL lifetimes reported in recent years. The effect of method as well as precursor has been evaluated and discussed appropriately. The current theories regarding the PL mechanism of CDs are discussed, with special attention to the concept of surface state-controlled PL. With this knowledge, the improvement of preparation and applications of CDs related to their optical properties will be easily accomplished. Further improvements can be made to CDs through the understanding of their structural and optical properties.
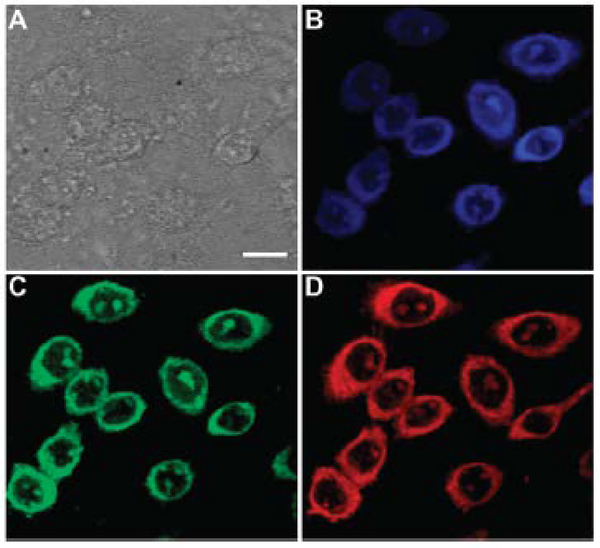
Figures


Similar articles
-
Fluorescent Carbon Dots an Effective Nano-Thermometer in Vitro Applications.ACS Appl Bio Mater. 2021 Jul 19;4(7):5786-5796. doi: 10.1021/acsabm.1c00528. Epub 2021 Jul 8. ACS Appl Bio Mater. 2021. PMID: 35006753
-
High Performance Photoluminescent Carbon Dots for In Vitro and In Vivo Bioimaging: Effect of Nitrogen Doping Ratios.Langmuir. 2015 Jul 28;31(29):8063-73. doi: 10.1021/acs.langmuir.5b01875. Epub 2015 Jul 15. Langmuir. 2015. PMID: 26135003
-
Photoluminescence Mechanism of Carbon Dots: Triggering Multiple Color Emissions through Controlling the Degree of Protonation.Molecules. 2022 Oct 2;27(19):6517. doi: 10.3390/molecules27196517. Molecules. 2022. PMID: 36235054 Free PMC article.
-
Insights into photoluminescence mechanisms of carbon dots: advances and perspectives.Sci Bull (Beijing). 2021 Apr 30;66(8):839-856. doi: 10.1016/j.scib.2020.12.015. Epub 2020 Dec 16. Sci Bull (Beijing). 2021. PMID: 36654140 Review.
-
Fluorescent Mechanism in Zero-Dimensional Carbon Nanomaterials: A Review.J Fluoresc. 2022 May;32(3):887-906. doi: 10.1007/s10895-022-02915-4. Epub 2022 Mar 18. J Fluoresc. 2022. PMID: 35303239 Review.
Cited by
-
Chemical- and green-precursor-derived carbon dots for photocatalytic degradation of dyes.iScience. 2024 Jan 17;27(2):108920. doi: 10.1016/j.isci.2024.108920. eCollection 2024 Feb 16. iScience. 2024. PMID: 38352227 Free PMC article. Review.
-
The Green Synthesis of Carbon Quantum Dots through One-step Hydrothermal Approach by Orange Juice for Rapid, and Accurate Detection of Dopamine.J Fluoresc. 2024 Nov;34(6):2665-2677. doi: 10.1007/s10895-023-03483-x. Epub 2023 Oct 26. J Fluoresc. 2024. PMID: 37882934
-
A Green Synthesis Route to Derive Carbon Quantum Dots for Bioimaging Cancer Cells.Nanomaterials (Basel). 2023 Jul 19;13(14):2103. doi: 10.3390/nano13142103. Nanomaterials (Basel). 2023. PMID: 37513114 Free PMC article.
-
Solvent Effects on Fluorescence Properties of Carbon Dots: Implications for Multicolor Imaging.ACS Omega. 2021 Sep 27;6(40):26499-26508. doi: 10.1021/acsomega.1c03731. eCollection 2021 Oct 12. ACS Omega. 2021. PMID: 34661005 Free PMC article.
-
Synthesis and characterization of Mono-disperse Carbon Quantum Dots from Fennel Seeds: Photoluminescence analysis using Machine Learning.Sci Rep. 2019 Sep 30;9(1):14004. doi: 10.1038/s41598-019-50397-5. Sci Rep. 2019. PMID: 31570739 Free PMC article.
References
Publication types
Grants and funding
LinkOut - more resources
Full Text Sources