. 2019 Mar 5:8:e43657.
doi: 10.7554/eLife.43657.

An atlas of polygenic risk score associations to highlight putative causal relationships across the human phenome

Affiliations

An atlas of polygenic risk score associations to highlight putative causal relationships across the human phenome

Tom G Richardson et al. Elife. .

Abstract

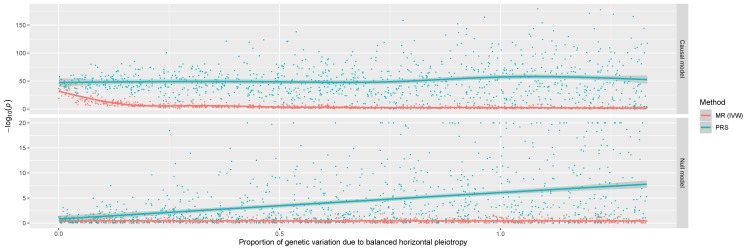
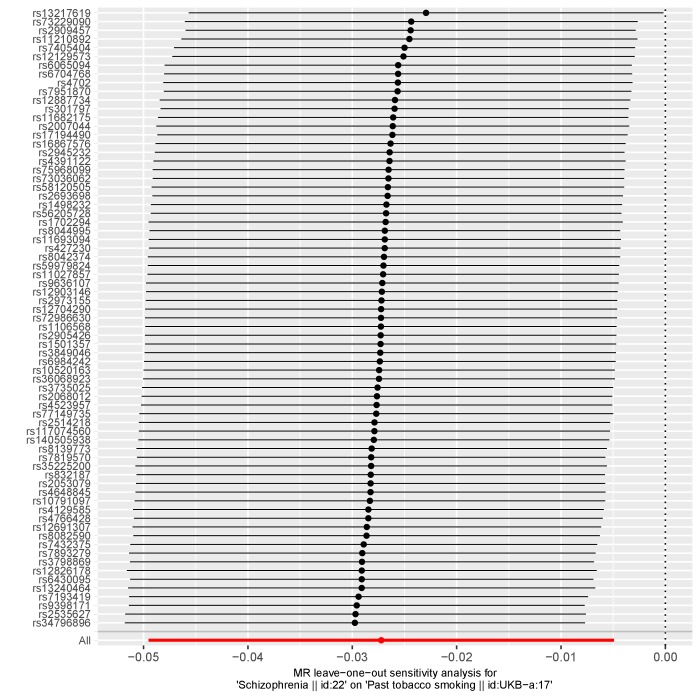
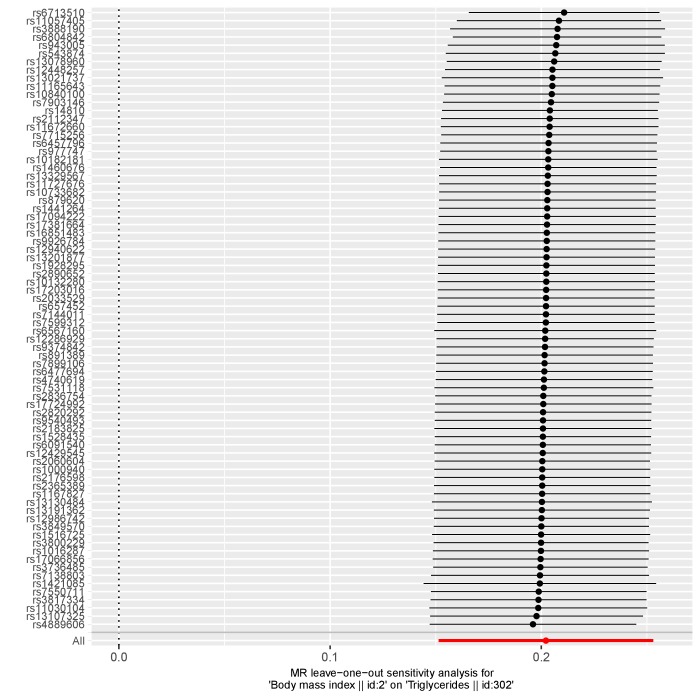
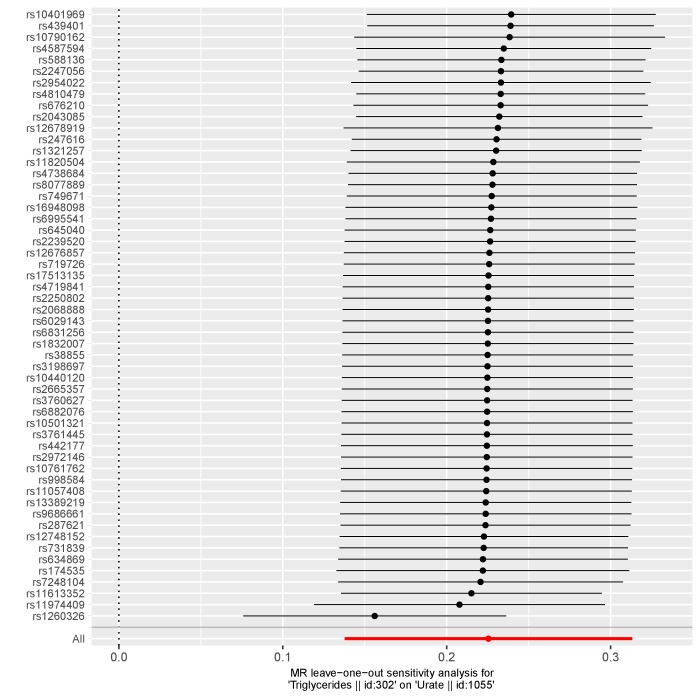
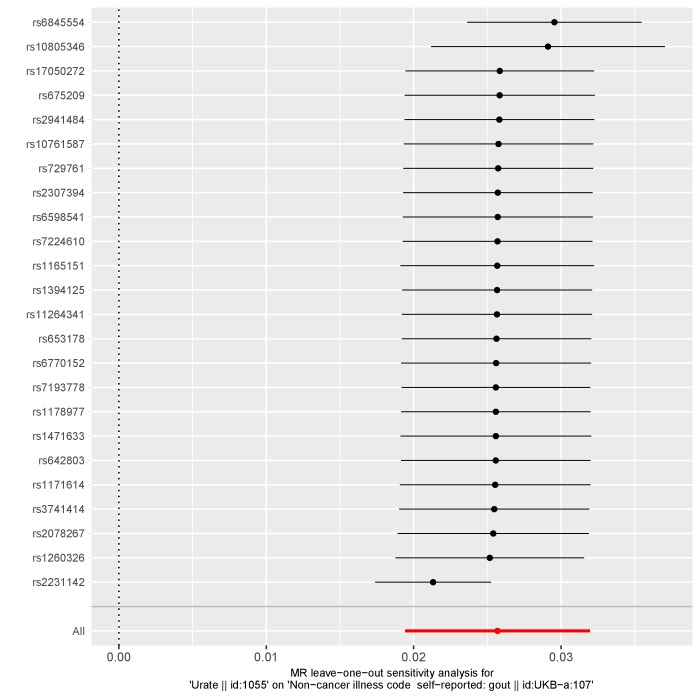
The age of large-scale genome-wide association studies (GWAS) has provided us with an unprecedented opportunity to evaluate the genetic liability of complex disease using polygenic risk scores (PRS). In this study, we have analysed 162 PRS (p<5×10-05) derived from GWAS and 551 heritable traits from the UK Biobank study (N = 334,398). Findings can be investigated using a web application (http:‌//‌mrcieu.‌mrsoftware.org/‌PRS‌_atlas/), which we envisage will help uncover both known and novel mechanisms which contribute towards disease susceptibility. To demonstrate this, we have investigated the results from a phenome-wide evaluation of schizophrenia genetic liability. Amongst findings were inverse associations with measures of cognitive function which extensive follow-up analyses using Mendelian randomization (MR) provided evidence of a causal relationship. We have also investigated the effect of multiple risk factors on disease using mediation and multivariable MR frameworks. Our atlas provides a resource for future endeavours seeking to unravel the causal determinants of complex disease.

Keywords: Mendelian randomization; causal inference; genetic liability; genetics; genomics; human; phenome-wide association study; polygenic risk scores.


Conflict of interest statement

TR, SH, GH, GD No competing interests declared

Figures

Figure 1.
Figure 1.. A comparison of the performance between the inverse variance weighted (IVW) Mendelian randomization (MR) model against polygenic risk score (PRS) analysis.
Simulations were conducted under different levels of horizontal pleiotropy for two different models; the causal model (where the simulated exposure has a causal effect on the outcome) and the null model (where there is no causal effect between exposure and outcome).
Figure 2.
Figure 2.. A receiver operator curve for ischaemic heart disease polygenic prediction.
A receiver operating characteristic (ROC) curve to compare the sensitivity and specificity of polygenic risk scores (PRS) and individuals with ischaemic heart disease (defined using ICD 10 codes ‘I25’) in the UK Biobank study. The scores evaluated were 1. Coronary Heart Disease (CHD), 2. A combined scored of CHD, Myocardial Infarction (MI) and Low Density Lipoprotein cholesterol (LDL), 3. All traits with a p-value<1×10−06 in our PRS analysis (excluding scores from GWAS overlapping with the UK Biobank sample). These were CHD, MI, LDL, Total cholesterol, Triglycerides, High Density Lipoprotein cholesterol, Years of schooling, Height and Waist Circumference. All PRS were constructed from GWAS using independent SNPs with p<5×10−05.
Figure 3.
Figure 3.. A bi-directional phenome-wide association plot for schizophrenia genetic liability.
Each point on this plot represents the association between the schizophrenia polygenic risk score (based on p<5×10−05) and a complex trait in the UK Biobank study. Along the y-axis are –log10 p-values for these associations multiplied by the direction of effect for their corresponding effect size. As such, traits positively associated with schizophrenia genetic liability reside above the horizontal grey line representing the null (i.e. –log10 (P) = 0), whereas negative associations are below. Points are grouped and coloured based on their corresponding complex traits’ subcategory. Horizontal red lines indicate the Bonferroni corrected threshold for the 551 tests undertaken (i.e. 0.05/551 = 9.07×10−05).
Figure 4.
Figure 4.. A receiver operator curve for gout polygenic prediction.
A receiver operating characteristic (ROC) curve to compare the sensitivity and specificity of polygenic risk scores (PRS) and individuals with self-reported gout in the UK Biobank study. The scores evaluated were gout and urate using independent SNPs identified by GWAS with p<5×10-05.
Figure 5.
Figure 5.. Applying (a) mediation and (b) multivariable Mendelian randomization investigate the causal effect of body mass index, triglycerides and urate on gout risk.
(a) Mediation Mendelian randomization (MR) framework to investigate whether urate mediates the effect of body mass index (BMI) and triglycerides (TG) on gout risk. The various analyses undertaken suggest that 1) elevated BMI increases TG levels 2) which subsequently has an effect on urate 3) and this in turn influences gout risk. This mediation pathway may help explain the manner by which BMI, potentially driven by lifestyle factors such as diet, is a risk factor for gout. (b) Multivariable MR framework attempting to reproduce findings from the mediation analysis. Genetic instruments for BMI, TG and urate were analysed simultaneously to evaluate the joint effect of these risk factors on gout risk. The effect of BMI and TG on gout risk attenuated compared to univariable analyses, suggesting that they influence gout risk through increased urate levels. Investigating each combination of pairwise risk factors using this framework suggested that BMI influences TG rather than the opposite direction of effect, which also supports findings from the mediation analysis.
Appendix 1—figure 1.
Appendix 1—figure 1.. A plot illustrating a leave-one out analysis between schizophrenia genetic liability and fluid intelligence.
Appendix 1—figure 2.
Appendix 1—figure 2.. A plot illustrating a leave-one out analysis between schizophrenia genetic liability and ‘number of incorrect matches in a round’.
Appendix 1—figure 3.
Appendix 1—figure 3.. A plot illustrating a leave-one out analysis between schizophrenia genetic liability and ‘number of unsuccessful smoking attempts’.
Appendix 1—figure 4.
Appendix 1—figure 4.. A plot illustrating a leave-one out analysis between schizophrenia genetic liability and past tobacco smoking.
Appendix 1—figure 5.
Appendix 1—figure 5.. A plot illustrating a leave-one out analysis between body mass index and triglycerides.
Appendix 1—figure 6.
Appendix 1—figure 6.. A plot illustrating a leave-one out analysis between triglycerides and urate.
Appendix 1—figure 7.
Appendix 1—figure 7.. A plot illustrating a leave-one out analysis between urate and gout.
Appendix 1—figure 8.
Appendix 1—figure 8.. A plot illustrating a leave-one out analysis between body mass index and gout.

References

    1. Abdellaoui A, Hugh-Jones D, Kemper KE, Holtz Y, Nivard MG, Veul L, Yengo L, Zietsch BP, Frayling TM, Wray N, Yang J, Verweij KJH, Visscher PM. Genetic consequences of social stratification in great britain. Biorxiv. 2018 doi: 10.1101/457515. - DOI - PubMed
    1. Abecasis GR, Auton A, Brooks LD, DePristo MA, Durbin RM, Handsaker RE, Kang HM, Marth GT, McVean GA, Project G, 1000 Genomes Project Consortium An integrated map of genetic variation from 1,092 human genomes. Nature. 2012;491:56–65. - PMC - PubMed
    1. Abraham G, Havulinna AS, Bhalala OG, Byars SG, De Livera AM, Yetukuri L, Tikkanen E, Perola M, Schunkert H, Sijbrands EJ, Palotie A, Samani NJ, Salomaa V, Ripatti S, Inouye M. Genomic prediction of coronary heart disease. European Heart Journal. 2016;37:3267–3278. doi: 10.1093/eurheartj/ehw450. - DOI - PMC - PubMed
    1. Bowden J, Davey Smith G, Burgess S. Mendelian randomization with invalid instruments: effect estimation and bias detection through egger regression. International Journal of Epidemiology. 2015;44:512–525. doi: 10.1093/ije/dyv080. - DOI - PMC - PubMed
    1. Bowden J, Davey Smith G, Haycock PC, Burgess S. Consistent estimation in mendelian randomization with some invalid instruments using a weighted median estimator. Genetic Epidemiology. 2016;40:304–314. doi: 10.1002/gepi.21965. - DOI - PMC - PubMed

Publication types