. 2019 May 1;36(5):1056-1070.
doi: 10.1093/molbev/msz041.

Ribosome Provisioning Activates a Bistable Switch Coupled to Fast Exit from Stationary Phase

Affiliations

Ribosome Provisioning Activates a Bistable Switch Coupled to Fast Exit from Stationary Phase

Philippe Remigi et al. Mol Biol Evol. .

Abstract

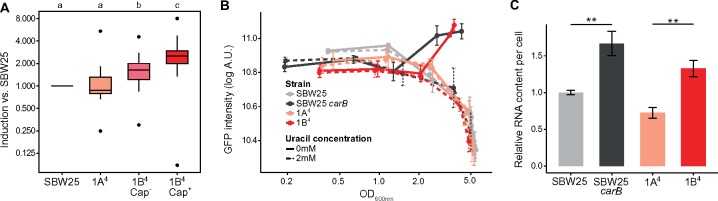
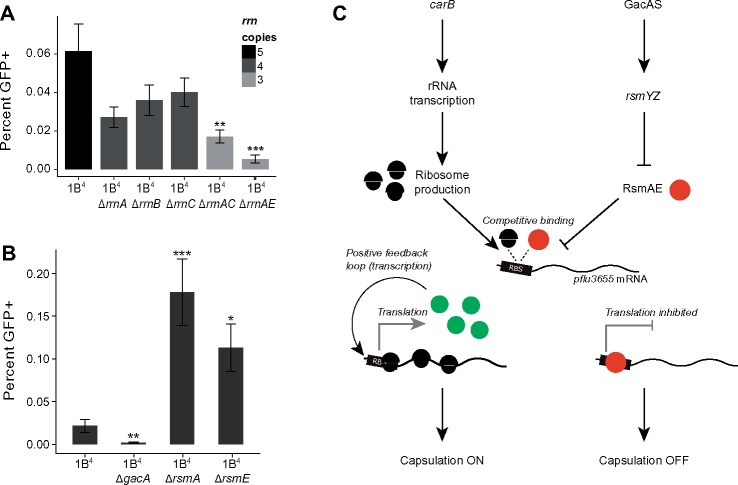
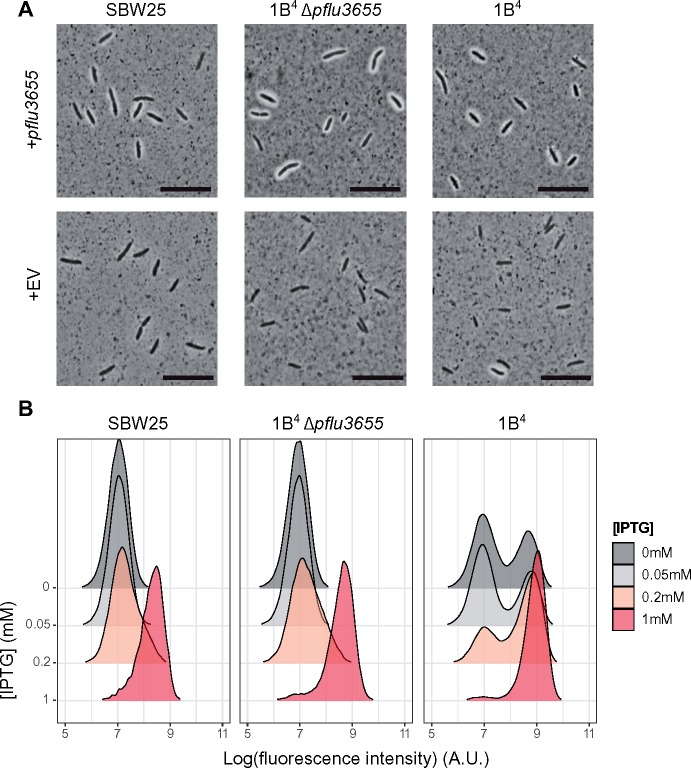
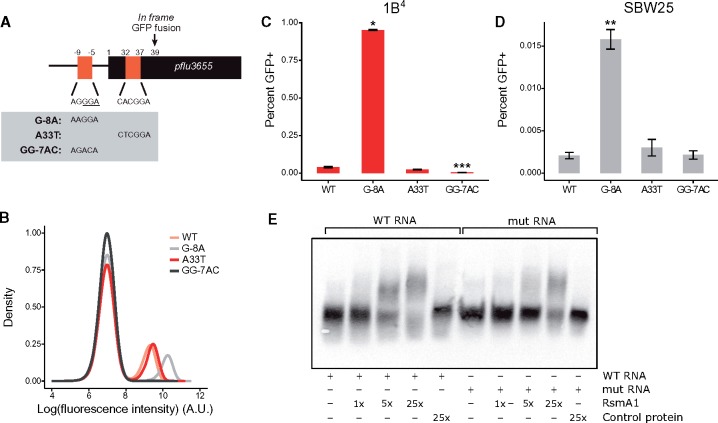
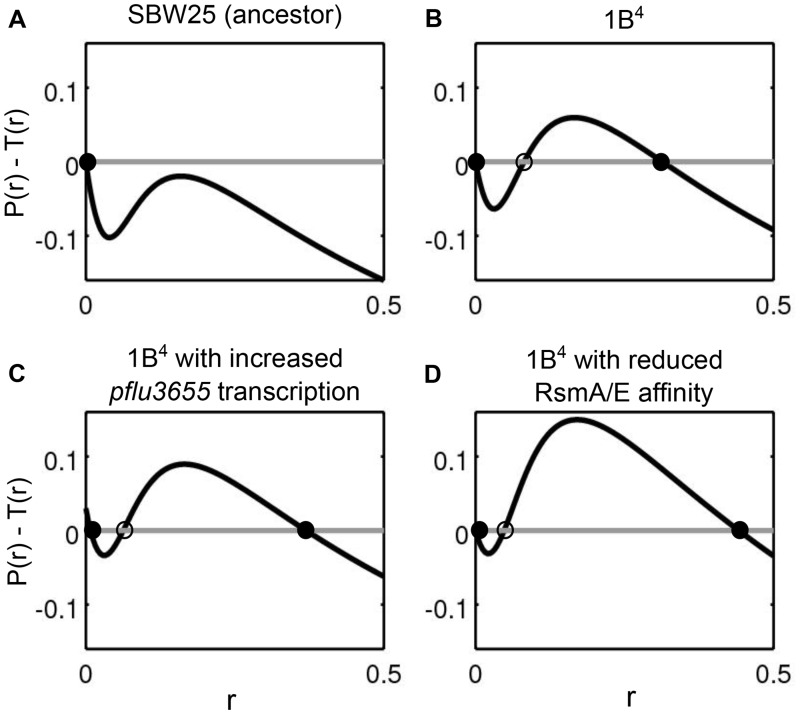
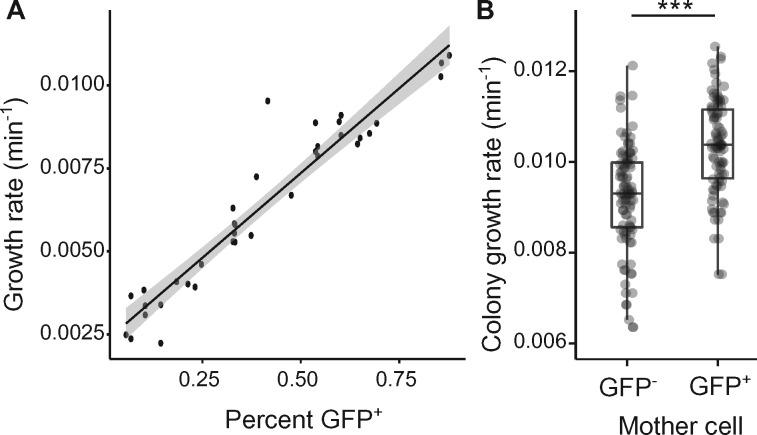
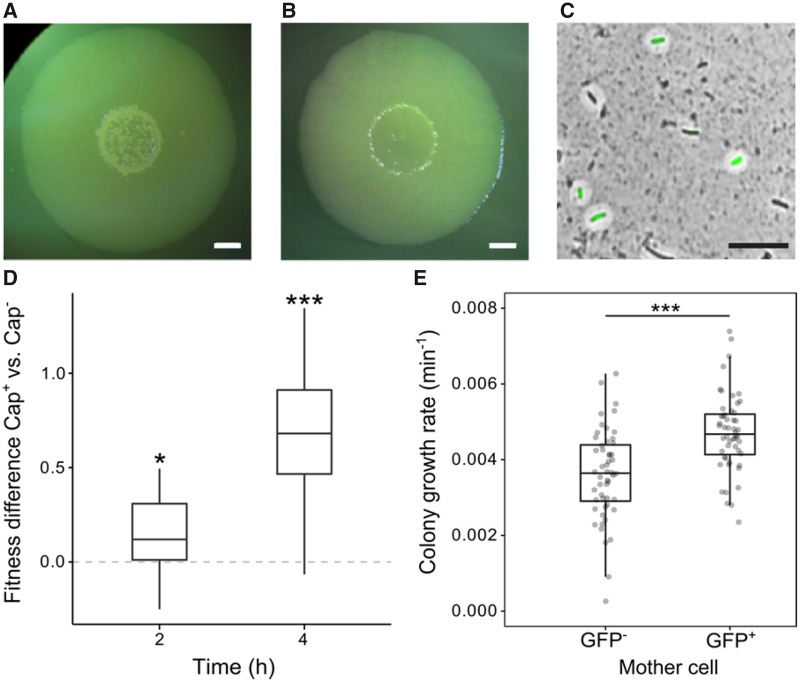
Observations of bacteria at the single-cell level have revealed many instances of phenotypic heterogeneity within otherwise clonal populations, but the selective causes, molecular bases, and broader ecological relevance remain poorly understood. In an earlier experiment in which the bacterium Pseudomonas fluorescens SBW25 was propagated under a selective regime that mimicked the host immune response, a genotype evolved that stochastically switched between capsulation states. The genetic cause was a mutation in carB that decreased the pyrimidine pool (and growth rate), lowering the activation threshold of a preexisting but hitherto unrecognized phenotypic switch. Genetic components surrounding bifurcation of UTP flux toward DNA/RNA or UDP-glucose (a precursor of colanic acid forming the capsules) were implicated as key components. Extending these molecular analyses-and based on a combination of genetics, transcriptomics, biochemistry, and mathematical modeling-we show that pyrimidine limitation triggers an increase in ribosome biosynthesis and that switching is caused by competition between ribosomes and CsrA/RsmA proteins for the mRNA transcript of a positively autoregulated activator of colanic acid biosynthesis. We additionally show that in the ancestral bacterium the switch is part of a program that determines stochastic entry into a semiquiescent capsulated state, ensures that such cells are provisioned with excess ribosomes, and enables provisioned cells to exit rapidly from stationary phase under permissive conditions.

Keywords: experimental evolution; genetics; microbiology; phenotypic heterogeneity.


Figures

<sc>Fig</sc>. 1.
Fig. 1.
Increased ribosome production in carB mutants. (A) Transcriptional induction of ribosomal protein genes in SBW25, 1A4, 1B4 Cap, and 1B4 Cap+ cells. Absolute expression levels of ribosomal protein genes (KEGG pathway “0310-Ribosomes,” n = 26) were extracted from a previous RNA-seq data set (Gallie et al. 2015) and normalized to SBW25. Boxplots represent the distribution of expression ratios. Bold segments inside rectangles show the median, lower and upper limits of the box represent first and third quartiles, respectively. Whiskers extend up to 1.5 times the interquartile range and dots represent outliers, if present. Letter groups indicate statistical significance, P <0.05, Kruskall–Wallis test with Dunn’s post hoc correction. (B) Expression kinetics of the PrrnB-GFP transcriptional reporter. Fluorescence in individual cells was measured by flow cytometry. Mean fluorescence of bacterial populations ± SD over biological replicates is shown, n = 4. Data are representative of three independent experiments. (C) Total RNA content in bacterial cells during exponential phase (OD600nm = 0.5–0.6). Values were normalized to SBW25 control within each experiment. Means ± SD are shown, n = 6. Data are pooled from four independent experiments. **P <0.01, two-tailed t-test.
<sc>Fig</sc>. 2.
Fig. 2.
Genetic bases of capsulation. (A) Capsulation in rrn deletion mutants. The Ppflu3655-GFP reporter was introduced in 1B4 bacteria and derived rrn mutants. Capsulation was measured by quantifying the proportion of GFP-positive cells by flow cytometry at the onset of stationary phase (OD600nm = 1–2). Means ± SEM are shown, n = 8 (1B4 ΔrrnB) or n = 11 (all other strains). Data are pooled from four independent experiments. **P <0.01, ***P <0.001, Kruskall–Wallis test with Dunn’s post hoc correction, comparison to 1B4. (B) Capsulation in gac/rsm mutants. Means ± SEM are shown, n = 12 (1B4), n = 15 (1B4 ΔgacA), or n = 9 (all other strains). Data are pooled from three independent experiments. *P <0.05, **P <0.001, ***P <0.001, Kruskall–Wallis test with Dunn’s post hoc correction, comparison to 1B4. (C) Model for capsulation in 1B4. See text for details.
<sc>Fig</sc>. 3.
Fig. 3.
PFLU3655 is required for capsulation. (A) Capsulation in SBW25, 1B4 Δpflu3655, and 1B4 strains carrying the pME6032-pflu3655 plasmid or the empty vector (EV) after induction with 1 mM IPTG. Phase-contrast microscopy images of bacterial suspensions counterstained with Indian ink. White halos around cells indicate capsulation. Scale bar = 10 µm. (B) PFLU3655 establishes a positive feedback loop. GFP fluorescence from the Ppflu3655-GFP reporter in SBW25 (left), 1B4 Δpflu3655 (middle), or 1B4 (right) cells carrying the pME6032-pflu3655 plasmid. pflu3655 expression was induced with IPTG at indicated concentration and fluorescence was measured by flow cytometry. Data are representative of three independent experiments (A, B).
<sc>Fig</sc>. 4.
Fig. 4.
RsmA/E binding sites in pflu3655 control capsulation. (A) Schematic diagram of pflu3655 5′-region. Two putative RsmA/E binding sites (orange squares) are located in the promoter and 5′-region of the gene. Numbers indicate nucleotide positions relative to start codon (not to scale). Sequences of putative RsmA/E binding sites are shown, the putative RBS is underlined. Gray box: Point mutations introduced in the different sequences by site-directed mutagenesis. (B) Expression of the Ppflu3655-GFP reporter carrying the different point mutations in the 1B4 background. GFP fluorescence was measured by flow cytometry. Data are representative of three independent experiments. (C, D) Mutations in putative RsmA/E binding sites affect capsulation in 1B4 (C) and SBW25 (D). Individual point mutations were reintroduced into 1B4 and SBW25 carrying the wild-type Ppflu3655-GFP reporter and the proportion of GFP positive cells in late exponential phase (OD600nm = 1–2) was measured by flow cytometry. Means ± SEM are shown, n = 9 (1B4) or n = 7 (SBW25). Data are pooled from three independent experiments. *P <0.05, **P <0.01, ***P <0.001, Kruskall–Wallis test with Dunn’s post hoc correction, comparison to 1B4. (E) Specific interaction between RsmA1 and pflu3655 mRNA. EMSA experiments were performed with 6.25 nM biotin-labelled oligonucleotides, either using a wild-type pflu3655 sequence (WT RNA; left) or a version carrying both G-8A and A33T point mutations (mut RNA; right). An increasing concentration of purified His6-RsmA1 (RsmA1) or a high concentration of proteins purified from SBW25 expressing a non-His6-tagged version of RsmA1 (Control protein) was added to the reactions.
<sc>Fig</sc>. 5.
Fig. 5.
A mathematical model of the capsulation regulatory network based on the experimental observations (see supplementary note, Supplementary Material online) explains the capsulation phenotype as the result of a bistable switch. Alternative states of transcription of pflu3655 are points (circles) where the net increase in mRNA production (production P(r) minus post-transcriptional binding T(r) of pflu3655; y axis), plotted against pflu3655 mRNA concentration (r; x axis), is null. Empty and filled circles indicate unstable and stable equilibria, respectively. Two qualitatively different scenarios are possible: (A) monostability of the Cap state (SBW25) and (B–D) bistability between Cap and Cap+ states (1B4 and its mutants). In the bistable cases, the position of the unstable equilibrium delimits the basins of attraction of the Cap (left) and Cap+ (right) states. Assuming that the transition between the two alternative states takes place due to stochastic processes at the molecular level, extension of the basin of attraction of either stable equilibrium can be taken as a proxy of the probability of observing cells in the corresponding state. The proportion of capsulated cells is thus expected to increase when either the basal mRNA production is enhanced (C), or RsmA/E binding efficiency is reduced (D). See supplementary note, Supplementary Material online, for details on parameter values used in the different panels.
<sc>Fig</sc>. 6.
Fig. 6.
Capsulation and growth in 1B4. (A) Initial growth rate after nutrient upshift is correlated with the proportion of capsulated cells in 1B4 populations. Data points are pooled from two independent experiments. n = 36, r2 = 0.91. Shaded area indicates 95% confidence interval. (B) Growth rate of microcolonies founded by Cap (GFP) or Cap+ (GFP+) cells measured by time-lapse microscopy. n = 97 (GFP) or n = 94 (GFP+). Data are pooled from seven independent experiments. ***P <0.001, two-tailed t-test.
<sc>Fig</sc>. 7.
Fig. 7.
Capsulation and growth in SBW25. SBW25 colony grown on KB agar plate (A) or KB agar plate supplemented with 2 mM uracil (B) for 7 days. Scale bar = 2 mm. (C) SBW25 cells carrying the Ppflu3655-GFP reporter and sampled from a 7-day-old colony were counterstained with Indian ink to detect the presence of CAP capsules. A GFP image is overlaid with the phase-contrast image. Scale bar = 10 µm. Images are representative of at least three independent experiments (A–C). (D) Competitive fitness difference between SBW25 Cap and Cap+ cells. Boxplot of the differences in Malthusian parameters between cultures enriched in Cap+ versus Cap cells is shown, n = 12. Data are pooled from two independent experiments. *P <0.05,***P <0.001, comparison to 0 with two-tailed t-test. (E) Initial growth rate of microcolonies founded by GFP or GFP+ cells measured by time-lapse microscopy. n = 65. Data are pooled from four independent experiments. ***P <0.001, Wilcoxon test.

Similar articles

Cited by

References

    1. Ackermann M. 2015. A functional perspective on phenotypic heterogeneity in microorganisms. Nat Rev Microbiol. 13(8): 497–508. - PubMed
    1. Balaban NQ, Merrin J, Chait R, Kowalik L, Leibler S.. 2004. Bacterial persistence as a phenotypic switch. Science 305(5690): 1622–1625. - PubMed
    1. Bao Y, Lies DP, Fu H, Roberts GP.. 1991. An improved Tn7-based system for the single-copy insertion of cloned genes into chromosomes of gram-negative bacteria. Gene 109(1): 167–168. - PubMed
    1. Beaumont HJE, Gallie J, Kost C, Ferguson GC, Rainey PB.. 2009. Experimental evolution of bet hedging. Nature 462(7269): 90–93. - PubMed
    1. Blank D, Wolf L, Ackermann M, Silander OK.. 2014. The predictability of molecular evolution during functional innovation. Proc Natl Acad Sci U S A. 111(8): 3044–3049. - PMC - PubMed

Publication types