. 2019 Jun 1;316(6):E1118-E1135.
doi: 10.1152/ajpendo.00496.2018. Epub 2019 Mar 5.

Energy metabolism couples hepatocyte integrin-linked kinase to liver glucoregulation and postabsorptive responses of mice in an age-dependent manner

Affiliations

Energy metabolism couples hepatocyte integrin-linked kinase to liver glucoregulation and postabsorptive responses of mice in an age-dependent manner

Elijah Trefts et al. Am J Physiol Endocrinol Metab. .

Abstract

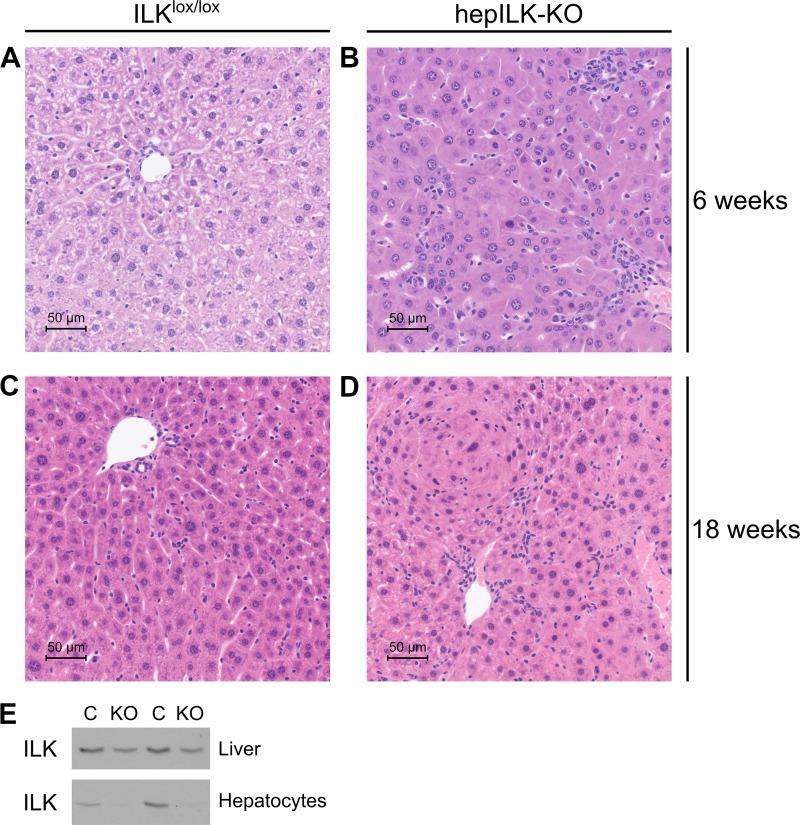
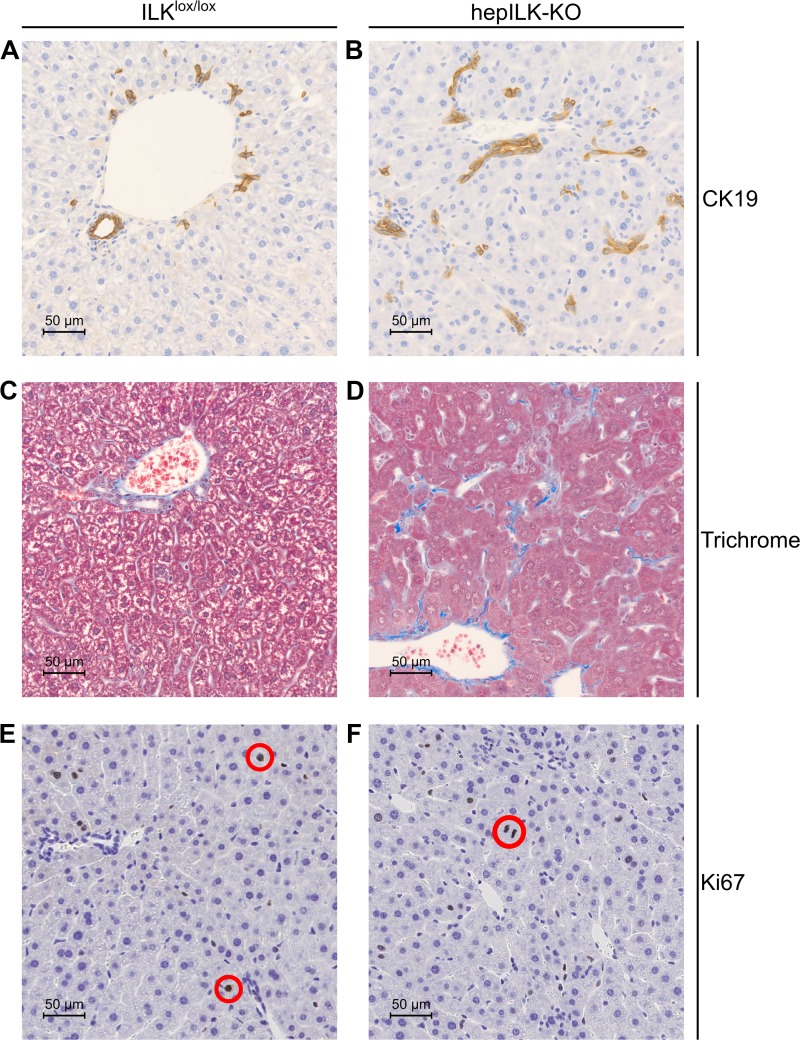
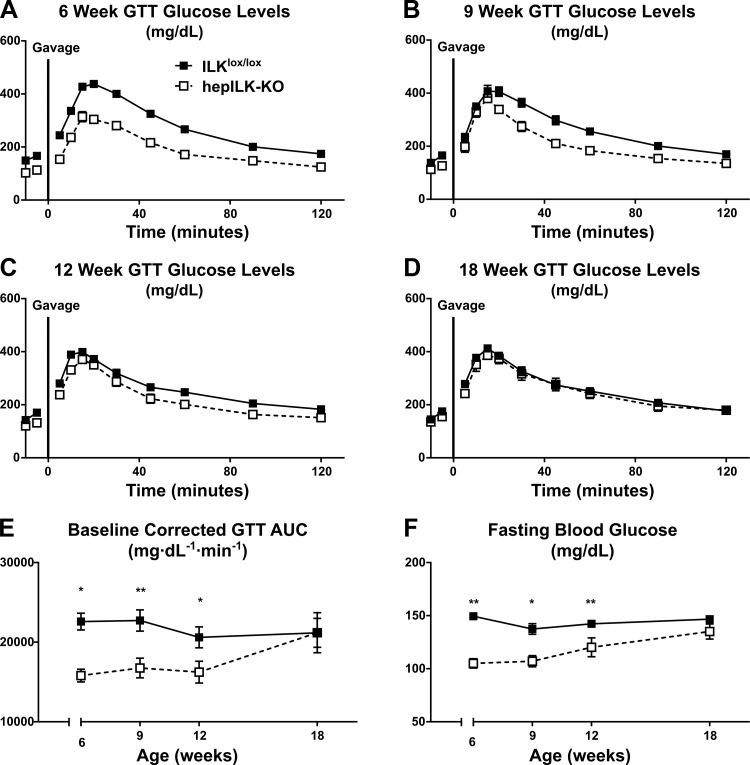
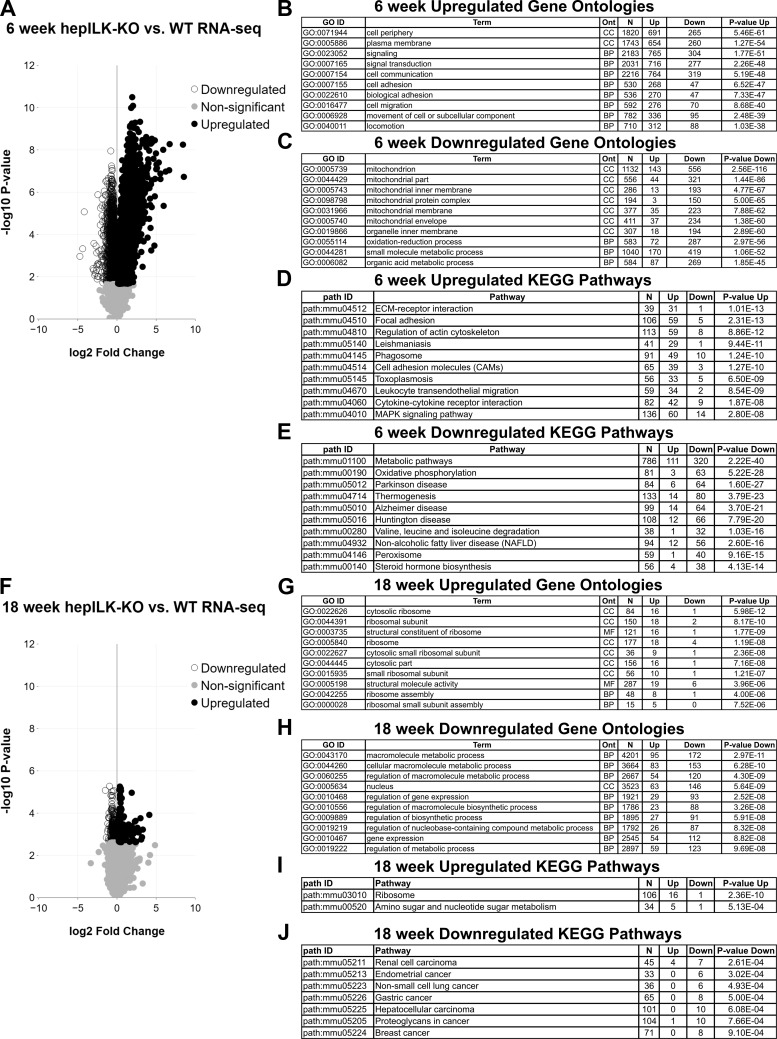
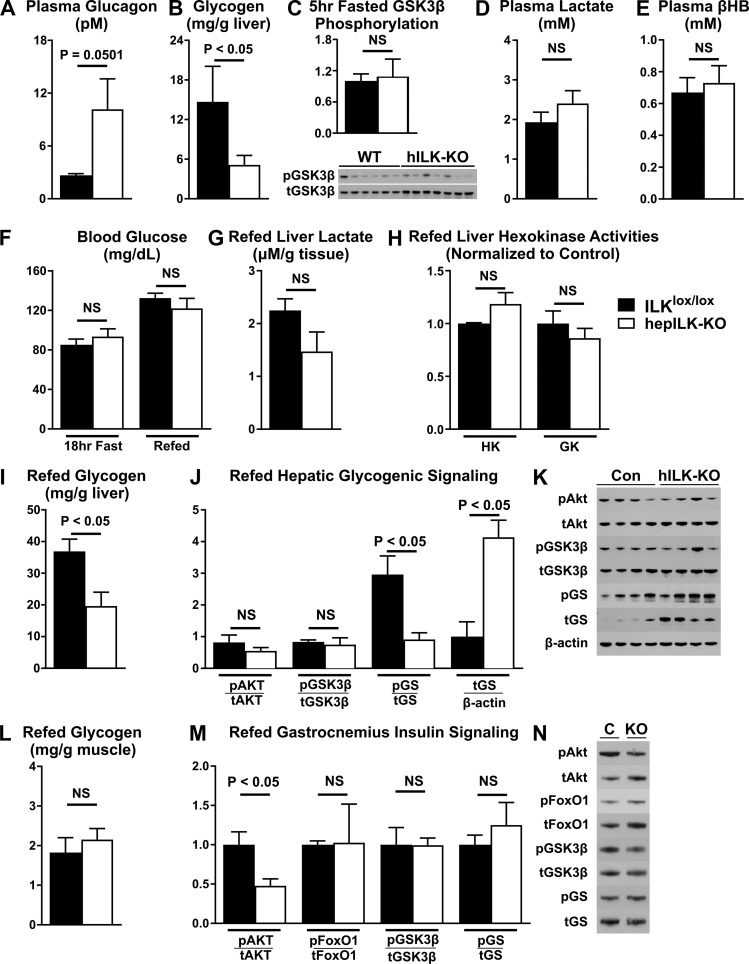
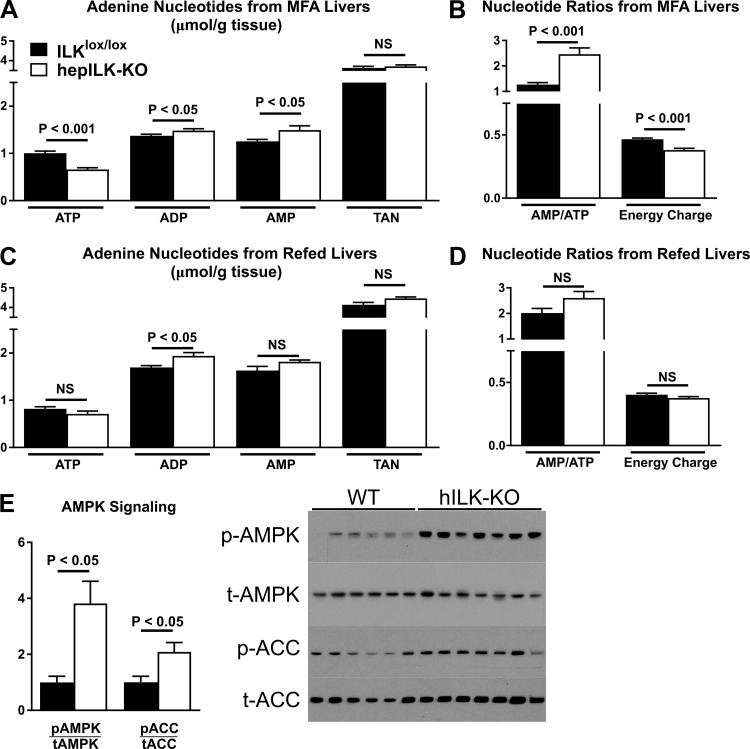
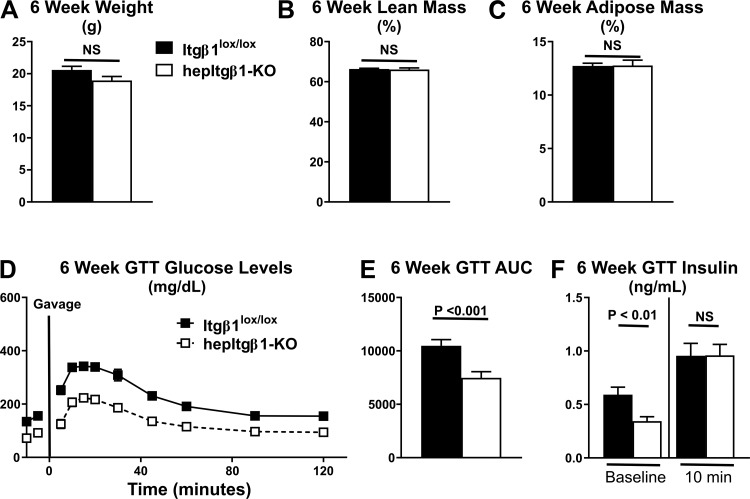
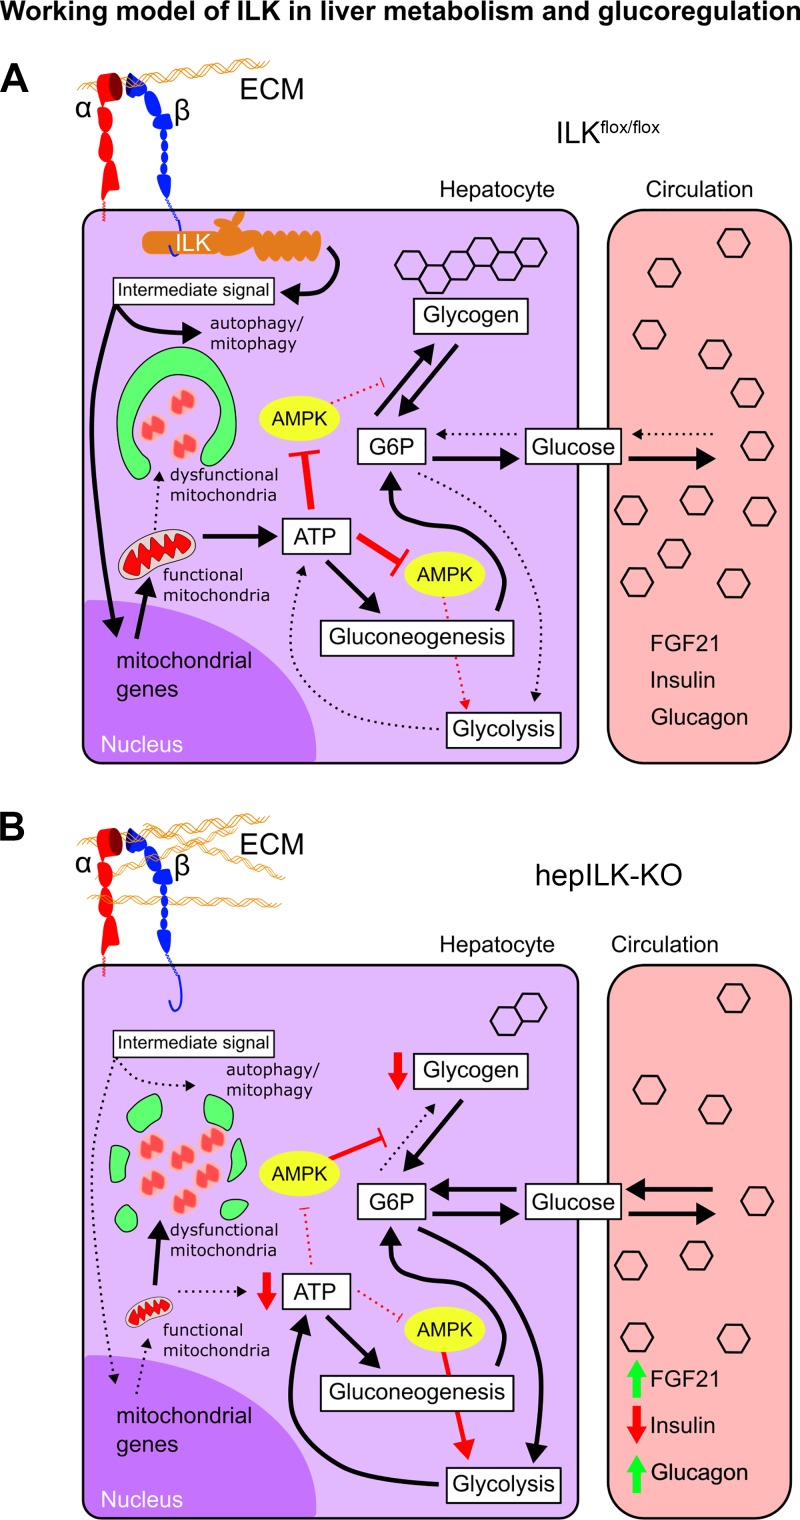
Integrin-linked kinase (ILK) is a critical intracellular signaling node for integrin receptors. Its role in liver development is complex, as ILK deletion at E10.5 (before hepatocyte differentiation) results in biochemical and morphological differences that resolve as mice age. Nevertheless, mice with ILK depleted specifically in hepatocytes are protected from the hepatic insulin resistance during obesity. Despite the potential importance of hepatocyte ILK to metabolic health, it is unknown how ILK controls hepatic metabolism or glucoregulation. The present study tested the role of ILK in hepatic metabolism and glucoregulation by deleting it specifically in hepatocytes, using a cre-lox system that begins expression at E15.5 (after initiation of hepatocyte differentiation). These mice develop the most severe morphological and glucoregulatory abnormalities at 6 wk, but these gradually resolve with age. After identifying when the deletion of ILK caused a severe metabolic phenotype, in depth studies were performed at this time point to define the metabolic programs that coordinate control of glucoregulation that are regulated by ILK. We show that 6-wk-old ILK-deficient mice have higher glucose tolerance and decreased net glycogen synthesis. Additionally, ILK was shown to be necessary for transcription of mitochondrial-related genes, oxidative metabolism, and maintenance of cellular energy status. Thus, ILK is required for maintaining hepatic transcriptional and metabolic programs that sustain oxidative metabolism, which are required for hepatic maintenance of glucose homeostasis.

Keywords: glucose homeostasis; glycogen metabolism; hepatocyte signaling; in vivo physiology; integrin signaling; liver metabolism.


Figures

Fig. 1.
Fig. 1.
A: representative image of hematoxylin and eosin (H & E)-stained liver section at ×40 magnification from 6-wk-old integrin-linked kinase (ILK)lox/lox mice. B: representative image of H & E-stained liver section at ×40 magnification from 6-wk-old hepILK-knockout (KO) mice. C: representative image of H & E-stained liver section at ×40 magnification from 18-wk-old ILKlox/lox mice. D: representative image of H & E-stained liver section at ×40 magnification from 18-wk-old hepILK-KO mice. E: Western blots of ILK protein content in cells from whole liver and enriched for hepatocytes from ILKlox/lox [control (C); n = 2] or hepILK-KO (n = 2) mice at 24 wk of age.
Fig. 2.
Fig. 2.
A: representative image of immunohistochemical (IHC) staining for CK19 in liver section at ×40 magnification from 6-wk-old integrin-linked kinase (ILK)lox/lox mice. B: representative image of IHC staining for CK19 in liver section at ×40 magnification from 6-wk-old hepILK-knockout (KO) mice. C: representative image of Masson’s trichrome staining in liver section at ×40 magnification from 6-wk-old ILKlox/lox mice. D: representative image of Masson’s trichrome staining in liver section at ×40 magnification from 6-wk-old hepILK-KO mice. E: representative image of IHC staining for Ki-67 in liver section at ×40 magnification from 6-wk-old ILKlox/lox mice. F: representative image of IHC staining for Ki-67 in liver section at ×40 magnification from 6-wk-old hepILK-KO mice. Red circles denote nuclei stained positively for Ki-67 in E and F.
Fig. 3.
Fig. 3.
A: blood glucose levels of 6-wk-old integrin-linked kinase (ILK)lox/lox (n = 30) and hepILK-knockout (KO) (n = 20) mice during oral glucose tolerance tests (GTT). B: blood glucose levels of 9-wk-old ILKlox/lox (n = 17) and hepILK- KO (n = 7) mice during oral GTT. C: blood glucose levels of 12-wk-old ILKlox/lox (n = 15) and hepILK- KO (n = 10) mice during oral GTT. D: blood glucose levels of 18-wk-old ILKlox/lox (n = 15) and hepILK-KO (n = 7) mice during oral GTT. E: baseline corrected area under the glucose curves (AUC) in AD. F: fasting blood glucose concentrations in AD. Data are means ± SE *P < 0.05; **P < 0.01.
Fig. 4.
Fig. 4.
A: volcano plot of genes obtained from RNA sequencing (RNA-seq) of whole livers from 6-wk-old, 5-h-fasted integrin-linked kinase (ILK)lox/lox (n = 5) and hepILK-knockout (KO) (n = 5) mice. ○, Genes significantly decreased in hepILK-KO livers; ●, genes significantly increased in hepILK-KO livers. Gray circles, genes that were nonsignificantly altered in hepILK-KO livers. B: 10 Gene Ontology terms with highest P values for representation of significantly increased genes in 6-wk-old, 5-h-fasted hepILK-KO livers. C: 10 Gene Ontology terms with highest P values for representation of significantly decreased genes in 6-wk-old, 5-h-fasted hepILK-KO livers. D: 10 KEGG pathways with highest P values for representation of significantly decreased genes in 6-wk-old, 5-h-fasted hepILK-KO livers. E: 10 KEGG pathways with highest P values for representation of significantly increased genes in 6-wk-old, 5-h-fasted hepILK-KO livers. F: volcano plot of genes obtained from RNA-seq of whole livers from 18-wk-old, 5-h-fasted ILKlox/lox (n = 5) and hepILK-KO (n = 5) mice. Circles are as indicated above. G: 10 Gene Ontology terms with highest P values for representation of significantly increased genes in 18-wk-old, 5-h-fasted hepILK-KO livers. H: 10 Gene Ontology terms with highest P values for representation of significantly decreased genes in 18-wk-old, 5-h-fasted hepILK-KO livers. I: KEGG pathways with P < 0.001 for representation of significantly increased genes in 18-wk-old, 5-h-fasted hepILK-KO livers. J: KEGG pathways with P < 0.001 for representation of significantly decreased genes in 18-wk-old, 5-h-fasted hepILK-KO livers. WT, wild type.
Fig. 5.
Fig. 5.
A: total triglyceride content of livers from 5-h-fasted, 6-wk-old integrin-linked kinase (ILK)lox/lox (n = 7) and hepILK-knockout (KO) (n = 8) mice. B: quantification of triglyceride side chain species from A. C: total diglyceride content of livers from 5-h-fasted, 6-wk-old ILKlox/lox (n = 7) and hepILK-KO (n = 8) mice. D: quantification of diglyceride side chain species from D. E: total cholesterol content of livers from 5-h-fasted, 6-wk-old ILKlox/lox (n = 7) and hepILK-KO (n = 8) mice. F: concentration of nonesterified fatty acids (NEFA) in plasma samples taken at t = 100 during metabolic flux analysis (MFA) studies of 6-wk-old ILKlox/lox (n = 8) and hepILK-KO (n = 7) mice. G: concentration of higher level plasma amino acids and related metabolites in plasma samples taken at t = 120 during MFA studies of 6-wk-old ILKlox/lox (n = 8) and hepILK-KO (n = 7) mice. H: concentration of lower level plasma amino acids and related metabolites in plasma samples taken at t = 120 during MFA studies of 6-wk-old ILKlox/lox (n = 8) and hepILK-KO (n = 7) mice. All amino acids are depicted with standard 3-letter abbreviations. The remaining metabolites are as follows: γ-AA, γ-aminobutyric acid; Citru, citrulline; 1-mHis, 1-methyl-histidine; Orn, ornithine; PE, phosphoethanolamine; Taur, taurine. Data are means ± SE. *P < 0.05. ND, not detectable; NS, not significant.
Fig. 6.
Fig. 6.
A: respiration of hepatocytes isolated from integrin-linked kinase (ILK)lox/lox (n = 6) or hepILK-knockout (KO) (n = 7) in basal media (routine), in the presence of oligomycin (leak), and in the presence of FCCP [electron transfer system (ETS)]. B: ratios of respiration rates in the 3 conditions represented in A. C: quantification of voltage-dependent anion channel (VDAC) and mitochondrial complex protein levels relative to Ponceau total protein stain from samples used in A. D: representative images of VDAC, mitochondrial complexes, and Ponceau total protein stain in C. E: gene expression of optic atrophy 1 (opa1), dynamin 1 like protein (dnm1l), and mitofusin 2 (mfn2) in samples used in A. GAPDH was used as a control (C) gene. F: quantification of p62 and Bnip3 protein relative to Ponceau total protein stain in livers of ILKlox/lox (n = 8) and hepILK-KO (n = 7), which underwent metabolic flux analysis. G: representative Western blots of p62 and Bnip3 protein as well as Ponceau staining quantified in F. Data are means ± SE. NS, not significant.
Fig. 7.
Fig. 7.
A: average 24-h energy expenditure (EE) of integrin-linked kinase (ILK)lox/lox (n = 8) and hepILK-knockout (KO) (n = 7) mice measured over a 7-day period. B: EE during 12-h light and dark phase, ILKlox/lox (n = 8), and hepILK-KO (n = 7). C: 24-h energy intake (EI) of ILKlox/lox (n = 8) and hepILK-KO (n = 7) mice. D: EI during 12-h light and dark phase, ILKlox/lox (n = 8), and hepILK-KO (n = 7). E: 24-h energy balance (EB = EI − EE) in (ILKlox/lox (n = 8) and hepILK-KO (n = 7) mice. F: average no. of meals/day during the light and dark phase, ILKlox/lox (n = 8), and hepILK-KO (n = 7). Twenty-four-hour EI of ILKlox/lox (n = 8) and hepILK-KO (n = 7) mice. G: average time of each meal period during the light and dark phase, ILKlox/lox (n = 8), and hepILK-KO (n = 7). H: average respiratory quotient during 12-h light and dark phase, ILKlox/lox (n = 8), and hepILK-KO (n = 7). I: average 24 h movement of ILKlox/lox (n = 8) and hepILK-KO (n = 7) mice measured over a 7-day period. J: movement during 12-h light and dark phase, ILKlox/lox (n = 8), and hepILK-KO (n = 7). K: concentration of fibroblast growth factor 21 (FGF21) in plasma from ILKlox/lox (n = 5) and hepILK-KO mice (n = 7) after a 5-h fast. L: gene expression of FGF21 from livers of ILKlox/lox (n = 6) and hepILK-KO (n = 7) mice after a 5-h fast. GAPDH was used as the control gene. Data are means ± SE.
Fig. 8.
Fig. 8.
A: Graphic model of metabolic fluxes contributing to hepatic glucose output obtained from metabolic flux analysis (MFA). B: average blood glucose concentration during steady state of MFA for integrin-linked kinase (ILK)lox/lox (n = 8) and hepILK-knockout (KO) (n = 7) mice. C: rates of fluxes contributing to hepatic glucose production in ILKlox/lox (n = 8) and hepILK-KO (n = 7) mice modeled by MFA. D: fractional turnover of the circulating glucose pool determined by dividing VEGP by the blood glucose concentration at each time point during MFA in ILKlox/lox (n = 8) and hepILK-KO (n = 7) mice. E: rates of fluxes contributing to hepatic glucose production as well as the TCA cycling in ILKlox/lox (n = 8) and hepILK-KO (n = 7) mice modeled by MFA. F: gene expression of gluconeogenic genes [glucose-6-phosphatase catalytic subunit (G6PC) and phosphoenolpyruvate carboxykinase 1 (PEPCK)] from livers of ILKlox/lox (n = 8) and hepILK-KO (n = 7) mice after undergoing MFA. GAPDH was used as the control gene. Data are means ± SE. NS, not significant. Metabolic fluxes from MFA analysis are denoted as a V followed by a subscript shorthand for the metabolic flux or enzyme process described: VALDO, flux from dihydroxyacetone phosphate and glyceraldhyde-3-phosphate; VCS, flux from oxaloacetate and acetyl-coA to citrate; VEGP, endogenous glucose production; VEnol, flux from phosphoenolpyruvate to 1,3-bisphosphoglycerate; VGK, flux from glycerol to dihydroxyacetone phosphate; VLDH, unlabeled nonphosphoenolpyruvate-derived sources of anaplerosis to pyruvate; VPC, flux from pyruvate to oxaloacetate, VPCC, flux from propionyl-CoA to succinyl-CoA, VPCK, flux from oxaloacetate to phosphoenolpyruvate; VPK + ME, contribution of pyruvate kinase (PK) and malic enzyme (ME) to pyruvate; VPYGL, flux from glycogen to glucose-6-phosphate; VSDH, flux from succinyl-CoA to oxaloacetate.
Fig. 9.
Fig. 9.
A: plasma glucagon concentrations in integrin-linked kinase (ILK)lox/lox (n = 7) and hepILK-knockout (KO) (n = 9) mice during metabolic flux analysis experiments. B: hepatic glycogen content of ILKlox/lox (n = 6) and hepILK-KO (n = 6) mice after a 5-h fast. C: quantification of the ratio of GSK3β phosphorylated at Ser9 (p-GSK3β) to total GSK3β (t-GSK3β) protein in livers of ILKlox/lox (n = 6) and hepILK-KO (n = 7) mice after a 5-h fast. D: plasma lactate concentration of ILKlox/lox (n = 5) and hepILK-KO (n = 5) mice after a 5-h fast. E: plasma β-hydroxybutyrate concentration of ILKlox/lox (n = 5) and hepILK-KO (n = 5) mice after a 5-h fast. F: blood glucose concentration of ILKlox/lox (n = 4) and hepILK-KO (n = 4) mice after an 18-h fast and after 6 h of ad libitum food access following the 18-h fast. G: liver lactate content of ILKlox/lox (n = 4) and hepILK-KO (n = 4) mice following the 6-h refeeding period. H) Enzymatic activities of glucokinase (GK) and all other hexokinases (HK) in livers of ILKlox/lox (n = 4) and hepILK-KO (n = 4) mice following the 6-h refeed period. I: hepatic glycogen content of ILKlox/lox (n = 4) and hepILK-KO (n = 4) mice following the 6-h refeeding period. J: quantification of densitometric ratios for designated phosphorylated (p) and total (t) proteins (K). Ratio of total glycogen synthase (t-GS) protein to β-actin is also shown. K: images of blots for Akt phosphorylated at Ser473 (p-Akt) total Akt (t-Akt), p-GSK3β, t-GSK3β, glycogen synthase (GS) phosphorylated (p-GS) at Ser641, total GS (t-GS), and β-actin in livers from ILKlox/lox (n = 4) and hepILK-KO (n = 4) mice following the 6-h refeeding period. L: gastrocnemius muscle glycogen content of ILKlox/lox (n = 4) and hepILK-KO (n = 4) mice following the 6-h refeeding period. M: quantification of densitometric ratios for designated phosphorylated and total proteins (N). N: representative images of blots for Akt phosphorylated at Ser473 (p-Akt), total Akt (t-Akt), FoxO1 phosphorylated at Ser256 (p-FoxO1) total FoxO1 (t-FoxO1), p-GSK3β, t-GSK3β, p-GS, and t-GS in livers from ILKlox/lox (n = 3) and hepILK-KO (n = 4) mice following the 6-h refeeding period. Data are means ± SE.
Fig. 10.
Fig. 10.
A: adenine nucleotide levels (ATP, ADP, and AMP) in livers from integrin-linked kinase (ILK)lox/lox (n = 8) and hepILK-KO (n = 9) mice, which underwent metabolic flux analysis (MFA). B: total adenine nucleotide (TAN) levels (sum of ATP, ADP, and AMP levels) in livers from ILKlox/lox (n = 8) and hepILK-KO (n = 9) mice, which underwent MFA. Ratio of AMP to ATP and calculated energy charge from the same liver samples. C: adenine nucleotide levels (ATP, ADP, and AMP) in livers from ILKlox/lox (n = 4) and hepILK-KO (n = 4) mice, which underwent 18-h fast and 6-h refeed. D: TAN levels (sum of ATP, ADP, and AMP levels) in livers from ILKlox/lox (n = 4) and hepILK-KO (n = 4) mice, which underwent 18-h fast and 6-h refeed. Ratio of AMP to ATP and calculated energy charge from the same liver samples. E: quantification of AMPK phosphorylated at Thr172 (p-AMPK) and ACC phosphorylated at Ser79 (p-ACC) relative to their respective total proteins (t-AMPK and t-ACC) from livers of 5-h-fasted ILKlox/lox (n = 6) and hepILK-KO (n = 7). Data are means ± SE.
Fig. 11.
Fig. 11.
A: body weight of Itgβ1lox/lox (n = 17) and hepItgβ1-knockout (KO) (n = 14) mice at 6 wk of age. B: lean mass body composition of Itgβ1lox/lox (n = 17) and hepItgβ1-KO (n = 14) mice at 6 wk of age. C: adipose mass body composition of Itgβ1lox/lox (n = 17) and hepItgβ1-KO (n = 14) mice at 6 wk of age. D: blood glucose levels of 6-wk-old Itgβ1lox/lox (n = 17) and hepItgβ1-KO (n = 14) mice during oral glucose tolerance tests (GTT). E: baseline corrected area under the glucose curves (AUC) of 6-wk-old Itgβ1lox/lox (n = 17) and hepItgβ1-KO (n = 14) mice during oral GTT. F: plasma insulin concentrations of 6-wk-old Itgβ1lox/lox (baseline; n = 17, 10 min; n = 17) and hepItgβ1-KO (baseline; n = 11, 10 min; n = 13) mice during oral GTT. Data are means ± SE. NS, not significant.
Fig. 12.
Fig. 12.
A: proposed model of extracellular matrix (ECM)-integrin-integrin-linked kinase (ILK) signaling and contributions to hepatic metabolism and glucoregulatory functions. B: model of altered hepatocyte metabolism and glucoregulatory functions upon disruption of integrin signaling via hepILK-knockout (KO). FGF21, fibroblast growth factor 21.

Similar articles

Cited by

References

    1. Afgan E, Baker D, Batut B, van den Beek M, Bouvier D, Cech M, Chilton J, Clements D, Coraor N, Grüning BA, Guerler A, Hillman-Jackson J, Hiltemann S, Jalili V, Rasche H, Soranzo N, Goecks J, Taylor J, Nekrutenko A, Blankenberg D. The Galaxy platform for accessible, reproducible and collaborative biomedical analyses: 2018 update. Nucleic Acids Res 46: W537–W544, 2018. doi:10.1093/nar/gky379. - DOI - PMC - PubMed
    1. Anders S, Pyl PT, Huber W. HTSeq—a Python framework to work with high-throughput sequencing data. Bioinformatics 31: 166–169, 2015. doi:10.1093/bioinformatics/btu638. - DOI - PMC - PubMed
    1. Apte U, Gkretsi V, Bowen WC, Mars WM, Luo JH, Donthamsetty S, Orr A, Monga SPS, Wu C, Michalopoulos GK. Enhanced liver regeneration following changes induced by hepatocyte-specific genetic ablation of integrin-linked kinase. Hepatology 50: 844–851, 2009. doi:10.1002/hep.23059. - DOI - PMC - PubMed
    1. Ayala JE, Bracy DP, Malabanan C, James FD, Ansari T, Fueger PT, McGuinness OP, Wasserman DH. Hyperinsulinemic-euglycemic clamps in conscious, unrestrained mice. J Vis Exp: 3188, 2011. doi:10.3791/3188. - DOI - PMC - PubMed
    1. Ayala JE, Bracy DP, McGuinness OP, Wasserman DH. Considerations in the design of hyperinsulinemic-euglycemic clamps in the conscious mouse Diabetes 55: 390–397, 2006. doi:10.2337/diabetes.55.02.06.db05-0686. - DOI - PubMed

Publication types

MeSH terms

LinkOut - more resources