

Variations in reproductive events across life: a pooled analysis of data from 505 147 women across 10 countries
- PMID: 30835788
- PMCID: PMC7571491
- DOI: 10.1093/humrep/dez015
Variations in reproductive events across life: a pooled analysis of data from 505 147 women across 10 countries
Abstract
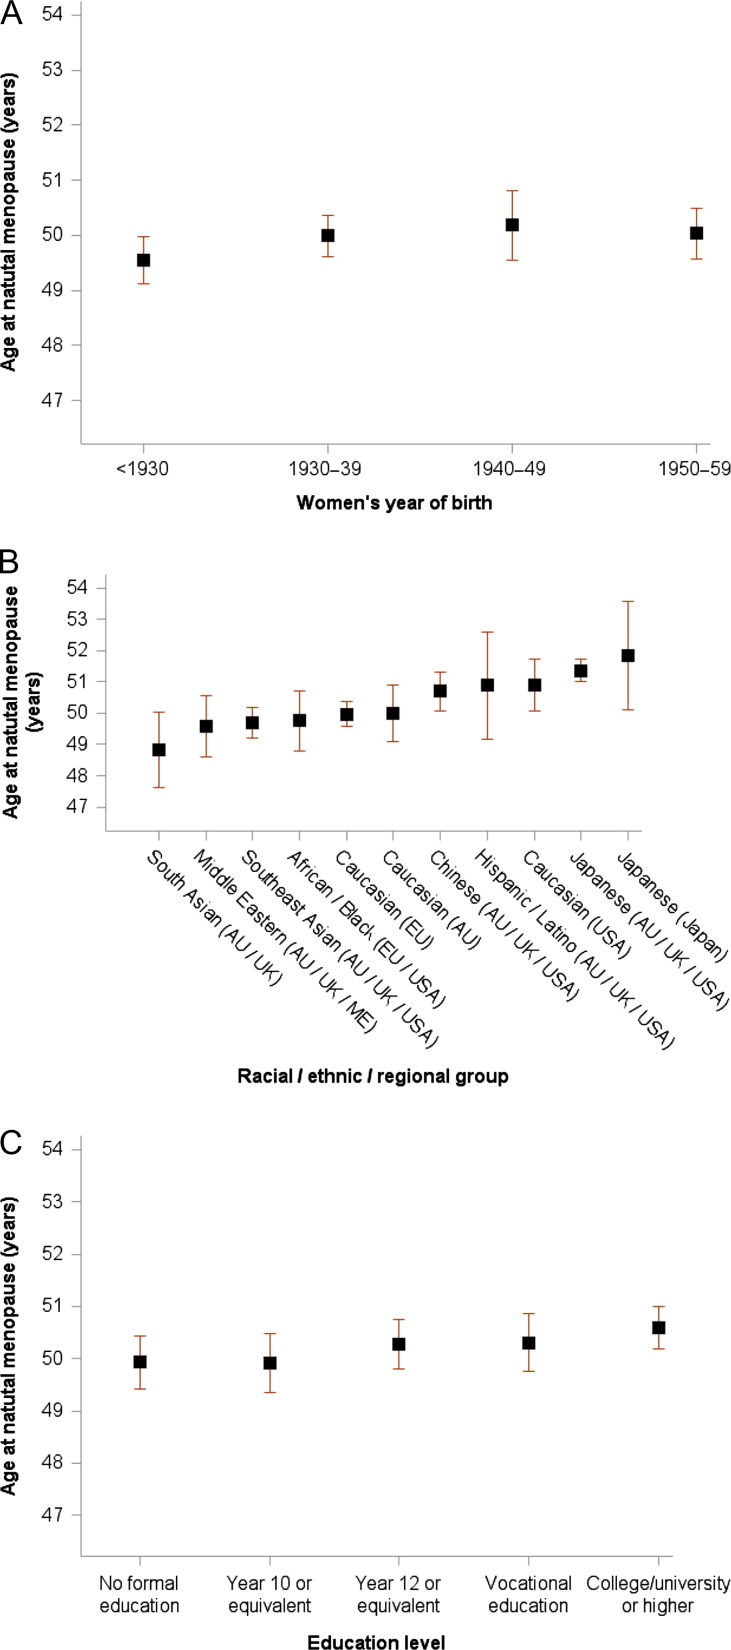
Study question: How has the timing of women's reproductive events (including ages at menarche, first birth, and natural menopause, and the number of children) changed across birth years, racial/ethnic groups and educational levels?
Summary answer: Women who were born in recent generations (1970-84 vs before 1930) or those who with higher education levels had menarche a year earlier, experienced a higher prevalence of nulliparity and had their first child at a later age.
What is known already: The timing of key reproductive events, such as menarche and menopause, is not only indicative of current health status but is linked to the risk of adverse hormone-related health outcomes in later life. Variations of reproductive indices across different birth years, race/ethnicity and socioeconomic positions have not been described comprehensively.
Study design, size, duration: Individual-level data from 23 observational studies that contributed to the International Collaboration for a Life Course Approach to Reproductive Health and Chronic Disease Events (InterLACE) consortium were included.
Participants/materials, setting, methods: Altogether 505 147 women were included. Overall estimates for reproductive indices were obtained using a two-stage process: individual-level data from each study were analysed separately using generalised linear models. These estimates were then combined using random-effects meta-analyses.
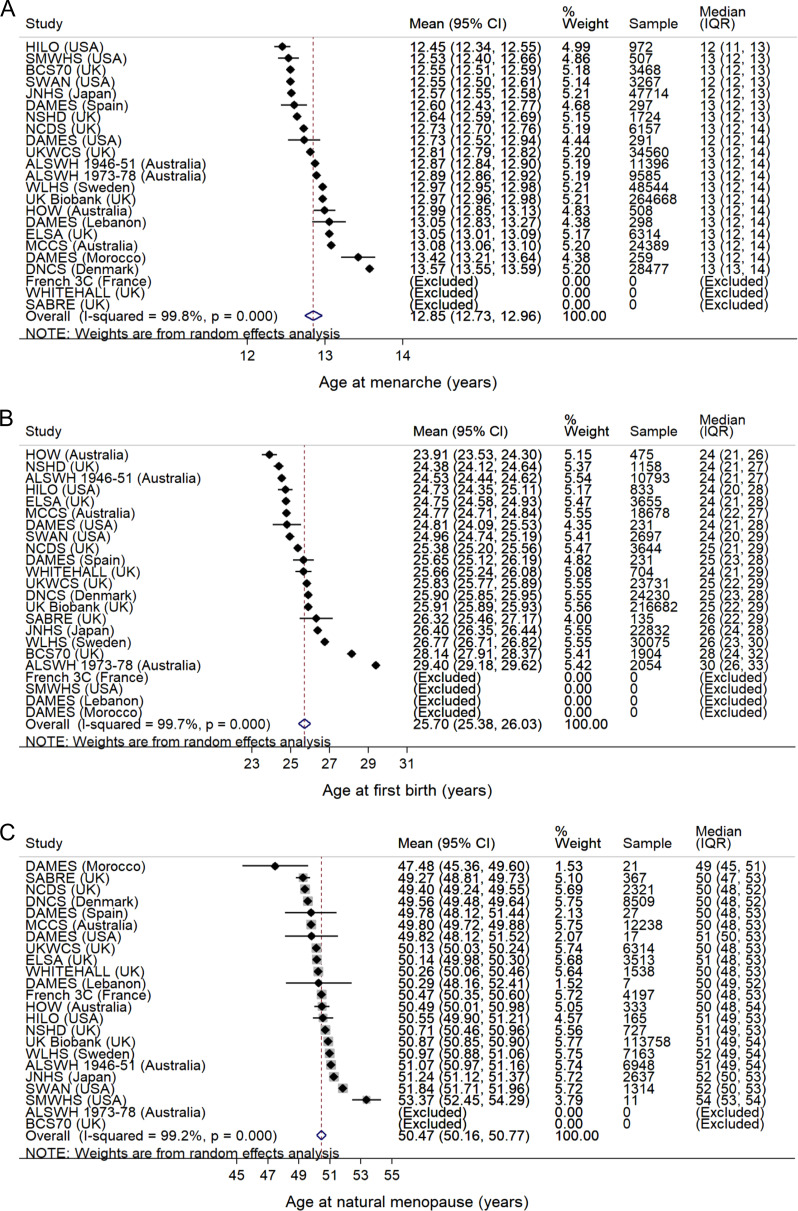
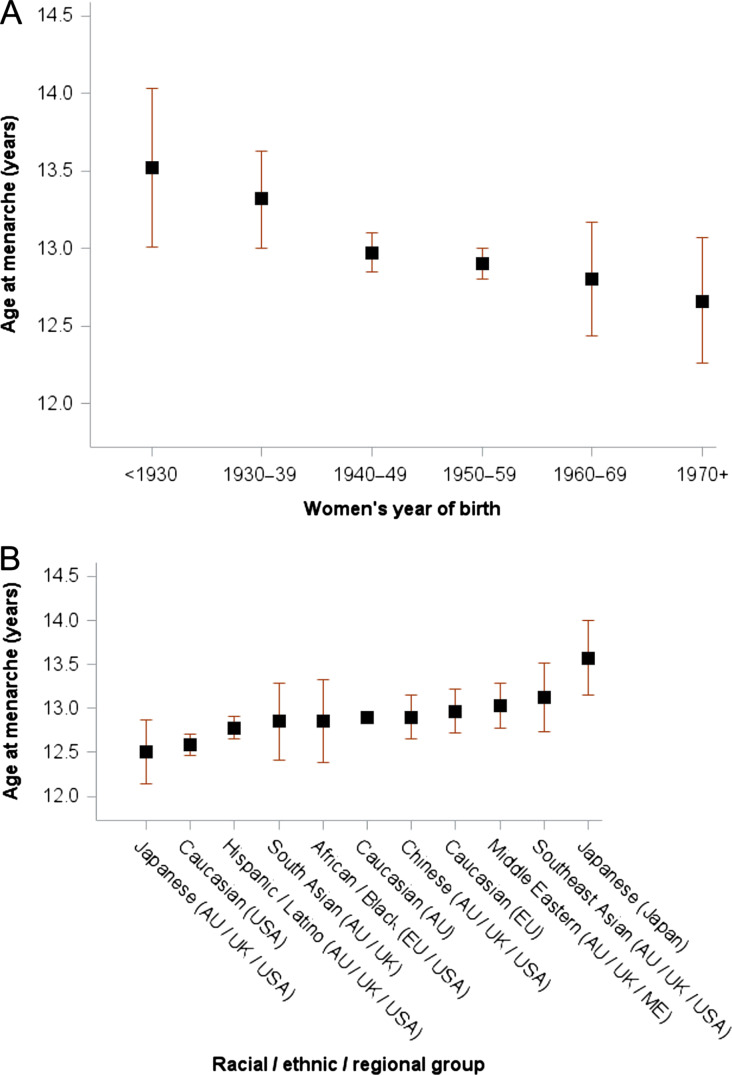
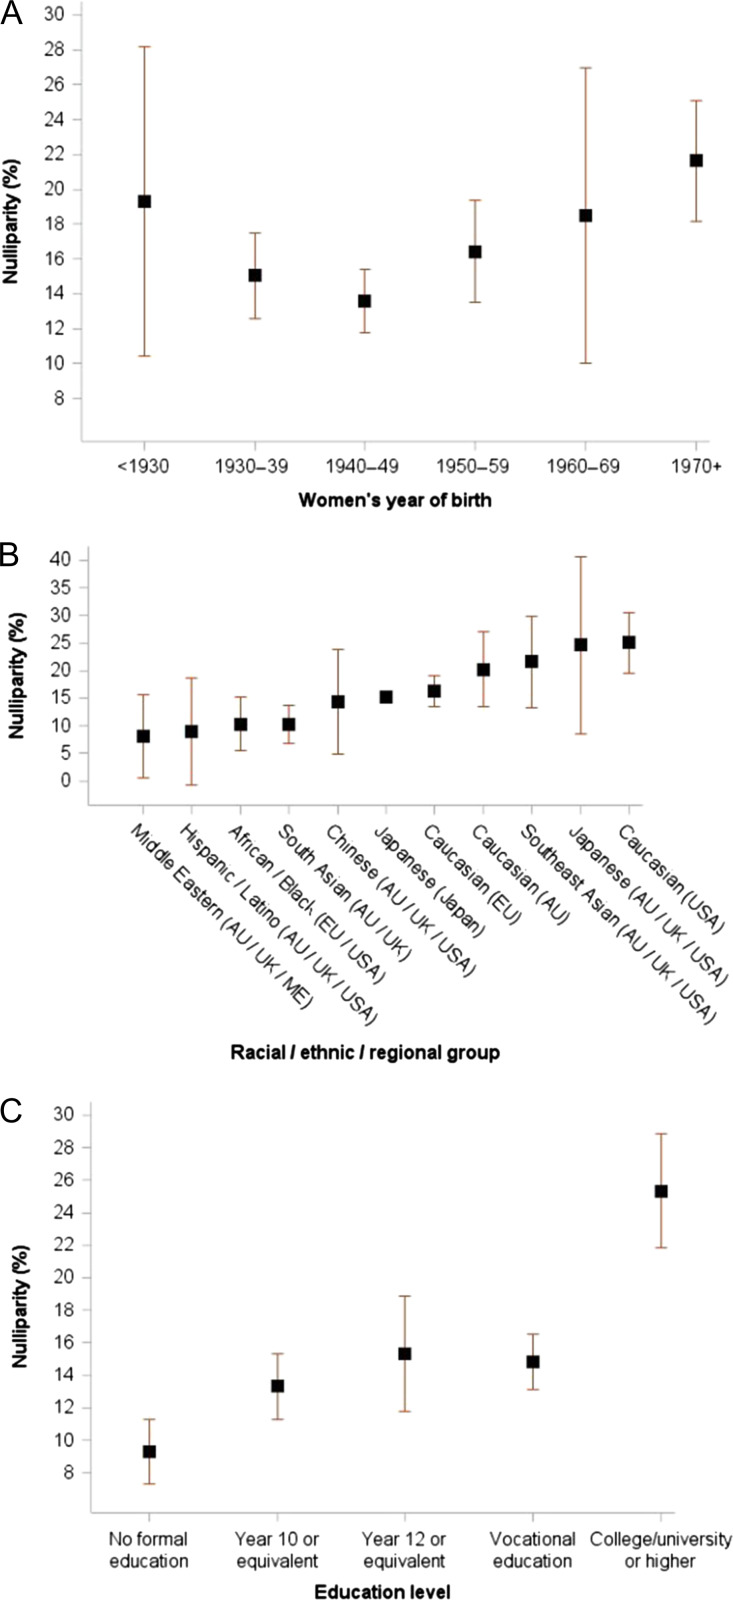
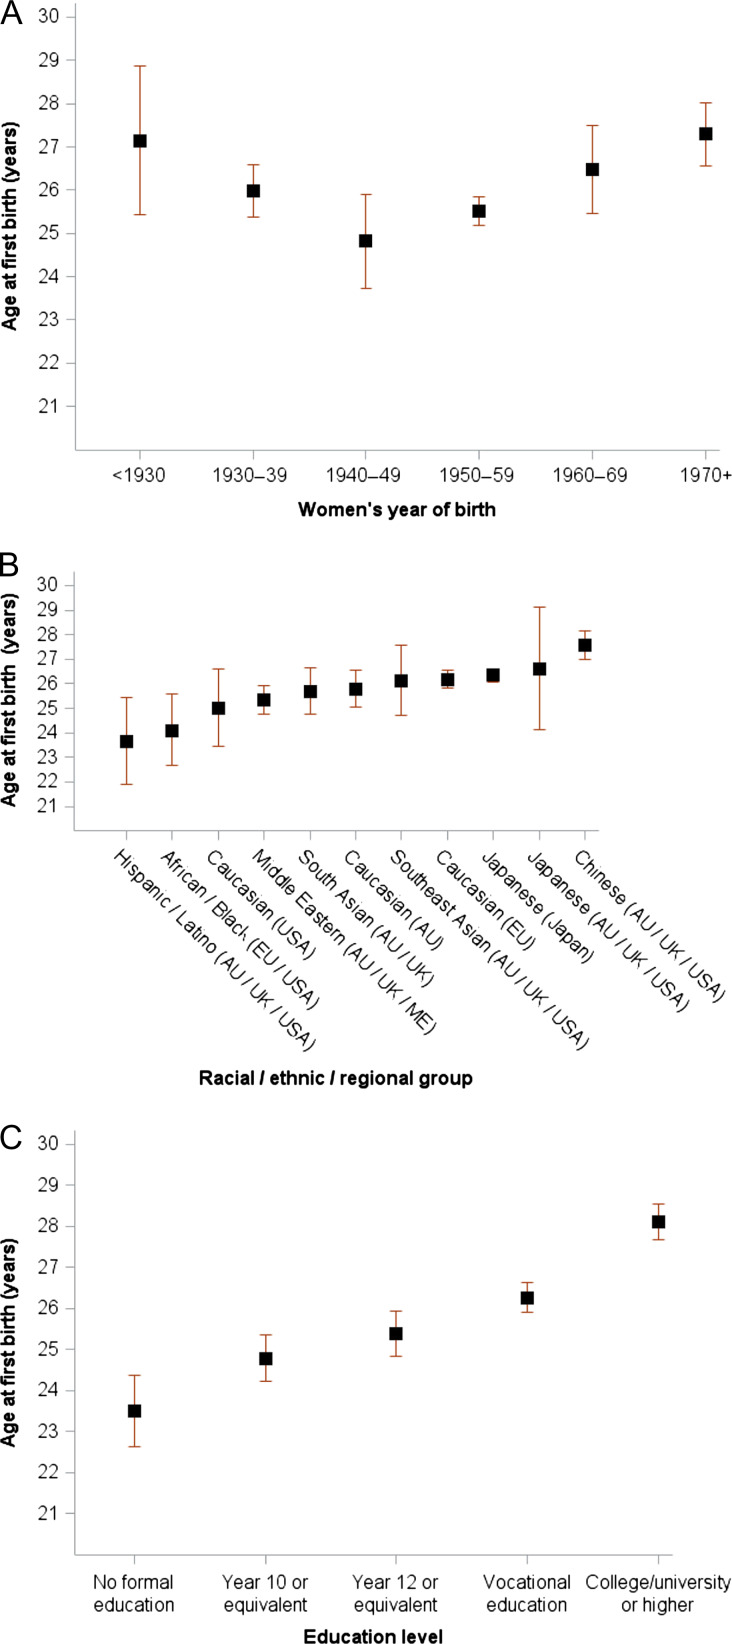
Main results and the role of chance: Mean ages were 12.9 years at menarche, 25.7 years at first birth, and 50.5 years at natural menopause, with significant between-study heterogeneity (I2 > 99%). A linear trend was observed across birth year for mean age at menarche, with women born from 1970 to 1984 having menarche one year earlier (12.6 years) than women born before 1930 (13.5 years) (P for trend = 0.0014). The prevalence of nulliparity rose progressively from 14% of women born from 1940-49 to 22% of women born 1970-84 (P = 0.003); similarly, the mean age at first birth rose from 24.8 to 27.3 years (P = 0.0016). Women with higher education levels had fewer children, later first birth, and later menopause than women with lower education levels. After adjusting for birth year and education level, substantial variation was present for all reproductive events across racial/ethnic/regional groups (all P values < 0.005).
Limitations, reasons for caution: Variations of study design, data collection methods, and sample selection across studies, as well as retrospectively reported age at menarche, age at first birth may cause some bias.
Wider implications of the findings: This global consortium study found robust evidence on variations in reproductive indices for women born in the 20th century that appear to have both biological and social origins.
Study funding/competing interest(s): InterLACE project is funded by the Australian National Health and Medical Research Council project grant (APP1027196). GDM is supported by the Australian National Health and Medical Research Council Principal Research Fellowship (APP1121844).
Keywords: age at menarche; age at menopause; first birth; number of children; reproductive events.
© The Author(s) 2019. Published by Oxford University Press on behalf of the European Society of Human Reproduction and Embryology. All rights reserved. For Permissions, please e-mail: journals.permissions@oup.com.
Figures
Comment in
-
Reply: Increasing number of menstruations in recent generations may contribute to the development of endometriosis: an evolutionary view from a critical analysis of National Health data.Hum Reprod. 2019 Dec 1;34(12):2550. doi: 10.1093/humrep/dez193. Hum Reprod. 2019. PMID: 31820789 No abstract available.
References
-
- Atsma F, Bartelink M-LE, Grobbee DE, van der Schouw YT. Postmenopausal status and early menopause as independent risk factors for cardiovascular disease: a meta-analysis. Menopause 2006;13:265–279. - PubMed
-
- Berlin JA, Santanna J, Schmid CH, Szczech LA, Feldman HI, Anti-Lymphocyte Antibody Induction Therapy Study Group. Individual patient- versus group-level data meta-regressions for the investigation of treatment effect modifiers: ecological bias rears its ugly head. Stat Med 2002;21:371–387. - PubMed
Publication types
MeSH terms
Grants and funding
LinkOut - more resources
Full Text Sources
Medical
Research Materials
