. 2019 Jun;105(6):1143-1153.
doi: 10.1002/JLB.MA0718-295RR. Epub 2019 Mar 5.

Real-time deformability cytometry reveals sequential contraction and expansion during neutrophil priming

Affiliations

Real-time deformability cytometry reveals sequential contraction and expansion during neutrophil priming

Kathleen R Bashant et al. J Leukoc Biol. 2019 Jun.

Abstract

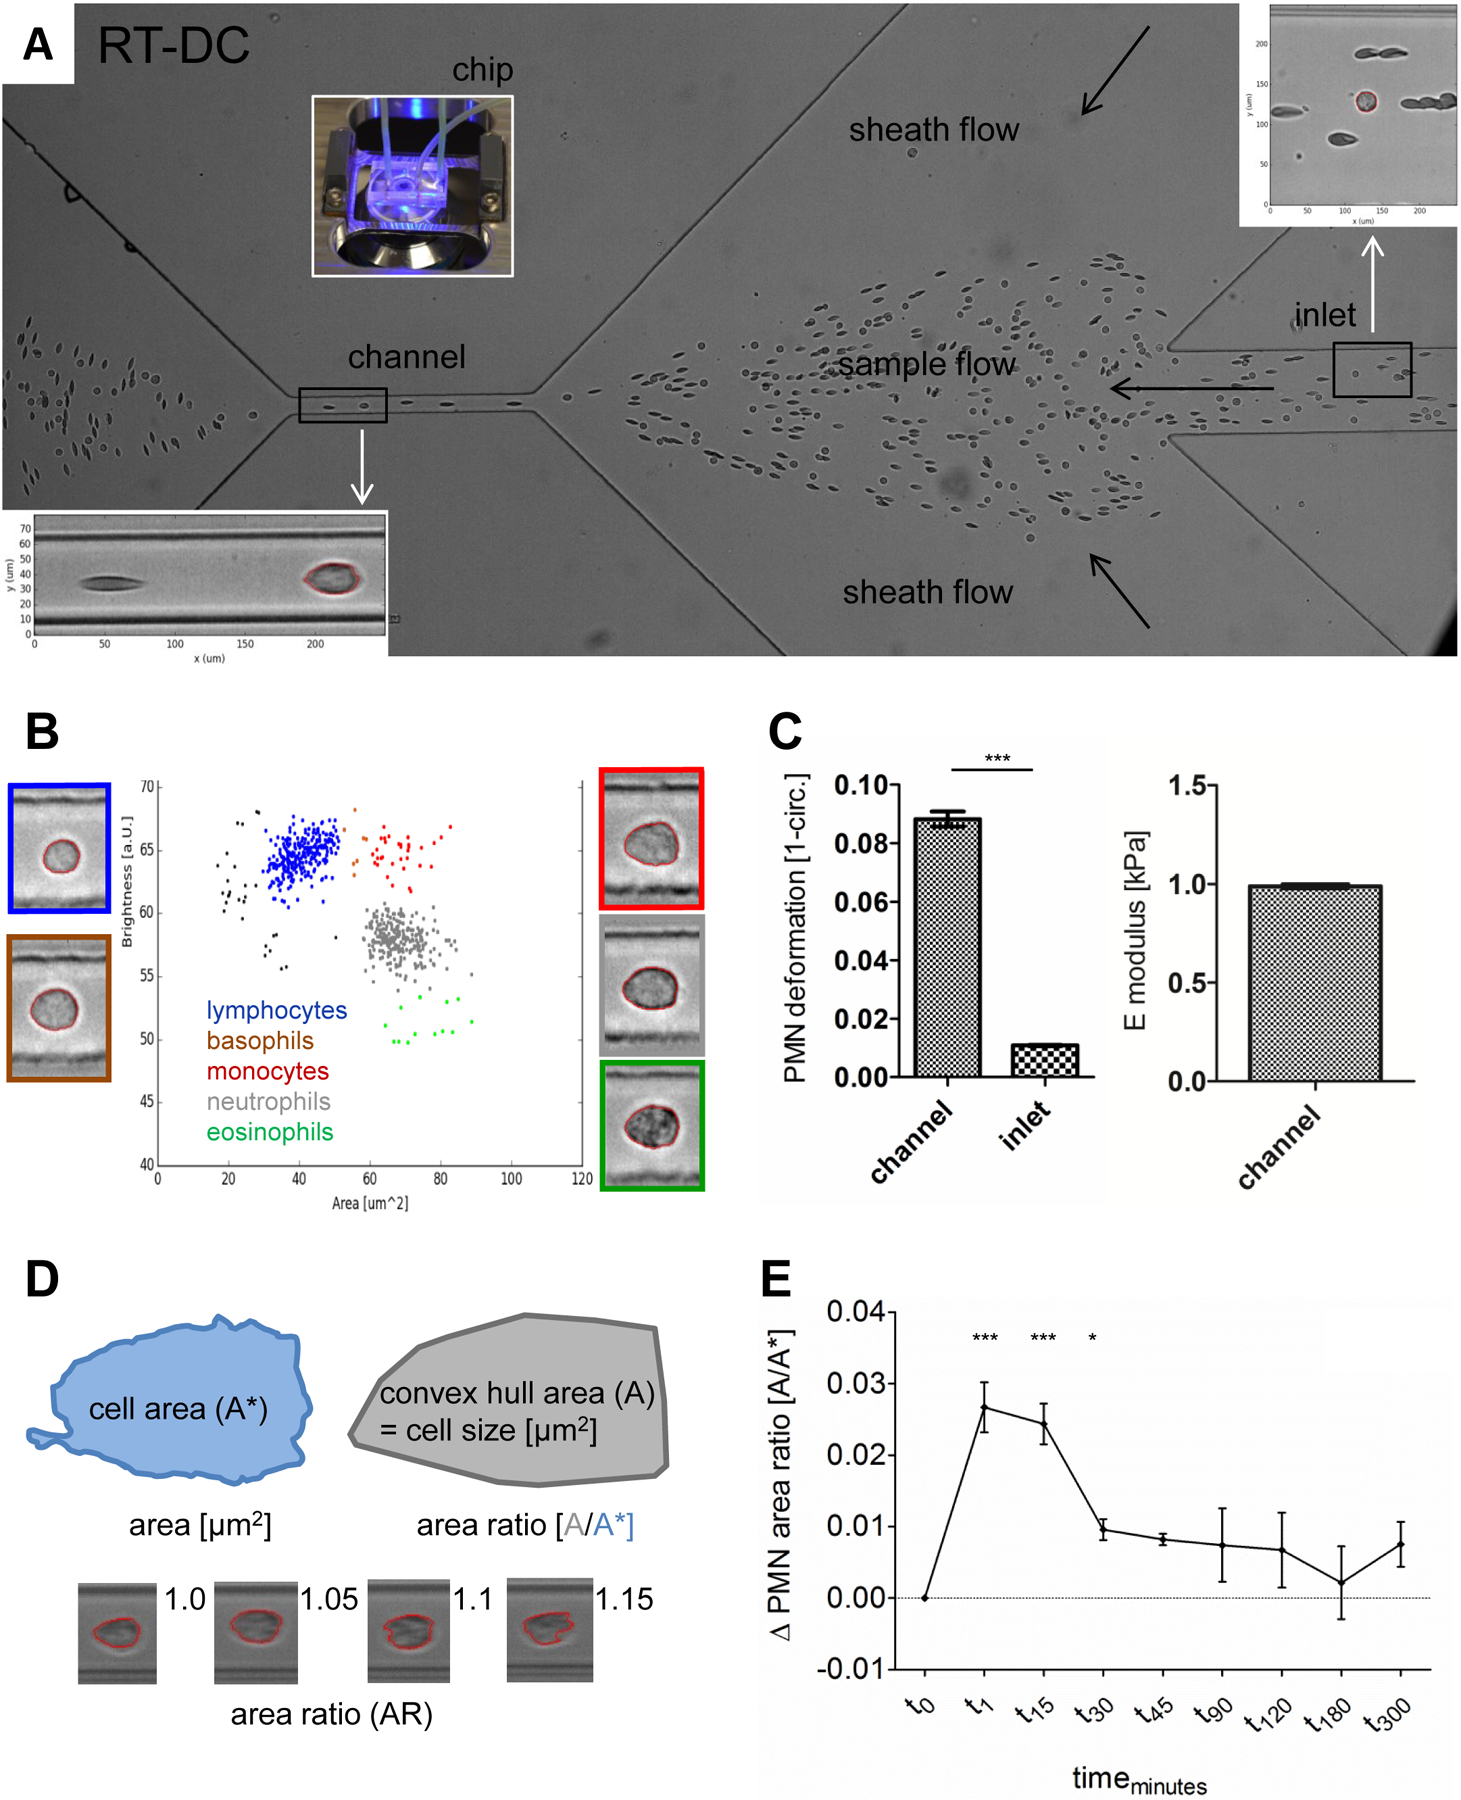
It has become increasingly apparent that the biomechanical properties of neutrophils impact on their trafficking through the circulation and in particularly through the pulmonary capillary bed. The retention of polarized or shape-changed neutrophils in the lungs was recently proposed to contribute to acute respiratory distress syndrome pathogenesis. Accordingly, this study tested the hypothesis that neutrophil priming is coupled to morpho-rheological (MORE) changes capable of altering cell function. We employ real-time deformability cytometry (RT-DC), a recently developed, rapid, and sensitive way to assess the distribution of size, shape, and deformability of thousands of cells within seconds. During RT-DC analysis, neutrophils can be easily identified within anticoagulated "whole blood" due to their unique granularity and size, thus avoiding the need for further isolation techniques, which affect biomechanical cell properties. Hence, RT-DC is uniquely suited to describe the kinetics of MORE cell changes. We reveal that, following activation or priming, neutrophils undergo a short period of cell shrinking and stiffening, followed by a phase of cell expansion and softening. In some contexts, neutrophils ultimately recover their un-primed mechanical phenotype. The mechanism(s) underlying changes in human neutrophil size are shown to be Na+ /H+ antiport-dependent and are predicted to have profound implications for neutrophil movement through the vascular system in health and disease.

Keywords: macropinocytosis; morpho-rheological (MORE) phenotyping; neutrophil priming and de-priming.


Conflict of interest statement

Conflict of Interest Disclosure: Christoph Herold owns shares of, and is full-time employed at, Zellmechanik Dresden GmbH, a company selling devices based on real-time deformability cytometry. The other authors declare that no competing interests exist.

Figures

Figure 1
Figure 1. RT-DC measurement of whole blood.
A Structure of the microfluidic RT-DC chip. Single blood cells during whole blood measurement are visible. Magnification of a round shaped neutrophil surrounded by red blood cells (RBC) in the inlet (upper right) and a deformed RBC and a neutrophil in the channel (lower left). B Nucleated blood cell (NBC) populations differentiated by area and brightness. NBC with representative images, platelets and microRBC < 25 µm2 (black dots, images not shown). C Deformation and E modulus of blood neutrophils. Comparison of neutrophil deformation between channel and inlet by paired t-test (n = 8). D RT-DC parameters for morphological neutrophil characterisation. Exemplary images of neutrophils with different area ratios (AR), smooth shaped (AR 1.0) to highly ruffled (AR 1.15). E fMLF stimulation of whole blood. Mean and SEM of neutrophil AR over time, changes referenced against unstimulated, time-matched controls, compared by repeated measures ANOVA and Bonferroni post-test (t0 to t30; n = 8).
Figure 2
Figure 2. Size of neutrophils during priming and post-priming upon blood stimulation.
A, B Size change of stimulated blood neutrophils over time. Time courses of blood neutrophil size after stimulation of whole blood with fMLF (A) and overview of neutrophil size kinetics after blood stimulation with different agonists (B, fMLF (black diamond), PAF (red diamond), GM-CSF (green square) and LPS (blue square). Mean and SEM of stimulated blood neutrophil size changes, shown in reference against unstimulated, time-matched controls. Differences between samples and controls by repeated measures ANOVA and Bonferroni post-test (t0 to t45; n = 8). C Exemplary images of blood neutrophils after fMLF stimulation of blood. Size (and deformation) changes shown at different time points. Length is measured in pixel, scale bar (10 µm) shown. D, E Blood neutrophil size analysis on single cell level. Size of the first 200 measured blood neutrophils of n = 5 blood donors after one minute (t1, D) and 15 minutes (t15, E) of fMLF blood stimulation with Lowess trendline for the neutrophils of each donor. F Area ratio of neutrophils changes in fMLF activated blood samples over time. Data shown as mean and SEM, differences between samples by repeated measures ANOVA and Bonferroni post-test (n = 8). Increase of area ratio coincides with size changes at t1 and t15 (Fig. 2A).
Figure 3
Figure 3. Mechanics of neutrophil priming and post-priming upon blood stimulation.
A, B Deformation change of stimulated blood neutrophils over time. Time courses of blood neutrophil deformation after stimulation of whole blood with fMLF (A) and overview of neutrophil deformation kinetics after blood stimulation with different agonists (B, fMLF (black diamond), PAF (red diamond), GM-CSF (green square) and LPS (blue square). Deformation change of stimulated blood neutrophils referenced against unstimulated, time-matched controls, data shown as mean and SEM. Differences between samples and controls by repeated measures ANOVA and Bonferroni post-test (t0 to t45; n = 8). C Quantification of deformability (E modulus). Blood neutrophils compared to controls at different time points after fMLF stimulation by one-way ANOVA and Bonferroni post-test (n ≥ 3). D Exemplary images of purified neutrophils after inhibition of fMLF induced deformation change by Y-27623. Neutrophil deformation after preincubation with 1 µM (Y1) and 10 µM (Y10) Y-27623 at one minute (t1) after fMLF stimulation. Scale bar (10 µm) shown. E Quantification of the inhibitory Y-27623 effect on purified neutrophils. Neutrophil E modulus after preincubation with 1 µM (Y1) and 10 µM (Y10) Y-27623 after fMLF stimulation for one minute (t1) and 15 minutes (t15) compared to unstimulated, time-matched controls by one-way ANOVA and Bonferroni post-test (n ≥ 4).
Figure 4
Figure 4. fMLF-mediated neutrophil size expansion is Na+/H+ antiport dependent.
A Influence of Y-27623 on the size of neutrophils. Purified neutrophils after one minute (t1) and 15 minutes (t15) of fMLF stimulation compared to non-stimulated controls by one-way ANOVA and Bonferroni post-test (n ≥ 4). All stimulation and control measurements after preincubation with 1 µM (Y1), 10 µM (Y10) Y-27623 or PBS respectively. B Inhibitory effect of amiloride on neutrophil expansion. Size kinetics of fMLF stimulated purified neutrophils with and without amiloride pre-treatment, samples shown as mean and SEM, referenced against unstimulated, time-matched controls. Differences between treatments by two-way ANOVA (p < 0.05; n = 3). C Inhibitory effect of choline chloride on neutrophil expansion. Size kinetics of fMLF stimulated purified neutrophils in isotonic, alkali cation-free medium compared to PBS controls, samples shown as mean and SEM referenced against unstimulated, time-matched controls. Differences between treatments by two-way ANOVA (p < 0.05; n = 5) D Amiloride-mediated inhibition of dextran uptake. Exemplary confocal images of purified neutrophils 15 minutes post fMLF stimulation with and without amiloride pre-treatment. Green fluorescence indicates dextran uptake. E Quantification of neutrophil dextran uptake. Mean fluorescence intensity (MFI) of dextran in purified neutrophils 5 minutes (dots) and 15 minutes (squares) post fMLF stimulation, compared to fMLF stimulated neutrophils pretreated with amiloride by Kruskal-Wallis test with a Dunn’s post-test for multiple comparisons (n = 3). F Aquaporin 9 expression of stimulated neutrophils quantified by MFI. Influence of fMLF, PAF, GM-CSF and TNF on AQP9 expression compared to unstimulated control (n = 3). G Aquaporin 9 antibody (AQP9 ab) effect on neutrophil expansion. Neutrophil size change post fMLF stimulation over time with and without AQP9 antibody pre-treatment, mean and SEM shown in reference against unstimulated, time-matched controls (n = 3).

References

    1. Vogt KL, et al., Priming and de-priming of neutrophil responses in vitro and in vivo. European Journal of Clinical Investigation, 2018. 0(0): p. e12967. - PubMed
    1. Miralda I, Uriarte SM, and McLeish KR, Multiple Phenotypic Changes Define Neutrophil Priming. Frontiers in Cellular and Infection Microbiology, 2017. 7(217). - PMC - PubMed
    1. Condliffe AM, Kitchen E, and Chilvers ER, Neutrophil Priming: Pathophysiological Consequences and Underlying Mechanisms. Clinical Science, 1998. 94(5): p. 461. - PubMed
    1. Haslett C, et al., Modulation of multiple neutrophil functions by preparative methods or trace concentrations of bacterial lipopolysaccharide. The American Journal of Pathology, 1985. 119(1): p. 101–110. - PMC - PubMed
    1. Bass DA, et al., Subpopulations of neutrophils with increased oxidative product formation in blood of patients with infection. The Journal of Immunology, 1986. 136(3): p. 860. - PubMed

Publication types

Substances