. 2019 Jun;156(8):2297-2312.
doi: 10.1053/j.gastro.2019.02.040. Epub 2019 Mar 2.

GNAI1 and GNAI3 Reduce Colitis-Associated Tumorigenesis in Mice by Blocking IL6 Signaling and Down-regulating Expression of GNAI2

Affiliations

GNAI1 and GNAI3 Reduce Colitis-Associated Tumorigenesis in Mice by Blocking IL6 Signaling and Down-regulating Expression of GNAI2

Zhi-Wei Li et al. Gastroenterology. 2019 Jun.

Abstract

Background & aims: Interleukin 6 (IL6) and tumor necrosis factor contribute to the development of colitis-associated cancer (CAC). We investigated these signaling pathways and the involvement of G protein subunit alpha i1 (GNAI1), GNAI2, and GNAI3 in the development of CAC in mice and humans.

Methods: B6;129 wild-type (control) or mice with disruption of Gnai1, Gnai2, and/or Gnai3 or conditional disruption of Gnai2 in CD11c+ or epithelial cells were given dextran sulfate sodium (DSS) to induce colitis followed by azoxymethane (AOM) to induce carcinogenesis; some mice were given an antibody against IL6. Feces were collected from mice, and the compositions of microbiomes were analyzed by polymerase chain reactions. Dendritic cells (DCs) and myeloid-derived suppressor cells (MDSCs) isolated from spleen and colon tissues were analyzed by flow cytometry. We performed immunoprecipitation and immunoblot analyses of colon tumor tissues, MDSCs, and mouse embryonic fibroblasts to study the expression levels of GNAI1, GNAI2, and GNAI3 and the interactions of GNAI1 and GNAI3 with proteins in the IL6 signaling pathway. We analyzed the expression of Gnai2 messenger RNA by CD11c+ cells in the colonic lamina propria by PrimeFlow, expression of IL6 in DCs by flow cytometry, and secretion of cytokines in sera and colon tissues by enzyme-linked immunosorbent assay. We obtained colon tumor and matched nontumor tissues from 83 patients with colorectal cancer having surgery in China and 35 patients with CAC in the United States. Mouse and human colon tissues were analyzed by histology, immunoblot, immunohistochemistry, and/or RNA-sequencing analyses.

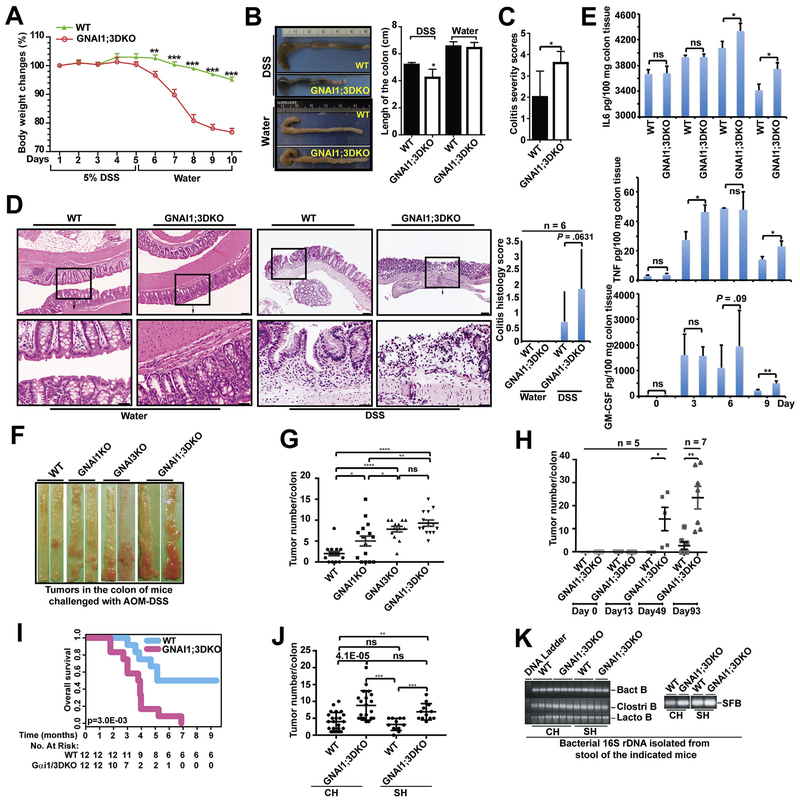
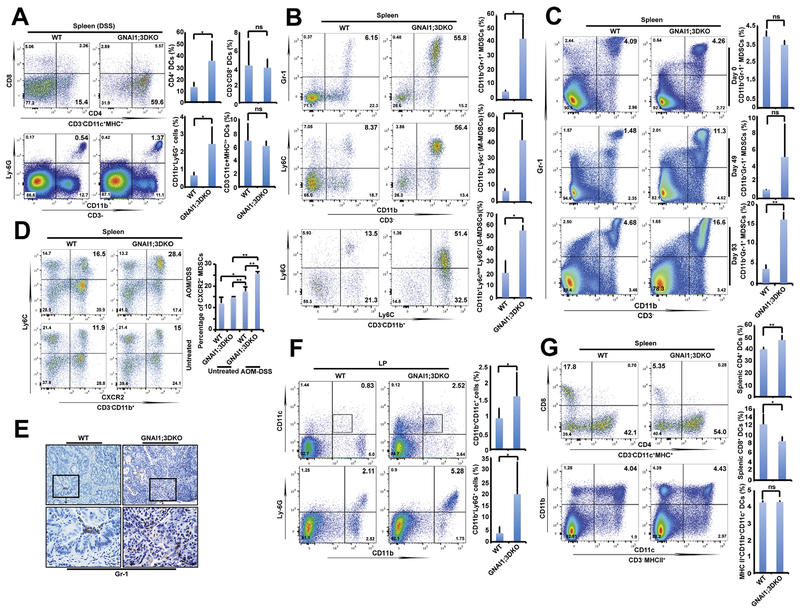
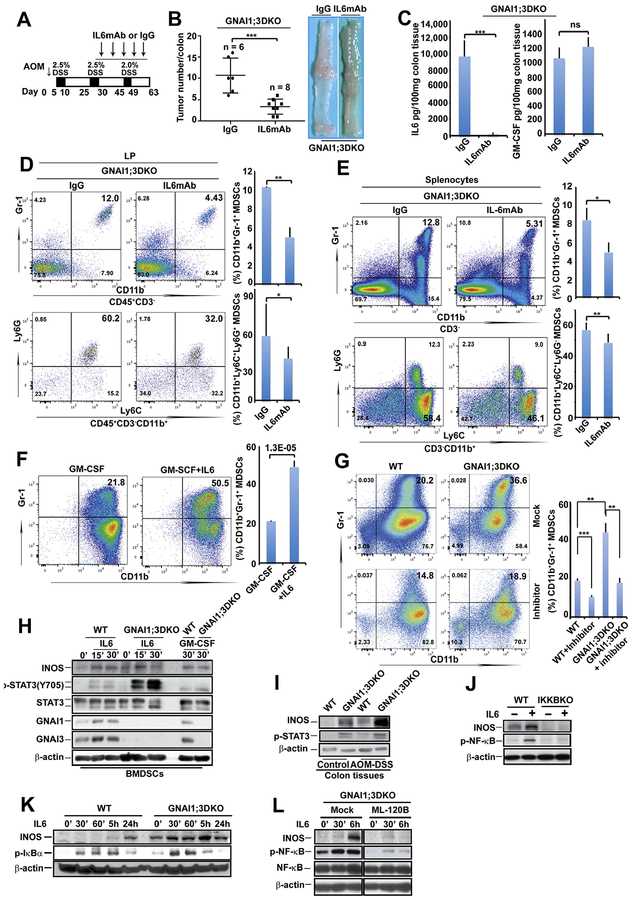
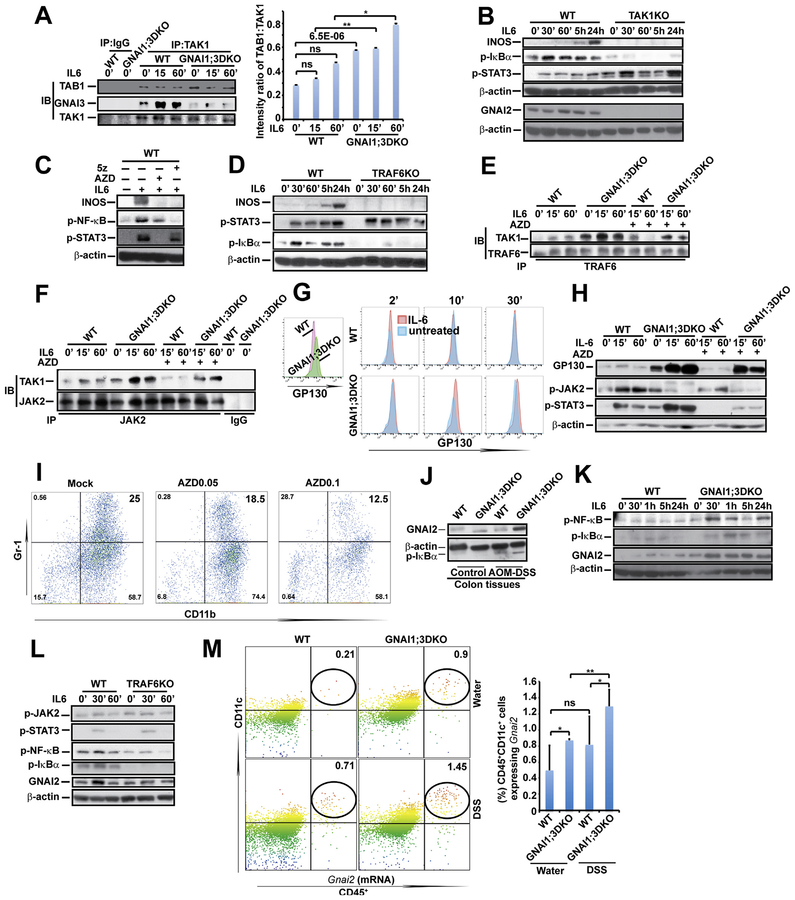
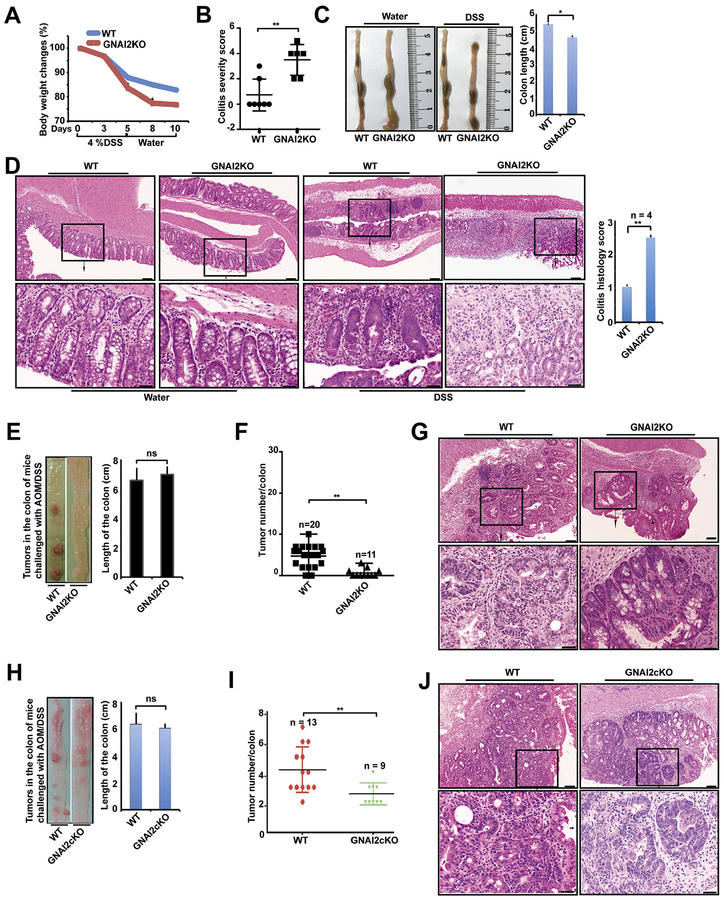
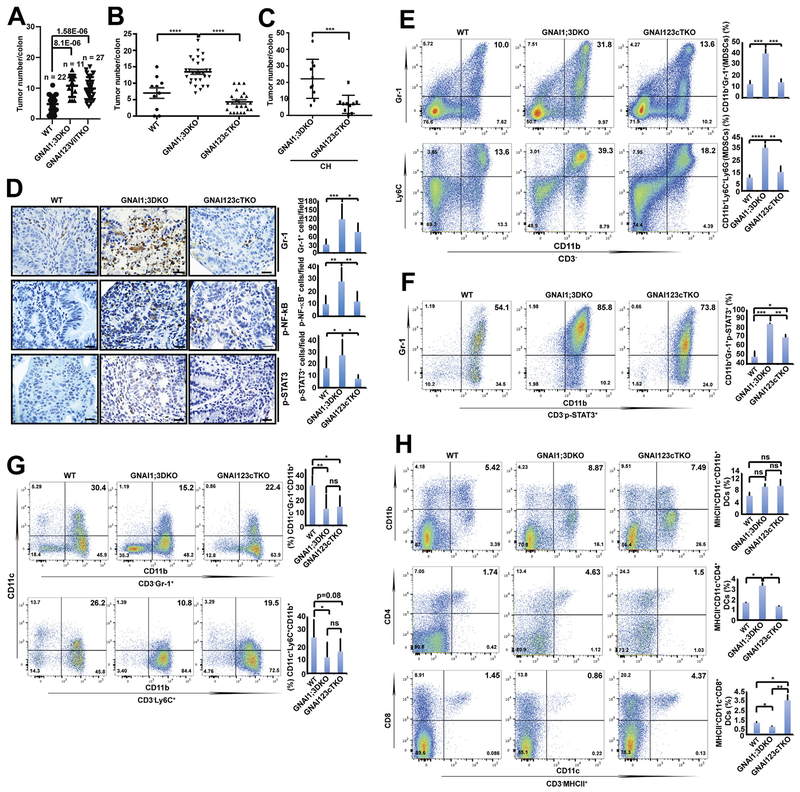
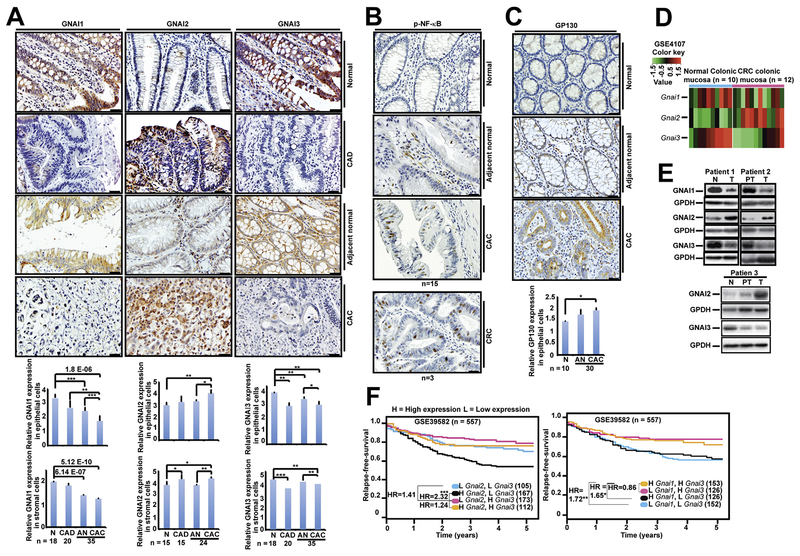
Results: GNAI1 and GNAI3 (GNAI1;3) double-knockout (DKO) mice developed more severe colitis after administration of DSS and significantly more colonic tumors than control mice after administration of AOM plus DSS. Development of increased tumors in DKO mice was not associated with changes in fecal microbiomes but was associated with activation of nuclear factor (NF) κB and signal transducer and activator of transcription (STAT) 3; increased levels of GNAI2, nitric oxide synthase 2, and IL6; increased numbers of CD4+ DCs and MDSCs; and decreased numbers of CD8+ DCs. IL6 was mainly produced by CD4+/CD11b+, but not CD8+, DCs in DKO mice. Injection of DKO mice with a blocking antibody against IL6 reduced the expansion of MDSCs and the number of tumors that developed after CAC induction. Incubation of MDSCs or mouse embryonic fibroblasts with IL6 induced activation of either NF-κB by a JAK2-TRAF6-TAK1-CHUK/IKKB signaling pathway or STAT3 by JAK2. This activation resulted in expression of GNAI2, IL6 signal transducer (IL6ST, also called GP130) and nitric oxide synthase 2, and expansion of MDSCs; the expression levels of these proteins and expansion of MDSCs were further increased by the absence of GNAI1;3 in cells and mice. Conditional disruption of Gnai2 in CD11c+ cells of DKO mice prevented activation of NF-κB and STAT3 and changes in numbers of DCs and MDSCs. Colon tumor tissues from patients with CAC had reduced levels of GNAI1 and GNAI3 and increased levels of GNAI2 compared with normal tissues. Further analysis of a public human colorectal tumor DNA microarray database (GSE39582) showed that low Gani1 and Gnai3 messenger RNA expression and high Gnai2 messenger RNA expression were significantly associated with decreased relapse-free survival.

Conclusions: GNAI1;3 suppresses DSS-plus-AOM-induced colon tumor development in mice, whereas expression of GNAI2 in CD11c+ cells and IL6 in CD4+/CD11b+ DCs appears to promote these effects. Strategies to induce GNAI1;3, or block GNAI2 and IL6, might be developed for the prevention or therapy of CAC in patients.

Keywords: CAC; IBD; Mouse Model; Transcription Factor.


Conflict of interest statement

Conflicts of interest

The authors disclose no conflicts.

Figures

Figure 1.
Figure 1.
GNAI1;3 inhibit colitis, and their ablation promotes the initiation and progression of CAC, which is independent of microbiota. (A) Body weight changes during the course of acute colitis with DSS (n = 6). (B) The change of colon length. (C) Colitis severity score. (D) H&E-stained representative images of the colons of WT and GNAI1;3DKO mice with histology score (n = 6) on day 10. Scale bars: upper, 100 μm; lower, 25 μm. (E) The levels of GM-CSF, IL6, and TNF in the supernatant of colon culture (n = 3). (F) Representative images of colonic tumors from WT and GNAI1;3DKO mice. (G) Tumor number/colon of WT (n 15), GNAI1KO (n = 15), GNAI3KO (n = 13), or GNAI1;3DKO (n = 14) mice. (H) number/colon of WT (n = 5) and GNAI1;3DKO (n = 5) on days 0,13,49 and WT (n = 7) and GNAI3 (n = 7) on day 93. (I) Overall survival of challenged WT andGNAI1;3DKOmice (n = 12/group).(J) Tumor number/colon of WT (n = 21) and GNAI1;3 DKO mice (n = 20) under the CH condition or WT (n = 11) and GNAI1;3 DKO mice (n = 12) under the SH condition. (K) Polymerase chain reaction analysis of 16S ribosomal DNA of the indicated bacteria in the stool isolated from the indicated mice. All analyzed data are mean ± standard error of the mean (A, G, and H) or standard deviation (B–E, J). *P < .05, **P < .01, ***P < .001, ****P < .0001; 2-tailed Student t test. Bact B, Bacteroides species; Clostri B, Clostridiales species; Lacto B, Lactobacillaceae species; ns, not significant; SFB, segmented filamentous bacteria species.
Figure 2.
Figure 2.
GNAI1;3 deficiency stimulates MDSC expansion but reduces CD8+ DC counts. (A) Representative FACS plots of CD4+ DCs, CD8+ DCs, and CD11b+Ly6G+ MDSCs, together with quantitative analysis of major histocompatibility complex (MHC) II+CD11c+ DCs in the spleen of mice treated with DSS on day 10 (n = 4–6). (B) Representative FACS plots of splenic CD11b+Gr-1+ GNAI1;3DKO mice on day 100 (n = 5). (C) Representative FACS plots and quantitative analysis of splenic CD3CD11b+Gr-1+ MDSCs from unchallenged (day 0, n = 5) or AOM–DSS-challenged WT and GNAI1;3DKO mice on day 49 (n = 5) or day 93 (n = 7). (D) Representative FACS plots of splenic CXCR2+ MDSCs of AOM–DSS-challenged WT and GNAI1;3DKO mice on day100 (n = 5). (E) IHC analysis of AOM–DSS-challenged mouse colonic tissues (n = 5) for granulocyte receptor-1 antigen (Gr-1) on day 100. Scale bars, 25 μm. (F) Representative FACS plots of CD11b+CD11c+ DCs and CD11b+Ly6G+ MDSCs in colonic LP of AOM–DSS-challenged WT and GNAI1;3DKO mice on day 63 (n = 5). (G) Percentages of CD3MHCII+CD11b+CD11c+, CD4+CD11c+, and CD8+CD11c+ DCs (day 100) are shown (n = 5). All data shown are representative of 2 or 3 independent experiments. Data are mean ± standard deviation. *P < .05, 2-tailed Student t test. FACS, fluorescence-activated cell sorting.
Figure 3.
Figure 3.
IL6 mediates colitis-associated tumorigenesis and MDSC expansion in GNAI1;3DKO mice, and its activation of NF-ĸB and expansion of MDSCs are enhanced by GNAI1;3 deficiency. (A) Schematic intraperitoneal injection schedule of IL6 monoclonal antibody (IL6mAb) and its isotype immunoglobulin G control (IgG). (B) Left panel shows tumor number/colon of AOM–DSS-challenged mice with injection on day 63 (n = 6–8). Right panel shows representative images of colonic tumors of the mice. (C) Levels of IL6 and GM-CSF in the supernatant of colon culture from indicated mice in (B) (n = 3). (D, E) Representative FACS plots of CD45+CD3CD11b+Gr-1+ and CD45+CD3CD11b+Ly6G+ MDSCs in (D) the LP or (E) the spleen of the mice in part B (n = 3–6). (F) WT BMDSCs were differentiated by GM-CSF in the presence or absence of IL6 and then assayed for CD11b+Gr-1+ MDSCs (n = 3). (G) Representative FACS plots of CD11b+Gr-1+ BMDSCs of WT and GNAI1;3DKO mice (n = 3) differentiated with GM-CSF plus IL6 in the presence or absence of BP-1–102 (5 μmol/L) (left). Quantitative analysis of CD11b+Gr-1+ BMDSCs shown in the left panel is graphed on the right. (H) IB analysis for the levels of p-STAT3(Y705), STAT3, INOS, GN1AI, GNAI3, and β-actin in indicated WT and G GNAI1;3DKO BMDSCs. (I) IB analysis for expression of INOS, p-STAT3, and β-actin in the indicated mouse colonic tissues. (J) IB analysis for the levels of INOS, p-NF-ĸBp65(S536), and bactin in WT and IKKBKO MEFs. (K) IB analysis for the levels of INOS, p-IĸBα(S32), and β-actin in WT and GNAI1;3DKO MEFs. (L) IB analysis for the levels of INOS, p-NF-ĸBp65(S536), NF-ĸB, and β-actin in GNAI1;3DKO MEFs in the presence or absence of ML-120. Data are mean ± standard deviation. **P < .01, ***P < .001, 2-tailed Student t test. Except in A–E, all data are representative of 2 or 3 independent experiments. mAb, monoclonal antibody; p-, phosphorylated.
Figure 4.
Figure 4.
GNAI1;3 deficiency leads to enhanced TAK1–TAB1 interaction and IL6-induced JAK activity-dependent interactions among TAK1, JAK2, and TRAF6, which are required for IL6 activation of NF-ĸB, and GNAI2, GP130, and INOS up-regulation. (A) IP/IB and quantified analysis for interactions of TAK1 with TAB1 and GNAI3 (n = 3). (B) IB analysis for INOS, p-IĸBα(S32), p-STAT3(Y705), GNAI2, and β-actin in WT and TAK1KO MEFs. (C) IB analysis for INOS, p-NF-ĸBp65(S536), p-STAT3(Y705), and β-actin in WT MEFs treated with AZD or 5z. (D) IB analysis for INOS, p-IĸBα(S32), p-STAT3(Y705), and b-actin in WT and TRAF6KO MEFs, (E) IP/IB analysis for TAK1–TRAF6 interaction in WT and GNAI1;3DKO MEFs. (F) IP/IB analysis for TAK1–JAK2 interaction in WT and GNAI1;3DKO MEFs. (G) Representative FACS plots of GP130 on the surface of IL6-treated WT and GNAI1;3DKO MEFs. (H) IB for GP130, p-JAK2(Y1007/8), p-STAT3(Y705), and β-actin in treated WT and GNAI1;3DKO MEFs. (I) Representative FACS plots of CD11b+Gr-1+ WT BMDSCs differentiated with GM-CSF and IL6 in the presence or absence of AZD. (J) IB for GNAI2, p-IĸBα(S32), and β-actin in indicated WT and GNAI1;3DKO colonic tissues. (K) IB for GNAI2, p-IĸBα(S32), p-NF-ĸBp65(S536), and β-actin in WT and GNAI1;3DKO MEFs. (L) IB for GNAI2, p-IĸBa(S32), p-JAK2(Y1007/8), p-NF-ĸBp65(S536), p-STAT3(Y705), and β-actin in WT and TRAF6KO MEFs. (M) PrimeFlow analysis of Gnai2 mRNA expression in CD45+CD11c+ colonic LP isolated from indicated WT and GNAI1;3DKO mice on day 10 (n = 6). Data are mean ± standard deviation. *P < .05, **P < .01, ***P < .001; 2-tailed Student t test. All data in A–L are representative of 2 or 3 independent experiments. 5z, 5z-7-oxozeaenol; FACS, fluorescence-activated cell sorting; ns, not significant; p-, phosphorylated.
Figure 5.
Figure 5.
GNAI2 inhibits colitis but promotes CAC. (A) Body weight change of WT and GNAI2KO mice during the course of acute colitis with DSS (n = 12). (B–E) On day 10: (B) colitis severity score (n = 6), (C) change of the colon length, and (D) H&E representative images and histologic analysis of the colon of WT and GNAI2KO mice. Scale bars: upper, 100 μm; lower, 25 μm. (E–G) On day 63: (E) representative images of the colon and the change of the colon length, (F) tumor number/colon of indicated AOM–DSS-treated WT and GNAI2KO mice, and (G) H&E representative images of colonic tumors from WT and GNAI2KO mice. Scale bars: upper, 100 μm; lower, 25 μm. (H–J) On day 63: (H) representative images of the colon and the change of the colon length, (I) tumor number/colon of indicated AOM–DSS-treated WT and GNAI2cKO mice, and (J) H&E representative images of colonic tumors from number/colon of indicated AOM–DSS-treated WT and GNAI2cKO mice. Scale bars: upper, 100 μm; lower, 25 μm.
Figure 6.
Figure 6.
Deletion of GNAI2 in CD11c+ cells, but not the epithelial cells, of GNAI1;3DKO mice diminishes colonic tumor multiplicity, CD4+ DC and MDSC expansion, and NF-ĸB and STAT3 activation but restores CD8+ DC and CD11c+ MDSC counts. (A) Tumor number/colon of AOM–DSS-challenged WT (n = 22), GNAI1;3DKO (n = 11), or GNAI123vilTKO (n = 27) mice on day 72. (B) Tumor number/colon of AOM–DSS-challenged mice (WT, n = 10; GNAI1;3DKO, n = 28; GNAI123cTKO, n = 23) on day 100. (C) Tumor number/colon of AOM–DSS-challenged mice (GNAI1;3DKO, n = 9; GNAI123cTKO, n = 10) under the CH condition for 87 days. (D) IHC analysis for Gr-1, p-NF-ĸBp65(S536), and p-STAT3(Y705) in colonic tissues from AOM–DSS-challenged WT, GNAI1;3DKO, and GNAI123cTKO mice (n = 3). Scale bars: 25 μm. (E) Representative FACS plots of splenic CD3CD11b+Gr-1+ and CD3CD11b+Ly6C+ MDSCs from indicated AOM–DSS-challenged WT, GNAI1;3DKO, and GNAI123cTKO at day 120. n = 4. (F) Representative FACS plots of splenic CD3CD11b+Gr-1+p-STAT3+ MDSCs of AOM–DSS-challenged WT, GNAI1;3DKO, and GNAI123cTKO mice. (G) Representative FACS plots of splenic CD11c+ CD3CD11b+Gr-1+ and CD11c+ CD3CD11b+Ly6C+ MDSCs of AOM–DSS-treated WT, GNAI1;3DKO, and GNAI123cTKO mice. (H) Representative FACS plots of splenic CD11b+, CD4+, and CD8+ MHCII+CD11c+ DCs from AOM–DSS-challenged WT, GNAI1;3DKO, and GNAI123cTKO mice. n = 4. Quantitative analysis of MDSCs and DCs is shown next to the plots or images. All data are mean ± standard deviation (C–H) or standard error of the mean (A–B). *P < .05, **P < .01, ***P < .001, ****P < .0001. FACS, fluorescence-activated cell sorting; ns, not significant.
Figure 7.
Figure 7.
Low GNAI1;3 expression and high GNAI2 expression are associated with colorectal tumorigenesis and poor patient survival. (A–C) IHC staining for (A) GNAI1-, GNAI2-, and GNAI3-, (B) p-NF-ĸBp65(S536)–, and (C) GP130-positive cells in the normal, dysplastic (CAD), and adjacent nonneoplastic or neoplastic (CAC) epithelial cells and corresponding surrounding stromal cells. Quantitative analyses of GNAI1, GNAI2, GNAI3, and GP130 are shown under the images. All data are mean ± standard deviation. *P < .05, **P < .01, ***P < .001; 2-tailed Student t test. Scale bars: 25 mm. (D) Heatmap analysis of GSE4107 CRC mucosal tissue DNA microarray for expression of Gnai1, Gnai2, and Gnai3 mRNA. (E) IB analysis for GNAI1, GNAI2, or GNIA3 in CRC patients’ normal colon (N), peritumor (PT), or tumor (T) tissues. (F) Relapse-free survival of 4 subgroups of CRC patients classified by different combinations of Gnai1 and Gnai3 expression levels (left) and Gnai2 and Gnai3 expression levels (right).

References

    1. Foersch S, Neurath MF. Colitis-associated neoplasia: molecular basis and clinical translation. Cell Mol Life Sci 2014;71:3523–3535. - PMC - PubMed
    1. Greten FR, Eckmann L, Greten TF, et al. IKKBeta links inflammation and tumorigenesis in a mouse model of colitis-associated cancer. Cell 2004;118:285–296. - PubMed
    1. Grivennikov S, Karin E, Terzic J, et al. IL-6 and Stat3 are required for survival of intestinal epithelial cells and development of colitis-associated cancer. Cancer Cell 2009;15:103–113. - PMC - PubMed
    1. Terzic J, Grivennikov S, Karin E, et al. Inflammation and colon cancer. Gastroenterology 2010;138:2101–2114. - PubMed
    1. Grivennikov SI, Karin M. Inflammatory cytokines in cancer: tumour necrosis factor and interleukin 6 take the stage. Ann Rheum Dis 2011;7(Suppl 1):i104–i108. - PubMed

Publication types

MeSH terms

Substances