

Trends and predictors of inequality in childhood stunting in Nepal from 1996 to 2016
- PMID: 30836975
- PMCID: PMC6402091
- DOI: 10.1186/s12939-019-0944-z
Trends and predictors of inequality in childhood stunting in Nepal from 1996 to 2016
Abstract
Background: Although decreasing in trend, one-in-three children remain stunted in Nepal and its distribution is unequal among different socioeconomic and geographical subgroups. Thus, it is crucial to assess inequalities in stunting for designing equity focused interventions that target vulnerable groups with higher burden of stunting. This study measures trends and predictors of socioeconomic inequalities in childhood stunting in Nepal.
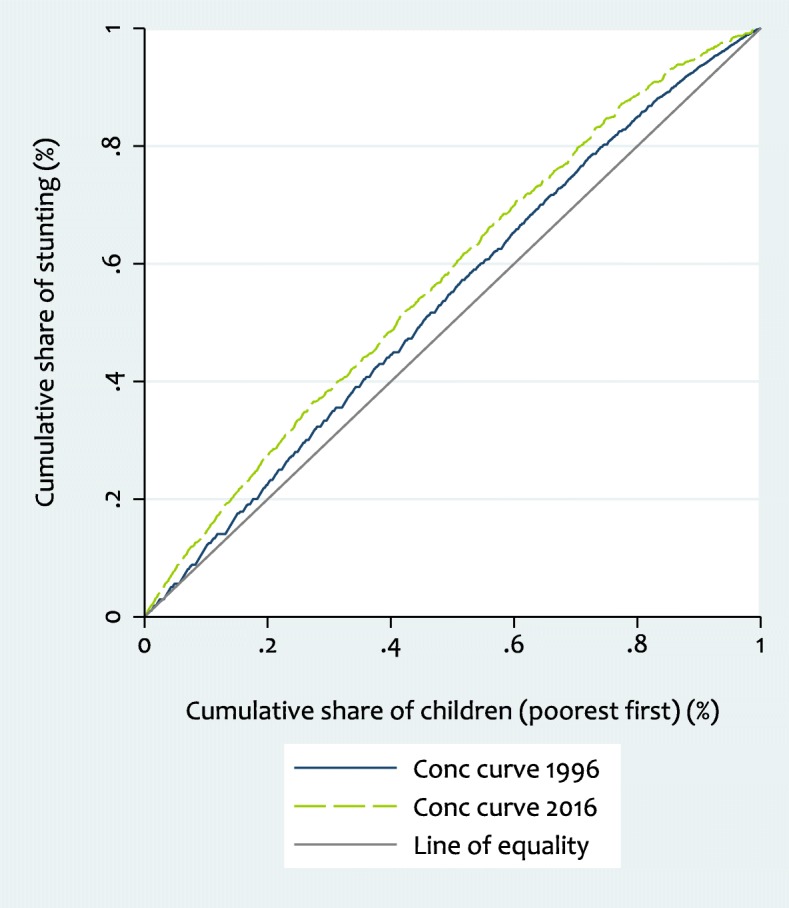
Methods: Data from five rounds (1996-2016) of Nepal Demographic and Health Survey, nationally representative cross-sectional surveys, were used. Levels and trends of absolute and relative disparity in stunting between the poorest and the richest wealth quintiles, and among all quintiles were assessed by calculating absolute and relative difference, concentration curve and index. Average marginal effects of predictors on stunting were calculated using probit regression. The concentration index was subsequently decomposed into contributing factors.
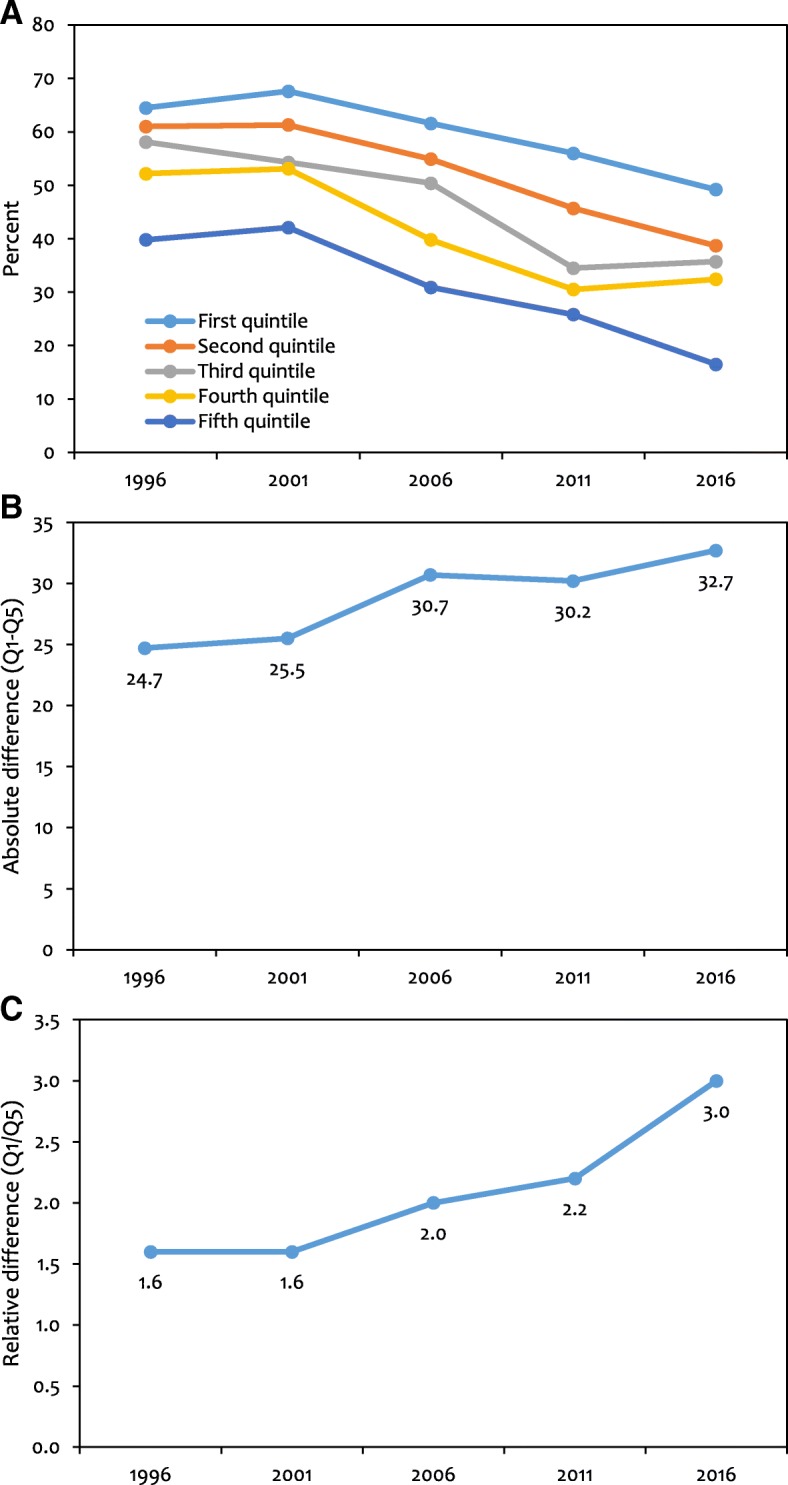
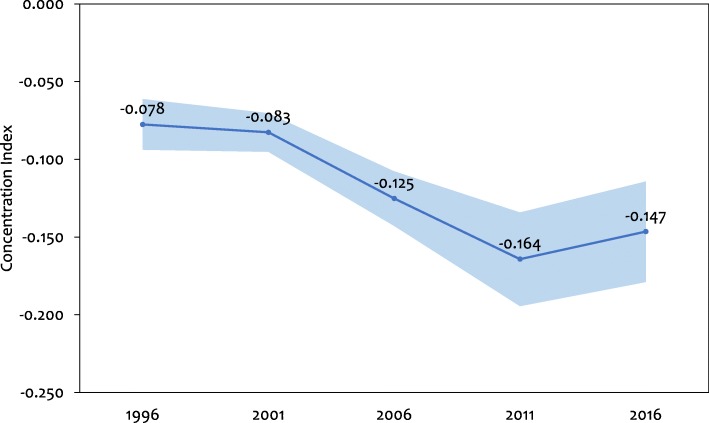
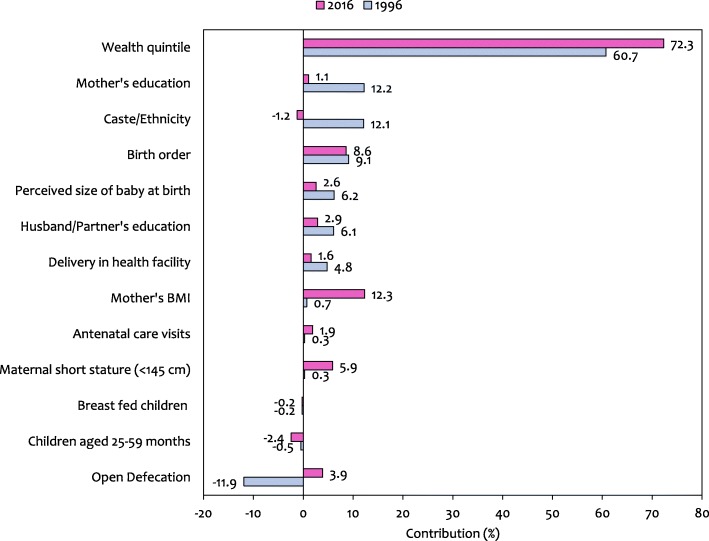
Results: Even though stunting consistently declined in all wealth quintiles between 1996 and 2016, reduction was relatively higher among the richer quintiles compared to poorer ones. The absolute difference between the poorest and the richest quintile increased from 24.7 in 1996 (64.5% in poorest - 39.8% in richest) to 32.7 percentage points in 2016 (49.2-16.5%). The relative disparity also increased; the ratio of stunting in the poorest to the richest quintile was 1.6 in 1996 and 3.0 in 2016. The concentration index increased (in absolute value) from - 0.078 in 1996 to - 0.147 in 2016 indicating that stunting was disproportionately concentrated in poorer households and socioeconomic inequalities worsened from 1996 to 2016. Decomposition analysis revealed that in 1996, wealth (61%), caste/ethnicity (12%), mother's education (12%) and birth order (9%) were the major contributors to observed socioeconomic inequalities in stunting; while in 2016, wealth (72%), mother's BMI (12%) and birth order (9%) were the major contributors.
Conclusions: Despite remarkable improvements in average stunting over the last two decades, substantial socioeconomic inequalities in stunting exists and is determined not only by immediate factors but also by underlying and contextual factors which emphasize the need for coherent actions across different sectors. In addition to reducing inequalities in wealth, nutrition programming should be focused on most disadvantaged subgroups which are prone to both stunting and relative poverty.
Keywords: Concentration index; Decomposition; Nepal; Nepal demographic and health survey; Predictors; Socioeconomic inequalities; Stunting.
Conflict of interest statement
Ethics approval and consent to participate
Not applicable since the study uses secondary data from the NDHS series.
Consent for publication
Not applicable.
Competing interests
The authors declare that they have no competing interests.
Publisher’s Note
Springer Nature remains neutral with regard to jurisdictional claims in published maps and institutional affiliations.
Figures
References
-
- World Health Organization . Nutrition Landscape Information System. Geneva: Switzerland World Health Organization; 2010.
-
- National Planning Commission [Government of Nepal]. Multi-sector Nutrition Plan I (2013-2017). Kathmandu: National Planning Commission. p. 2012.
-
- United Nations Children’s Fund, World Health Organization, World Bank Group. Levels and trends in child malnutrition: Key findings of the 2018 Edition of the Joint Child Malnutrition Estimates. p. 2018.
MeSH terms
LinkOut - more resources
Full Text Sources
Medical
