

Inflammatory, regulatory, and autophagy co-expression modules and hub genes underlie the peripheral immune response to human intracerebral hemorrhage
- PMID: 30836997
- PMCID: PMC6399982
- DOI: 10.1186/s12974-019-1433-4
Inflammatory, regulatory, and autophagy co-expression modules and hub genes underlie the peripheral immune response to human intracerebral hemorrhage
Abstract
Background: Intracerebral hemorrhage (ICH) has a high morbidity and mortality. The peripheral immune system and cross-talk between peripheral blood and brain have been implicated in the ICH immune response. Thus, we delineated the gene networks associated with human ICH in the peripheral blood transcriptome. We also compared the differentially expressed genes in blood following ICH to a prior human study of perihematomal brain tissue.
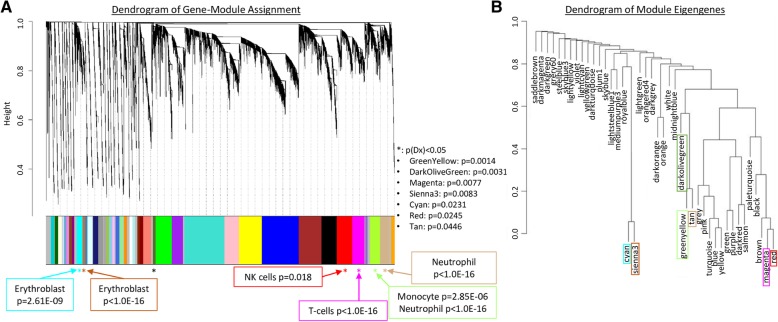
Methods: We performed peripheral blood whole-transcriptome analysis of ICH and matched vascular risk factor control subjects (n = 66). Gene co-expression network analysis identified groups of co-expressed genes (modules) associated with ICH and their most interconnected genes (hubs). Mixed-effects regression identified differentially expressed genes in ICH compared to controls.
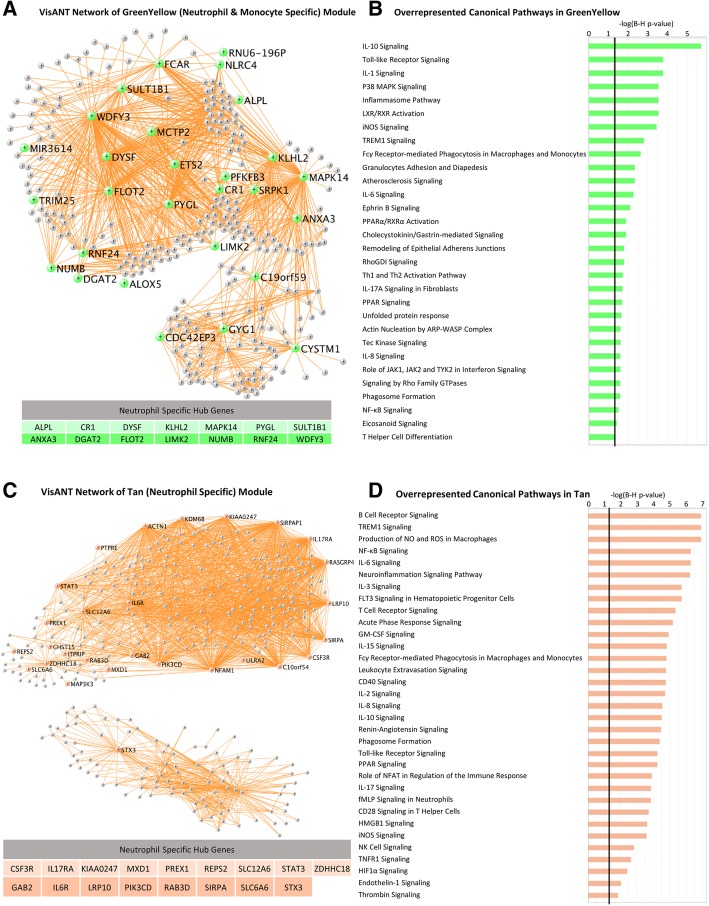
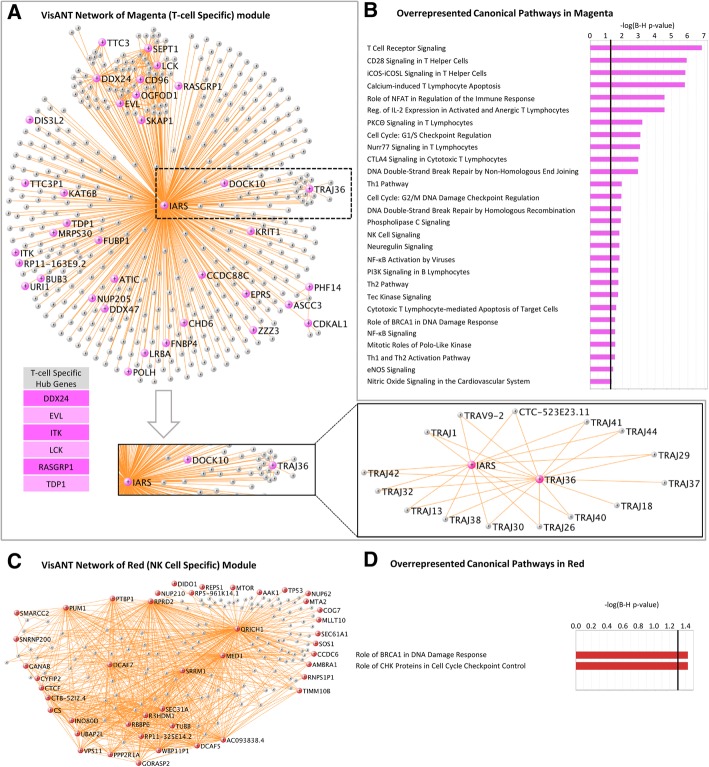
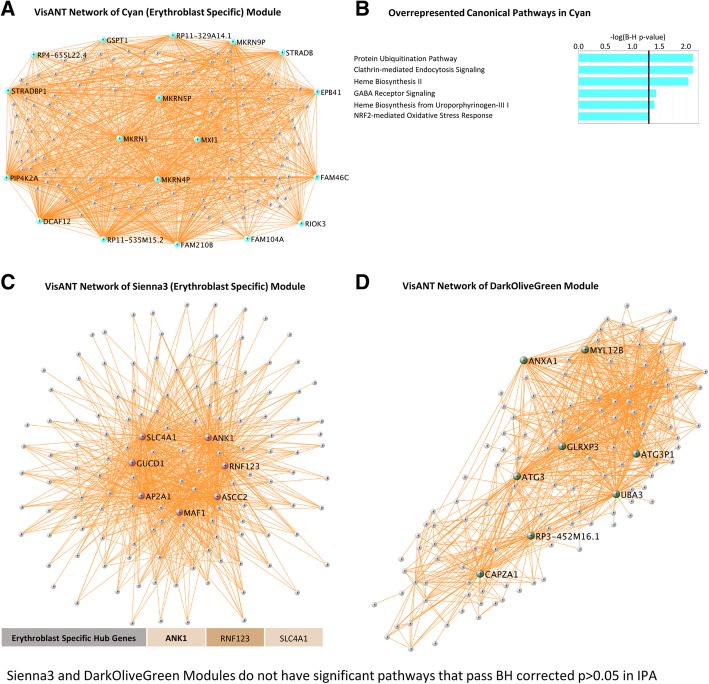
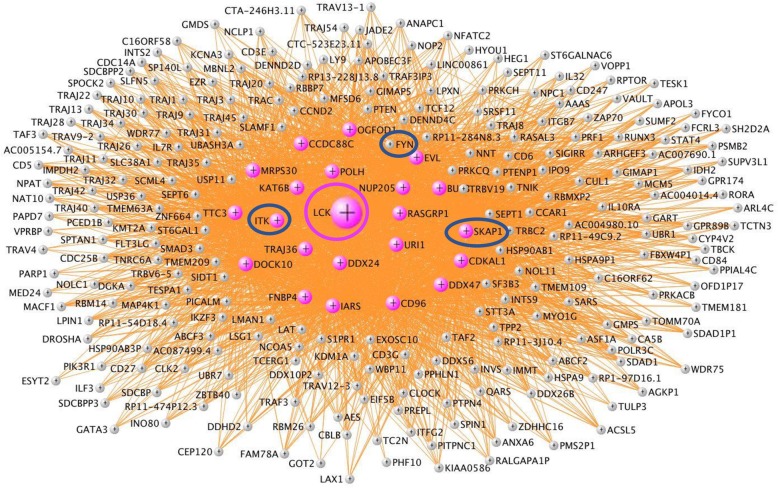
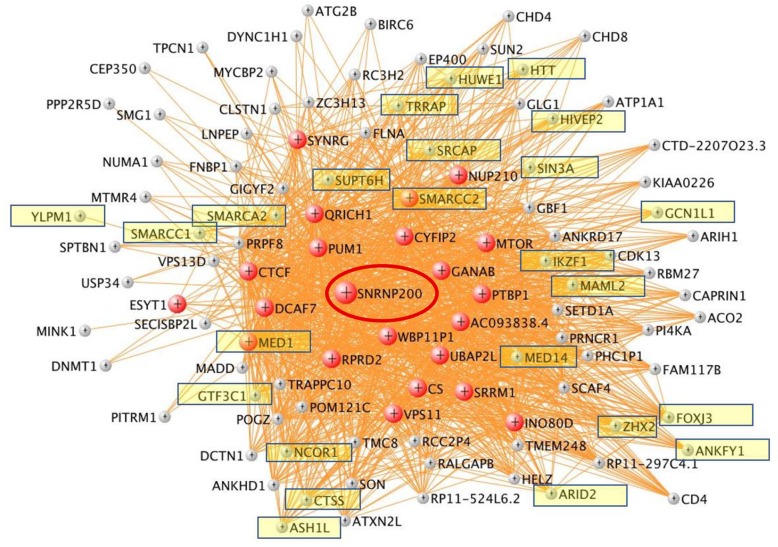
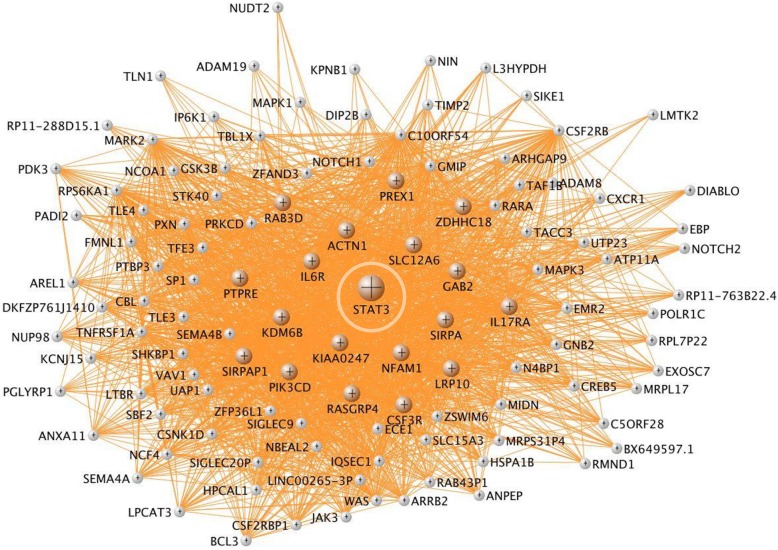
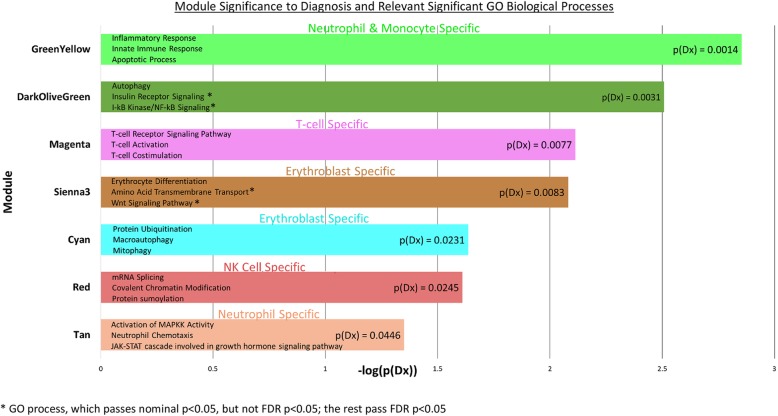
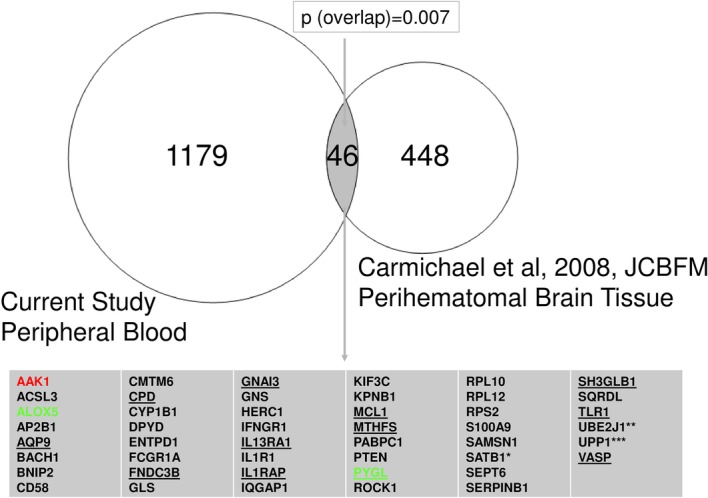
Results: Of seven ICH-associated modules, six were enriched with cell-specific genes: one neutrophil module, one neutrophil plus monocyte module, one T cell module, one Natural Killer cell module, and two erythroblast modules. The neutrophil/monocyte modules were enriched in inflammatory/immune pathways; the T cell module in T cell receptor signaling genes; and the Natural Killer cell module in genes regulating alternative splicing, epigenetic, and post-translational modifications. One erythroblast module was enriched in autophagy pathways implicated in experimental ICH, and NRF2 signaling implicated in hematoma clearance. Many hub genes or module members, such as IARS, mTOR, S1PR1, LCK, FYN, SKAP1, ITK, AMBRA1, NLRC4, IL6R, IL17RA, GAB2, MXD1, PIK3CD, NUMB, MAPK14, DDX24, EVL, TDP1, ATG3, WDFY3, GSK3B, STAT3, STX3, CSF3R, PIP4K2A, ANXA3, DGAT2, LRP10, FLOT2, ANK1, CR1, SLC4A1, and DYSF, have been implicated in neuroinflammation, cell death, transcriptional regulation, and some as experimental ICH therapeutic targets. Gene-level analysis revealed 1225 genes (FDR p < 0.05, fold-change > |1.2|) have altered expression in ICH in peripheral blood. There was significant overlap of the 1225 genes with dysregulated genes in human perihematomal brain tissue (p = 7 × 10⁻³). Overlapping genes were enriched for neutrophil-specific genes (p = 6.4 × 10-08) involved in interleukin, neuroinflammation, apoptosis, and PPAR signaling.
Conclusions: This study delineates key processes underlying ICH pathophysiology, complements experimental ICH findings, and the hub genes significantly expand the list of novel ICH therapeutic targets. The overlap between blood and brain gene responses underscores the importance of examining blood-brain interactions in human ICH.
Keywords: Autophagy; Co-expression networks; Gene expression; Gene networks; Hematoma; Hematoma clearance; ICH; Intracerebral hemorrhage; NRF2; Src kinase inhibitors.
Conflict of interest statement
Ethics approval and consent to participate
The protocol was approved by the UC Davis and UC San Francisco Institutional Review Boards and the University of Alberta Health Research Ethics Board and adheres to all federal and state regulations related to the protection of human research subjects, including The Common Rule, the principles of The Belmont Report, and Institutional policies and procedures. Written informed consent was obtained from all participants or their proxy.
Consent for publication
Not applicable.
Competing interests
The authors declare that they have no competing interests.
Publisher’s Note
Springer Nature remains neutral with regard to jurisdictional claims in published maps and institutional affiliations.
Figures
Similar articles
-
Molecular Correlates of Hemorrhage and Edema Volumes Following Human Intracerebral Hemorrhage Implicate Inflammation, Autophagy, mRNA Splicing, and T Cell Receptor Signaling.Transl Stroke Res. 2021 Oct;12(5):754-777. doi: 10.1007/s12975-020-00869-y. Epub 2020 Nov 18. Transl Stroke Res. 2021. PMID: 33206327 Free PMC article.
-
Exploring the pharmacological mechanism of Naoxueshu oral liquid in the treatment of intracerebral hemorrhage through weighted gene co-expression network analysis, network pharmacological and experimental validation.Phytomedicine. 2023 Jan;108:154530. doi: 10.1016/j.phymed.2022.154530. Epub 2022 Nov 3. Phytomedicine. 2023. PMID: 36356328
-
The Changes of Leukocytes in Brain and Blood After Intracerebral Hemorrhage.Front Immunol. 2021 Feb 15;12:617163. doi: 10.3389/fimmu.2021.617163. eCollection 2021. Front Immunol. 2021. PMID: 33659003 Free PMC article.
-
Activation of Nrf2 to Optimise Immune Responses to Intracerebral Haemorrhage.Biomolecules. 2022 Oct 7;12(10):1438. doi: 10.3390/biom12101438. Biomolecules. 2022. PMID: 36291647 Free PMC article. Review.
-
MicroRNAs modulate neuroinflammation after intracerebral hemorrhage: Prospects for new therapy.Front Immunol. 2022 Nov 1;13:945860. doi: 10.3389/fimmu.2022.945860. eCollection 2022. Front Immunol. 2022. PMID: 36389834 Free PMC article. Review.
Cited by
-
Monocyte/Macrophage Heterogeneity during Skin Wound Healing in Mice.J Immunol. 2022 Nov 15;209(10):1999-2011. doi: 10.4049/jimmunol.2200365. J Immunol. 2022. PMID: 36426946 Free PMC article.
-
Identification of Candidate Blood mRNA Biomarkers in Intracerebral Hemorrhage Using Integrated Microarray and Weighted Gene Co-expression Network Analysis.Front Genet. 2021 Jul 19;12:707713. doi: 10.3389/fgene.2021.707713. eCollection 2021. Front Genet. 2021. PMID: 34349791 Free PMC article.
-
Age-related changes after intracerebral hemorrhage: a comparative proteomics analysis of perihematomal tissue.Exp Biol Med (Maywood). 2024 Mar 25;249:10117. doi: 10.3389/ebm.2024.10117. eCollection 2024. Exp Biol Med (Maywood). 2024. PMID: 38590360 Free PMC article.
-
Long-term outcomes of monascin - a novel dual peroxisome proliferator-activated receptor γ/nuclear factor-erythroid 2 related factor-2 agonist in experimental intracerebral hemorrhage.Ther Adv Neurol Disord. 2020 May 14;13:1756286420921083. doi: 10.1177/1756286420921083. eCollection 2020. Ther Adv Neurol Disord. 2020. PMID: 32477427 Free PMC article.
-
Pro-repair macrophages driven by CGRP rescue white matter integrity following intracerebral hemorrhage.J Neuroinflammation. 2025 Jun 21;22(1):161. doi: 10.1186/s12974-025-03483-7. J Neuroinflammation. 2025. PMID: 40544251 Free PMC article.
References
-
- Benjamin EJ, Virani SS, Callaway CW, Chamberlain AM, Chang AR, Cheng S, et al. Heart disease and stroke statistics-2018 update: a report from the American Heart Association. Circulation. 2018;137(12):e211–e2e4. - PubMed
-
- Wang J, Dore S. Inflammation after intracerebral hemorrhage. J Cereb Blood Flow Metab. 2007;27(5):894–908. - PubMed
-
- Sacco S, Marini C, Toni D, Olivieri L, Carolei A. Incidence and 10-year survival of intracerebral hemorrhage in a population-based registry. Stroke. 2009;40(2):394–399. - PubMed
-
- Feigin VL, Lawes CM, Bennett DA, Barker-Collo SL, Parag V. Worldwide stroke incidence and early case fatality reported in 56 population-based studies: a systematic review. Lancet Neurol. 2009;8(4):355–369. - PubMed
MeSH terms
Substances
Grants and funding
LinkOut - more resources
Full Text Sources
Research Materials
Miscellaneous
