. 2019 May;9(5):617-627.
doi: 10.1158/2159-8290.CD-18-1212. Epub 2019 Mar 5.

A Stromal Lysolipid-Autotaxin Signaling Axis Promotes Pancreatic Tumor Progression

Affiliations

A Stromal Lysolipid-Autotaxin Signaling Axis Promotes Pancreatic Tumor Progression

Francesca R Auciello et al. Cancer Discov. 2019 May.

Abstract

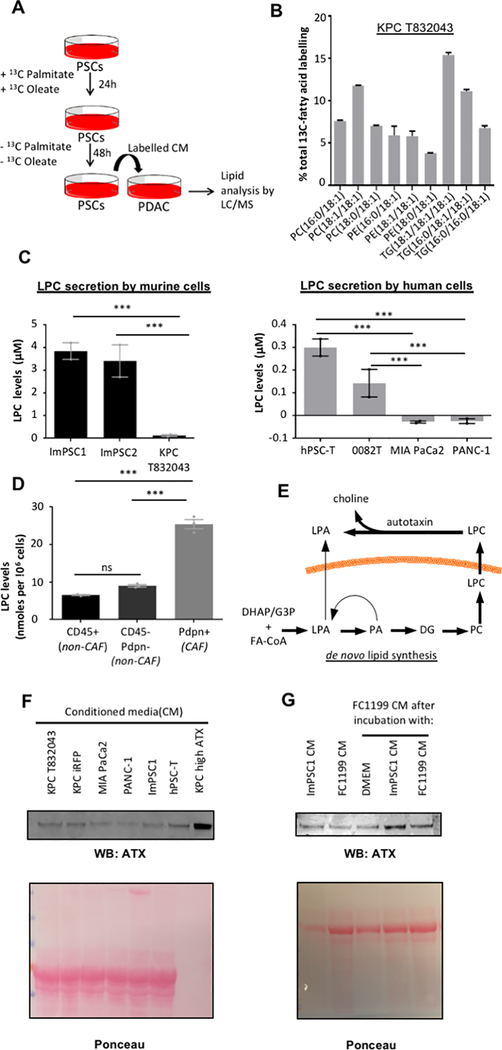
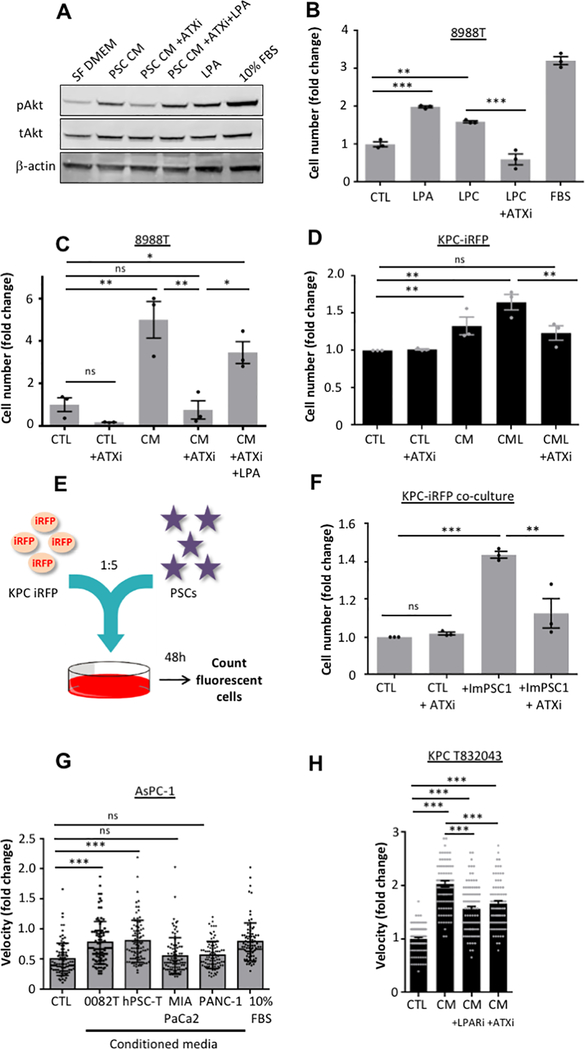
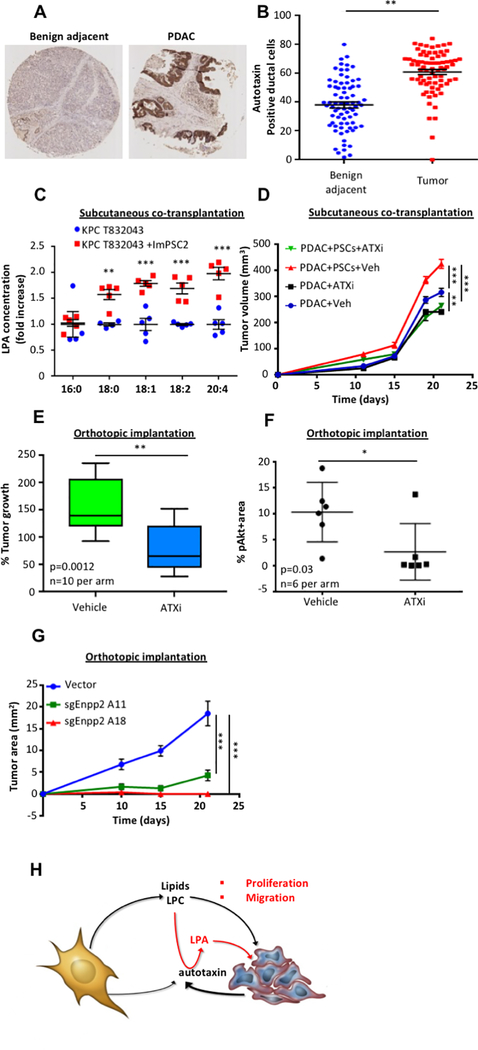
Pancreatic ductal adenocarcinoma (PDAC) develops a pronounced stromal response reflecting an aberrant wound-healing process. This stromal reaction features transdifferentiation of tissue-resident pancreatic stellate cells (PSC) into activated cancer-associated fibroblasts, a process induced by PDAC cells but of unclear significance for PDAC progression. Here, we show that PSCs undergo a dramatic lipid metabolic shift during differentiation in the context of pancreatic tumorigenesis, including remodeling of the intracellular lipidome and secretion of abundant lipids in the activated, fibroblastic state. Specifically, stroma-derived lysophosphatidylcholines support PDAC cell synthesis of phosphatidylcholines, key components of cell membranes, and also facilitate production of the potent wound-healing mediator lysophosphatidic acid (LPA) by the extracellular enzyme autotaxin, which is overexpressed in PDAC. The autotaxin-LPA axis promotes PDAC cell proliferation, migration, and AKT activation, and genetic or pharmacologic autotaxin inhibition suppresses PDAC growth in vivo. Our work demonstrates how PDAC cells exploit the local production of wound-healing mediators to stimulate their own growth and migration. SIGNIFICANCE: Our work highlights an unanticipated role for PSCs in producing the oncogenic LPA signaling lipid and demonstrates how PDAC tumor cells co-opt the release of wound-healing mediators by neighboring PSCs to promote their own proliferation and migration.See related commentary by Biffi and Tuveson, p. 578.This article is highlighted in the In This Issue feature, p. 565.


Conflict of interest statement

Conflict of interest disclosure statement: JJK is an employee and shareholder of Rheos Medicines Inc.

Figures

Figure 1:
Figure 1:. PSC activation leads to drastic lipid remodeling and profound lipid secretion
A, mRNA levels of Fabp4, Plin1 and Plin2 by real time PCR in pre-activated and activated murine primary PSCs. Expression normalized to housekeeping gene 36b4. Error bars represent s.d., n = 3 technical replicates from individually prepared samples from individual wells. B, Representative image of BODIPY staining (green) of lipid droplets in pre-activated (left panel) and activated primary murine PSCs (right panel). Nuclei were stained with DAPI (blue). C, Volcano plot showing changes in intracellular lipid levels upon activation of primary PSCs, as assessed by LC-MS. Data are from n = 2 individual wells per condition (pre-activated vs activated) with the primary cells obtained from a total of 9 mice, and are representative of multiple experiments. Significance determined by p value ≤0.05. D-E, Number of unique lipids identified for the indicated lipid classes in the medium conditioned by (D) primary PSCs, and (E) immortalized murine PSCs (ImPSC1) and immortalized human PDAC CAFs (0082T). Lipids identified in each of n = 3 individual wells of a representative experiment. Abbreviatons: Cer, ceramide; CerG, glucosylceramide; CerP, phosphatidylceramide; ChE, cholesterol-ester; cPA, cyclic phosphatidic acid; DG, diglyceride; FA, (free) fatty acid; LPA, lysophosphatidic acid; (L)PC, (lyso)phosphatidylcholine; (L)PE, (lyso)phosphatidylethanolamine; LPG, (lyso)phosphatidylglycerol; LPI, lysophosphatidylinositol LPS, (lyso)phosphatidylserine; n.s., non-significant; SM, sphingomyelin; TG, triglyceride.
Figure 2:
Figure 2:. PSC secreted lipids are a source for biomass and signaling molecules
A, Schematic of paracrine tracing experimental procedure: ImPSC1 were cultured with [U13C]-palmitate and [U13C]-oleate for 24h. Labeled fatty acids were removed and new medium was left to condition for 48h. Labelled CM was provided to KPC T832043 for 48h before intracellular lipid analysis by LC-MS lipidomics. B, Percentage labeling of intracellular lipids of KPC T832043 cells exposed to labeled CM from ImPSC1. Labelled isotopologs for each lipid were summed and expressed as a percentage of all isotopologs of that respective lipid. Error bars indicate s.d. of n = 3 individual wells of a representative labeling experiment. C, Lysophosphatidylcholine (LPC) levels in CM from murine (left panel) and human (right panel) PSCs and PDAC cells after 48h of conditioning, by LC-MS. Error bars represent s.e.m. of independent experiments (n =2), each conducted in triplicate wells. D, LPC levels in culture supernatants from the indicated cell populations (CD45+ leukocytes; Pdpn+ CAFs; and double-negative PDAC cells, endothelial cells, and other minor cell populations), isolated from murine PDAC by FACS and cultured ex vivo for 12h. Error bars represent s.e.m. of n = 3 tumors. E, Potential routes by which lysophosphatidic acid (LPA) can accumulate in PSC CM. F, Representative Western blot of autotaxin released into the CM by both PSCs (ImPSC1, hPSC-T) and PDAC (MIA PaCa2, PANC-1, KPC iRFP, KPC T832043) cells. KPC cells overexpressing autotaxin (KPC high ATX served as a positive control. G, Representative Western blot of autotaxin released into the CM by FC1199 PDAC cells, ImPSC, or FC1199 cultured with either CM (or SF DMEM control) for 24h. Significance determined by one-way ANOVA; ***, p ≤ 0.0001.
Figure 3:
Figure 3:. Stromal LPA induces AKT signaling, proliferation and migration of PDAC cells
A, Representative Western blot of phospho-AKT (Ser473) and total AKT in 8988T cells cultured in CAF 4414 CM in the presence or absence of HA130(ATXi) (10μM) and LPA 18:1 (10μM) for 5min. Serum-free DMEM (SF DMEM) and 10% FBS-DMEM were used as negative and positive controls, respectively. B, Proliferation after 72 hours (details in Methods) of 8988T cells in the presence of 10μM LPC 18:1 or LPA 18:1, with or without 10μM HA130 (ATXi). DMEM with 10% FBS was a positive control. Error bars indicate s.e.m. of independent experiments (n=3), each performed in triplicate wells. C, Proliferation after 72 hours of 8988T cells in CAF 4414 CM, with or without 10μM HA130 (ATXi) or 10μM LPA 18:1. Error bars indicate s.e.m. of independent experiments (n=3), each performed in triplicate wells. D, Proliferation after 72 hours of KPC-iRFP cells in ImPSC1 CM or the CM lipid fraction (CML), in the presence or absence of 10μM HA130 (ATXi). Error bars represent s.e.m. of independent experiments (n=3), each performed in triplicate wells. E, Schematic of experimental procedure: KPC cells expressing iRFP were seeded with ImPSCs in a ratio of 1:5. Cell fluorescence was monitored after 48h. F, KPC cells expressing iRFP co-cultured with ImPSC1 in presence or absence of HA130 (ATXi) (10μM). Proliferation of PDAC cells only was assessed by fluorescence. Error bars indicate s.e.m. of independent experiments (n = 3), each performed in triplicate wells. G, Velocity of AsPC-1 cells in a scratch wound assay (see Material and Methods) when incubated with CM from PSCs (0082T and hPSC-T) and PDAC (MIA PaCa-2 and PANC-1) cells. Error bars represent s.d. of 90 individual cells over triplicate wells from an experiment that was representative of 3 independent experiments. H, Scratch wound assay where KPC T832043 were incubated with CM from ImPSC1 in presence or absence of LPA receptor inhibitor Ki16425 (10μM) or autotaxin inhibitor HA130 (ATXi) (10μM). Velocity of cells was evaluated. Error bars represent s.d. of 90 individual cells in triplicate wells representative of 3 independent experiments. Significance determined by one-way ANOVA; * p ≤ 0.05,** p ≤ 0.001, ***, p ≤ 0.0001.
Figure 4:
Figure 4:. Autotaxin is highly expressed in tumors and its inhibition retards tumor growth
A, Representative tissue microarray (TMA) image from a set of 78 pancreatic cancer patients, with benign adjacent tissue (left panel) and PDAC tissue (right panel) stained for autotaxin. B, Quantification of autotaxin positive ductal cells in the benign adjacent tissue and in PDAC tissue from a set of 78 pancreatic cancer patients. C, Concentration of LPA in xenografts from CD-1 nude mice injected with either KPC T832043 or a combination of KPC T832043 and ImPSC2 in a ratio of 1:5. 5 mice per condition were used and horizontal lines indicate means and the whiskers minimum and maximum values. D, Tumor volumes from FC1199 cells upon subcutaneous transplantation into C57Bl/6J hosts, with or without ImPSC1 in a 1:5 ratio, treated with vehicle or ONO-8430506. Error bars represent s.e.m. of 10 mice per condition. E, Percent tumor growth assessed in mice orthotopically implanted with 4662 KPC cells, which leads to a spontaneous stromal response, and treated either with vehicle or with ONO-8430506. Treatment started 14 days after implantation and lasted 10 days, 10 mice were used and horizontal lines indicate means, the boxes interquartile ranges, and the whiskers minimum and maximum values. F, Quantification of pAkt IHC in mice orthotopically injected with 4662 KPC cells and treated with vehicle or ONO-8430506. 6 mice per condition were used and horizontal lines indicate means and the whiskers minimum and maximum values G, Tumor size from time of orthotopic transplantation in FVB/n hosts (vector, n=6; sgEnpp2 lines, n=8 per line) Error bars represent s.e.m. H, Activated PSCs abundantly release lipids, including LPCs, into the microenvironment. These lipids support PDAC membrane lipid synthesis. Additionally, LPCs can be converted to LPA by extracellular autotaxin. Through the LPA receptors located on PDAC cell membranes, LPAs modulate signaling of PDAC cells and consequently, their proliferation and migration. Significance was determined by paired t-test (B), multiple t-test (C), unpaired t-test (F, G), or two-way ANOVA (D, H); *p ≤ 0.05, ** p ≤ 0.005, *** p ≤ 0.001.

Comment in

References

    1. Rahib L, Smith BD, Aizenberg R, Rosenzweig AB, Fleshman JM, Matrisian LM. Projecting cancer incidence and deaths to 2030: the unexpected burden of thyroid, liver, and pancreas cancers in the United States. Cancer Res. 2014;74(11):2913–21. doi: 10.1158/0008-5472.CAN-14-0155. PubMed PMID: . - DOI - PubMed
    1. Neesse A, Algul H, Tuveson DA, Gress TM. Stromal biology and therapy in pancreatic cancer: a changing paradigm. Gut. 2015;64(9):1476–84. doi: 10.1136/gutjnl-2015-309304. PubMed PMID: . - DOI - PubMed
    1. Jacobetz MA, Chan DS, Neesse A, Bapiro TE, Cook N, Frese KK, et al. Hyaluronan impairs vascular function and drug delivery in a mouse model of pancreatic cancer. Gut. 2013;62(1):112–20. doi: 10.1136/gutjnl-2012-302529. PubMed PMID: ; - DOI - PMC - PubMed
    1. Provenzano PP, Cuevas C, Chang AE, Goel VK, Von Hoff DD, Hingorani SR. Enzymatic targeting of the stroma ablates physical barriers to treatment of pancreatic ductal adenocarcinoma. Cancer Cell. 2012;21(3):418–29. doi: 10.1016/j.ccr.2012.01.007. PubMed PMID: ; - DOI - PMC - PubMed
    1. Olive KP, Jacobetz MA, Davidson CJ, Gopinathan A, McIntyre D, Honess D, et al. Inhibition of Hedgehog signaling enhances delivery of chemotherapy in a mouse model of pancreatic cancer. Science. 2009;324(5933):1457–61. doi: 10.1126/science.1171362. PubMed PMID: ; - DOI - PMC - PubMed

Publication types

MeSH terms

Substances