. 2019 Mar 5;2(2):e201800150.
doi: 10.26508/lsa.201800150. Print 2019 Apr.

The small and large ribosomal subunits depend on each other for stability and accumulation

Affiliations

The small and large ribosomal subunits depend on each other for stability and accumulation

Brian Gregory et al. Life Sci Alliance. .

Erratum in

Abstract

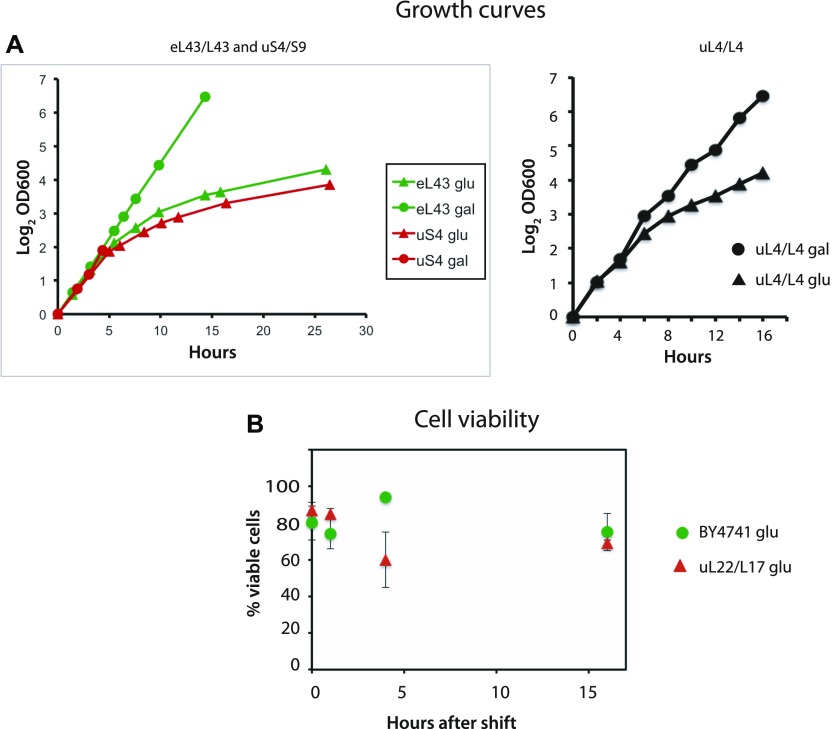
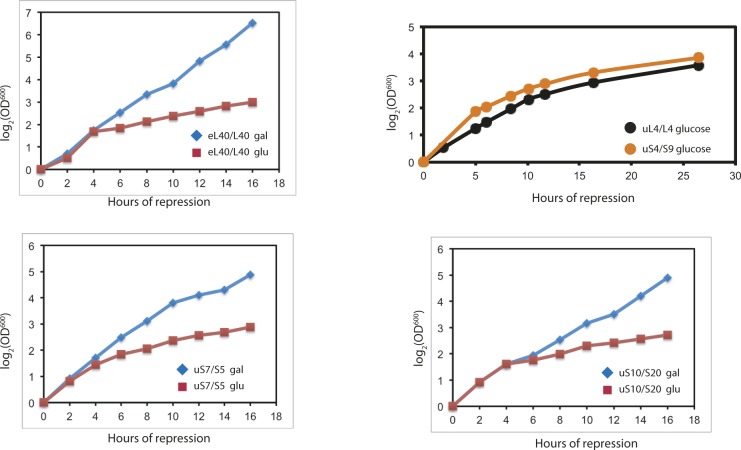
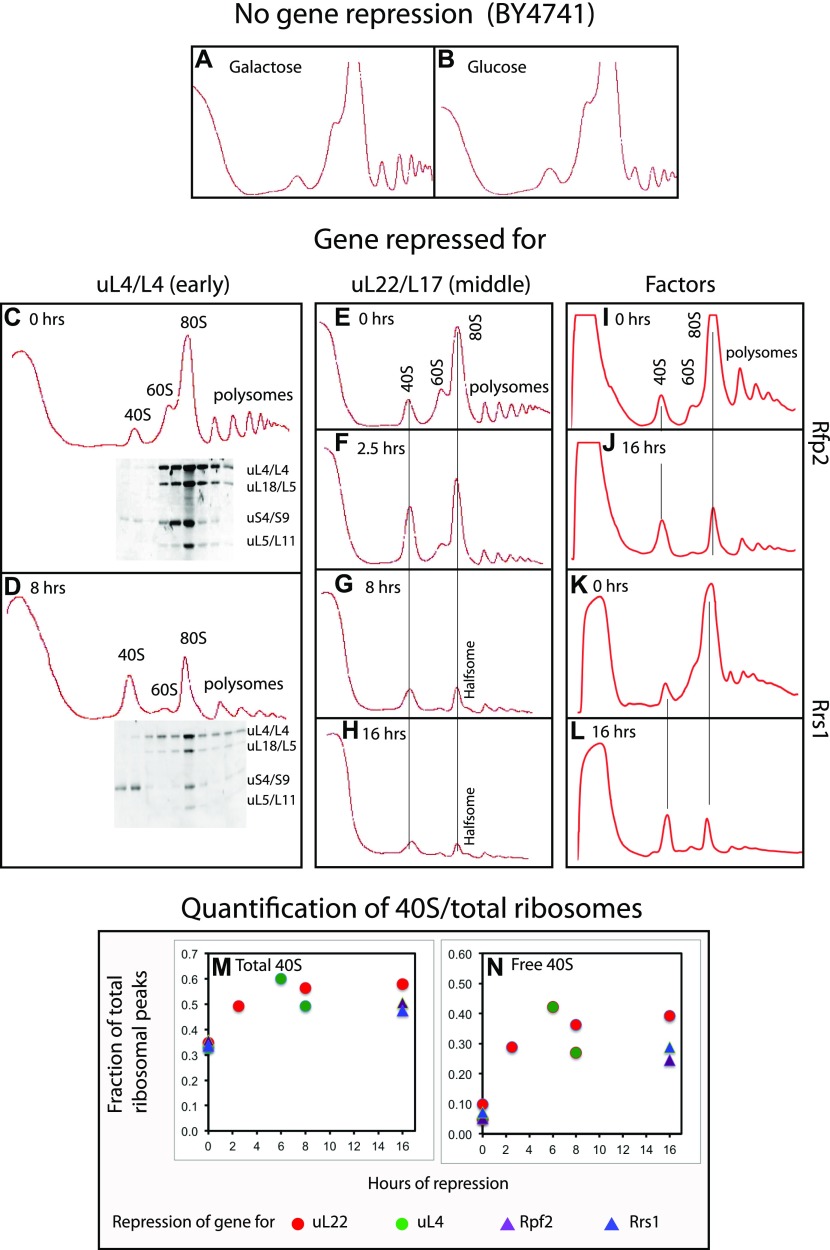
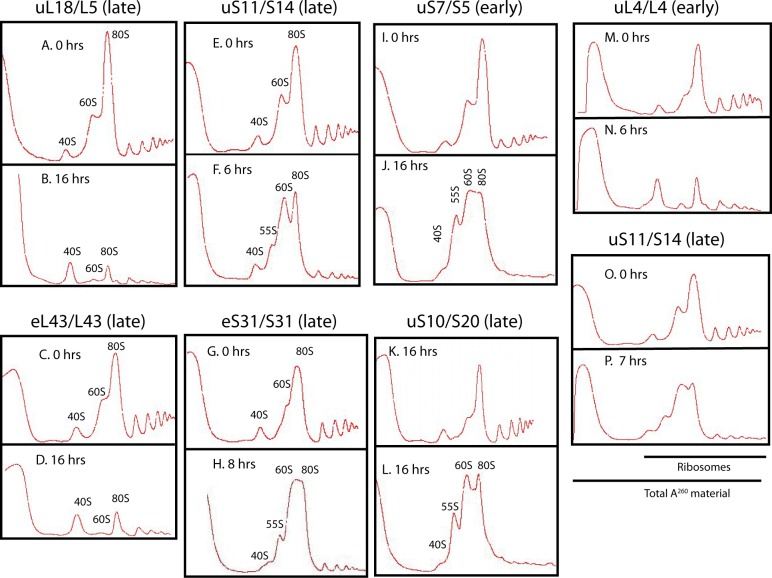
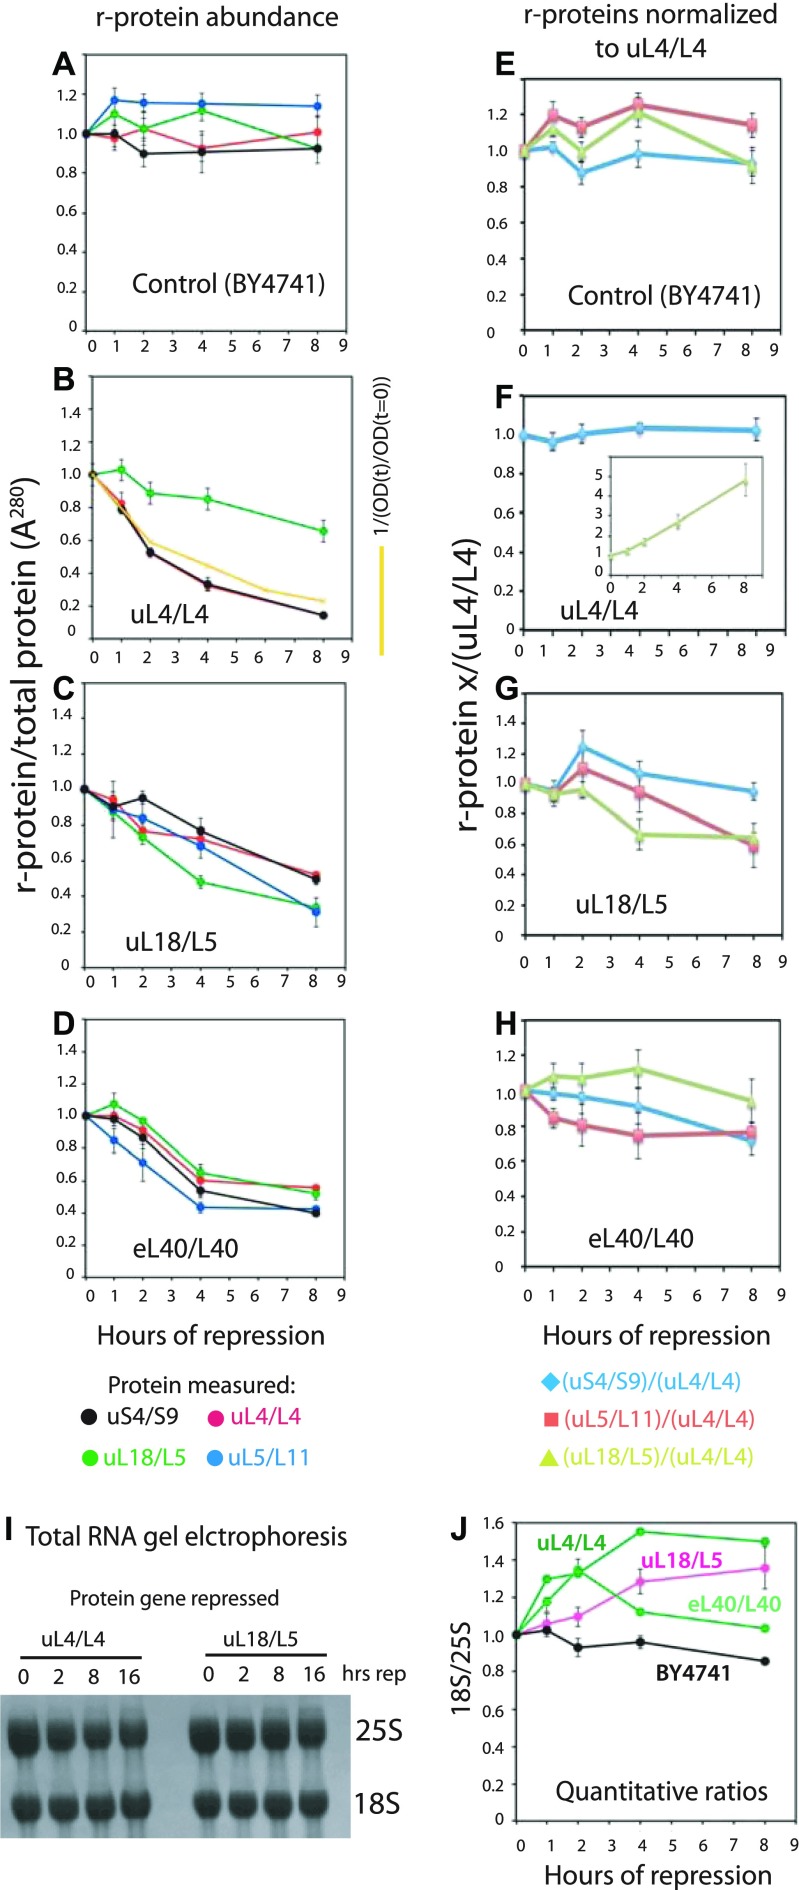
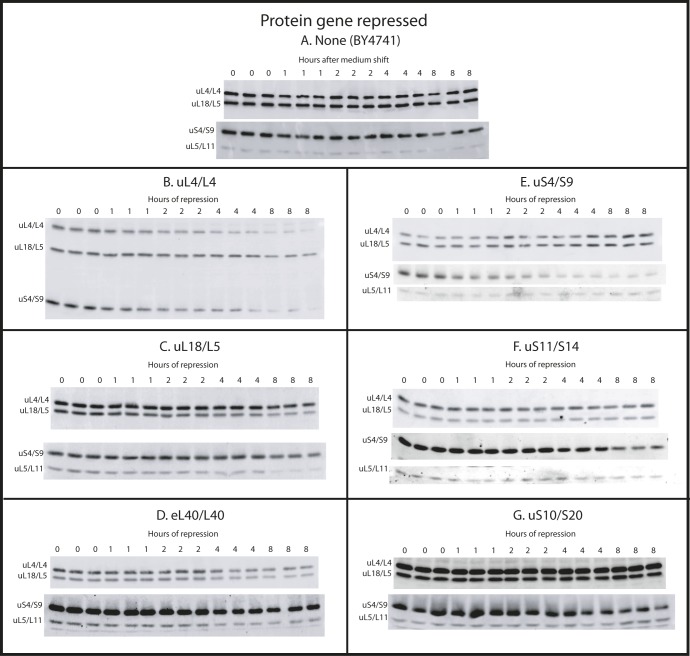
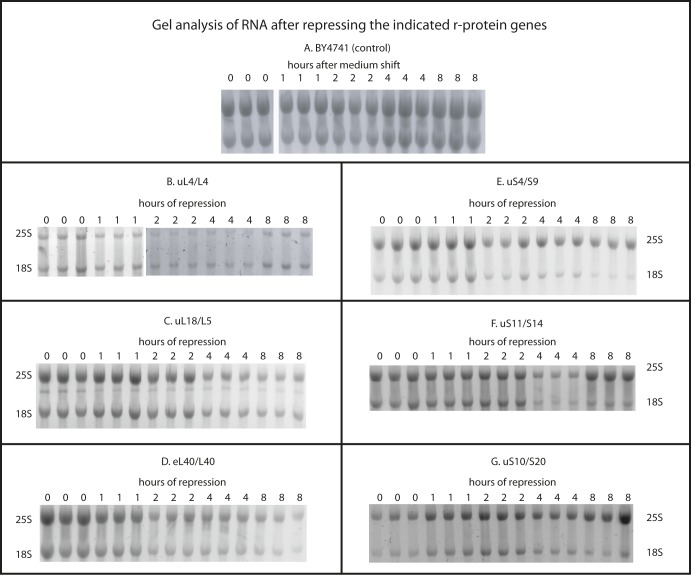
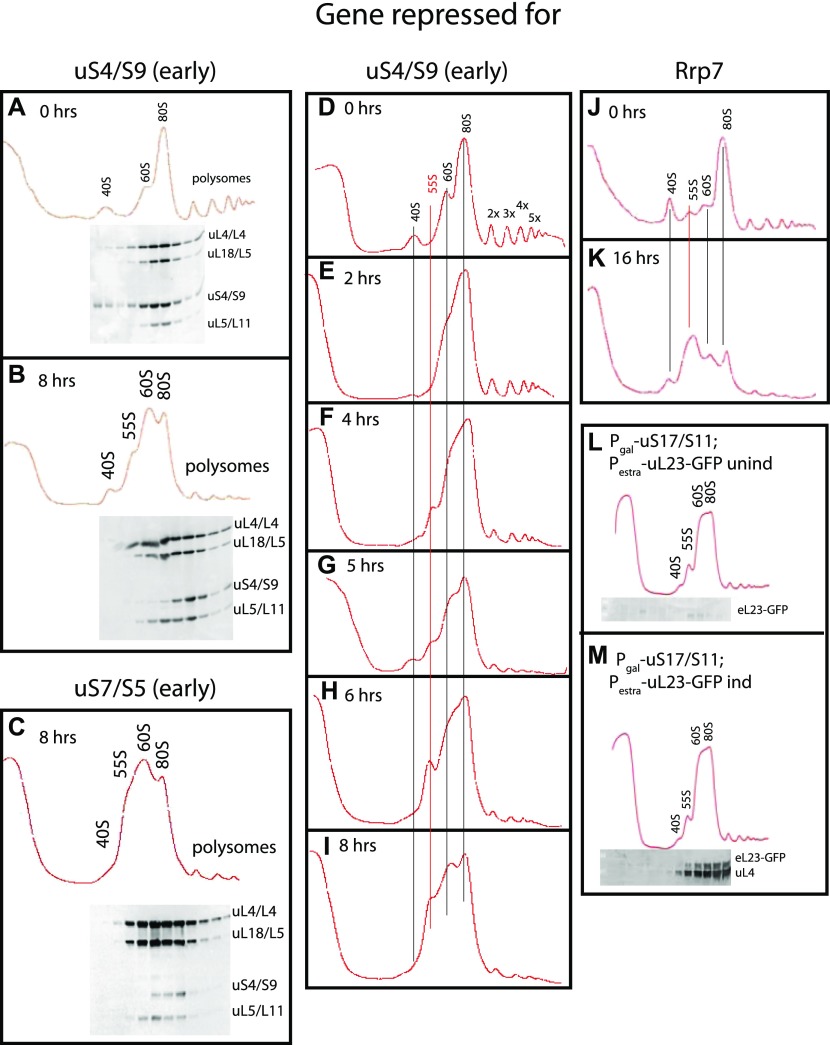
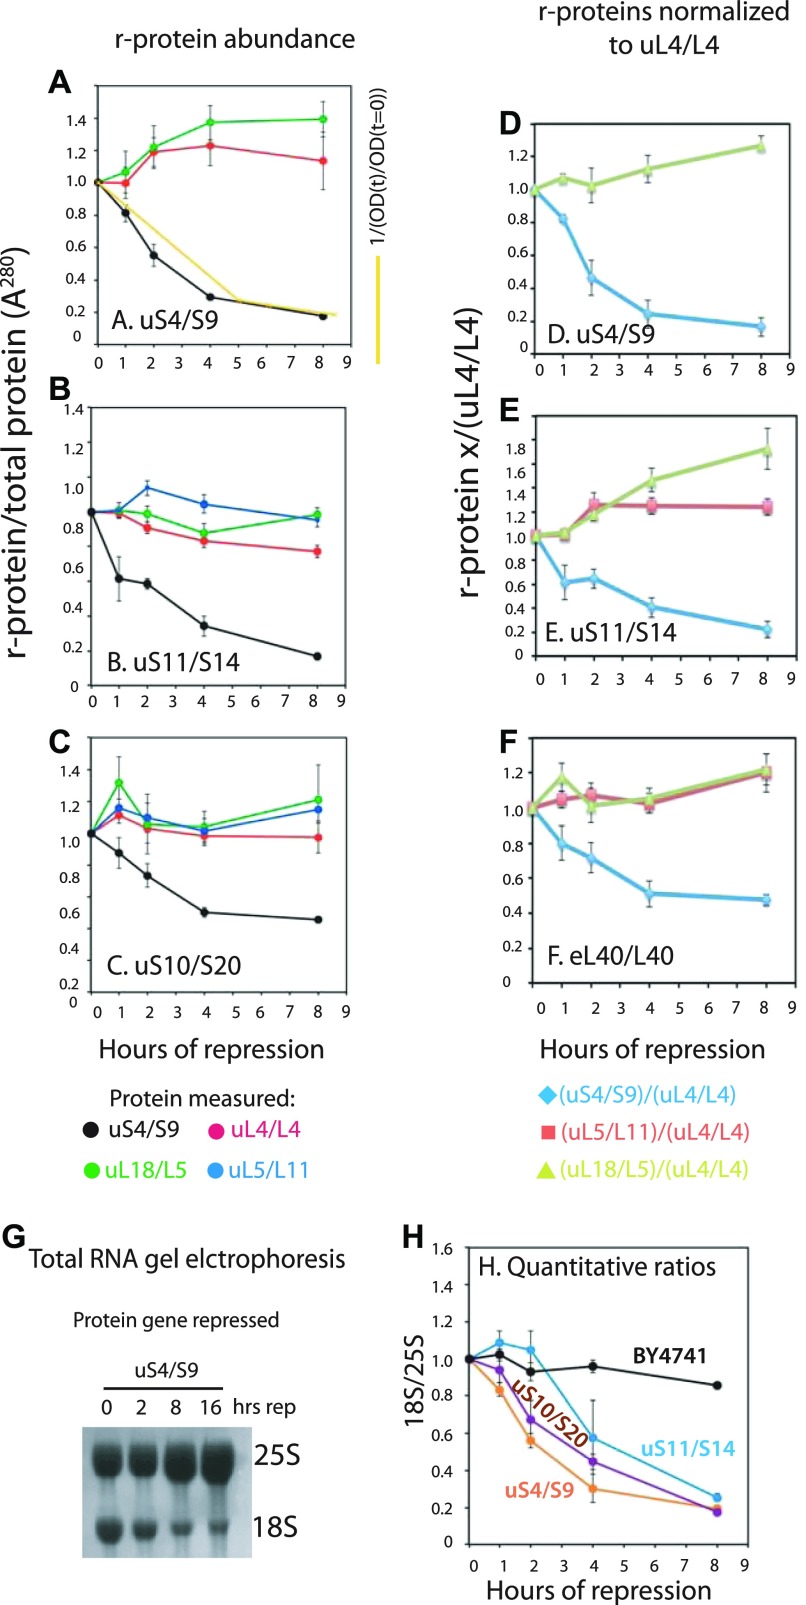
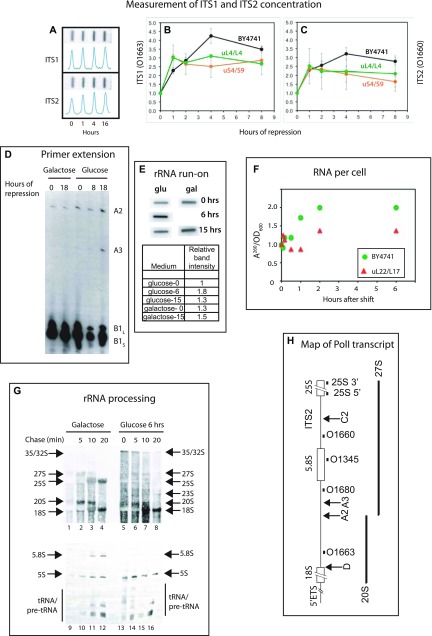
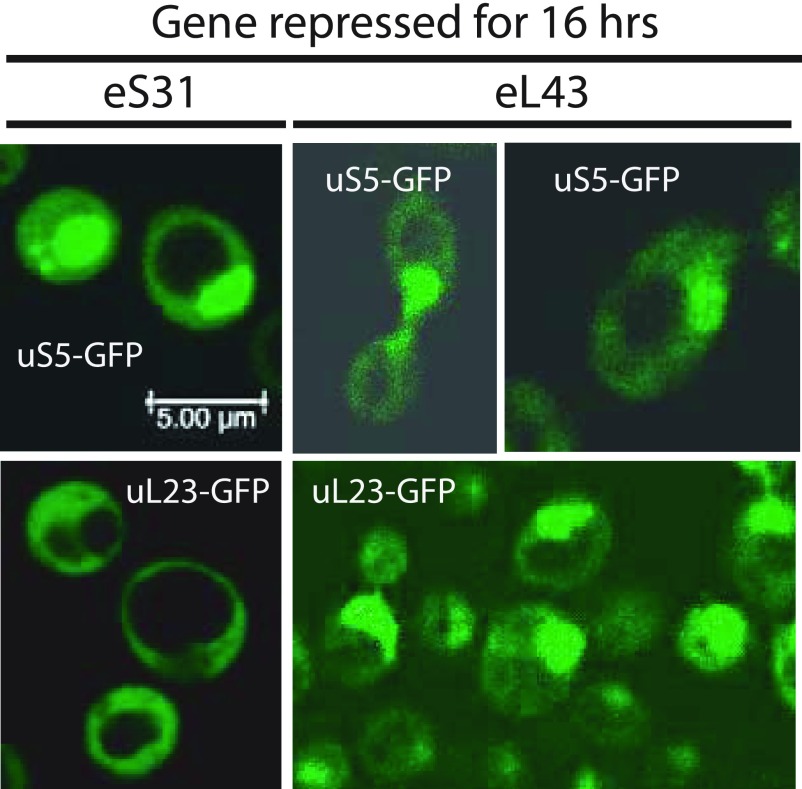
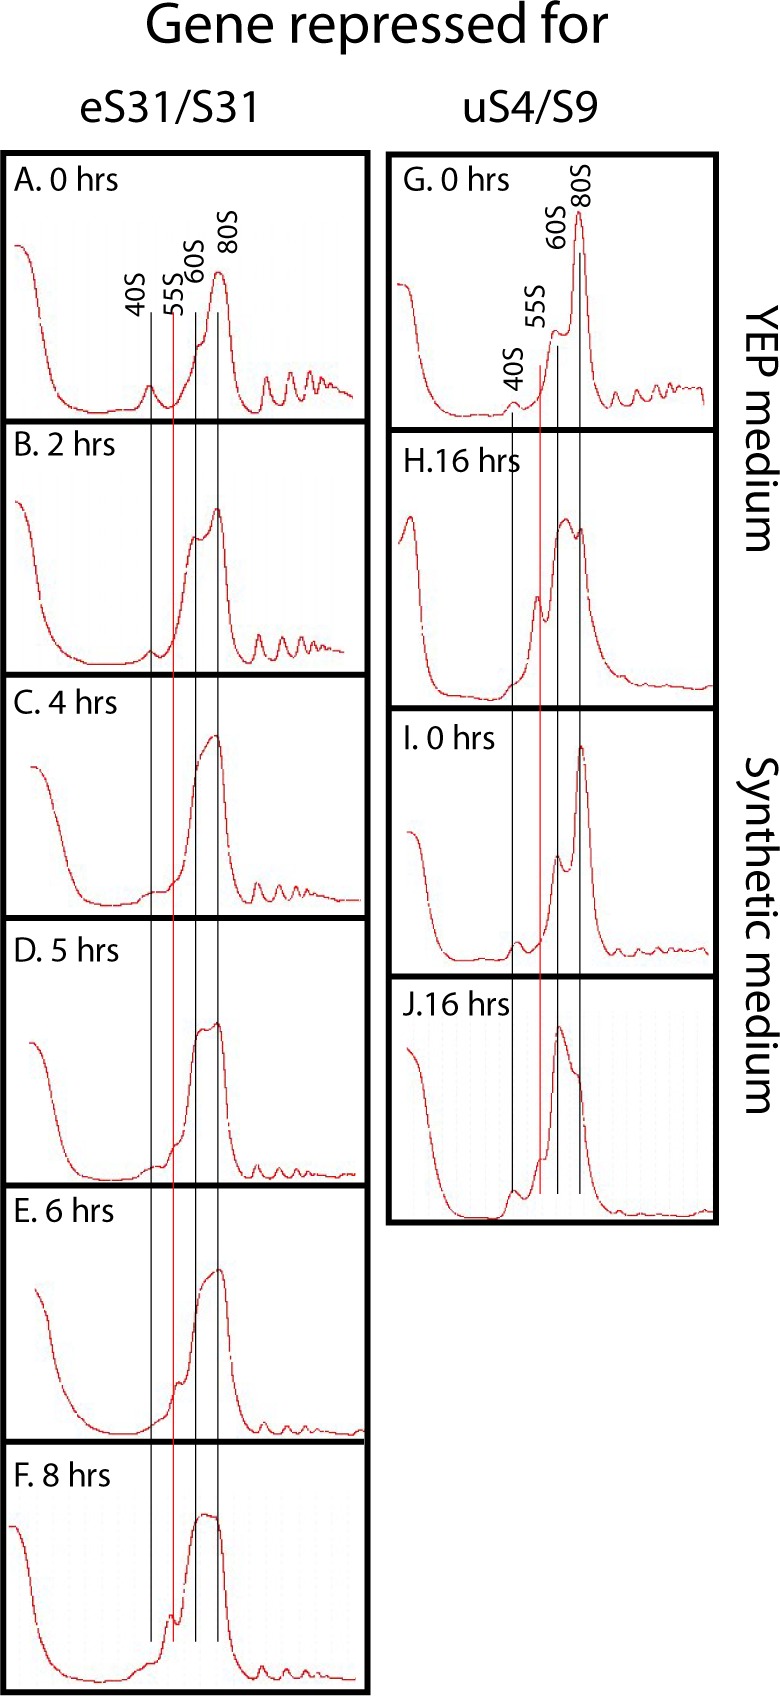
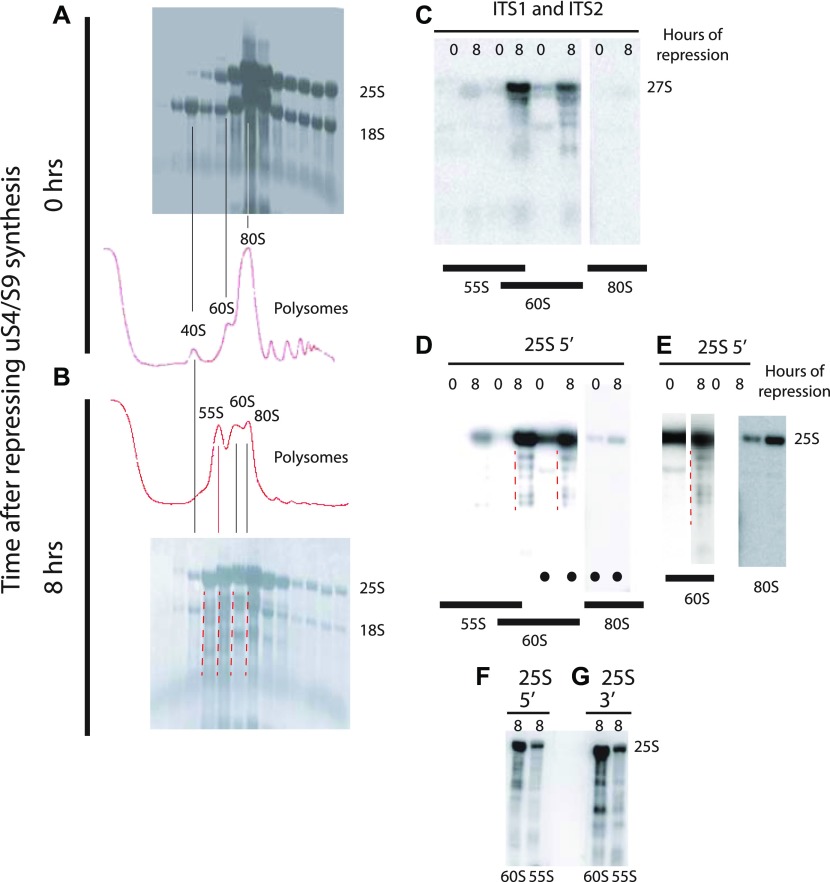
The 1:1 balance between the numbers of large and small ribosomal subunits can be disturbed by mutations that inhibit the assembly of only one of the subunits. Here, we have investigated if the cell can counteract an imbalance of the number of the two subunits. We show that abrogating 60S assembly blocks 40S subunit accumulation. In contrast, cessation of the 40S pathways does not prevent 60S accumulation, but does, however, lead to fragmentation of the 25S rRNA in 60S subunits and formation of a 55S ribosomal particle derived from the 60S. We also present evidence suggesting that these events occur post assembly and discuss the possibility that the turnover of subunits is due to vulnerability of free subunits not paired with the other subunit to form 80S ribosomes.


Conflict of interest statement

The authors declare that they have no conflict of interest.

Figures

Figure 1.
Figure 1.. Growth curves and cell viability.
(A) Pgal-S4, Pgal-eL43, and Pgal-uL4 were grown in YEP-galactose medium. At time 0, one part of each culture was shifted to glucose medium (YPD), and the OD600 of the unshifted and shifted cultures was recorded at the indicated times. (B) Pgal-uL22 and the control strain BY4741 were shifted from galactose to glucose medium. Aliquots of the unshifted and shifted cultures were removed, and the total number of cells was counted under a microscope and viable cells (colony-forming units) were determined by plating on YEP-galactose medium.
Figure S1.
Figure S1.. Growth curves for the indicated strains before and after the shift from YEP-galactose to YPD glucose.
Part of each culture was shifted to YPD at time 0.
Figure 2.
Figure 2.. Sucrose gradient analysis of ribosomes after repressing the genes for 60S r-proteins uL4 and uL22 and 60S assembly factors Rpf2 and Rrs1.
Cultures were grown in YEP-galactose medium and shifted to YPD glucose medium for the indicated lengths of time before harvest. (A, B) The control strain BY4741 in galactose and glucose medium, respectively. (C, D) Pgal-uL4 at 0 and 8 h, respectively. (E–H) Pgal-uL22 at 0, 2.5, 8, and 16 h, respectively. (I, J) Pgal-Rpf2 at 0 and 16 h, respectively. (K, L) Pgal-Rrs1 at 0 and 16 h, respectively. For C and D, equal volumes of fractions in the ribosome portion of the gradient were analyzed for r-proteins uS4, uL4, uL5, and uL18 by Western blot. (M, N) Quantification of 40S subunits. The area under each ribosomal peek was measured using ImageJ and normalized to the area under all ribosomal peaks. (M) The fraction of ribosomal mass in 40S subunits was calculated as the fraction found in the free 40S peak plus 1/3 of the fraction in 80S and polysomes. (N) The fraction of ribosomal mass in free 40S subunits. Red and green circles refer to repression of uL22 and uL4 synthesis, respectively. Purple and blue triangles refer to repression of Rpf2 and Rrs1 synthesis, respectively.
Figure S2.
Figure S2.. Sucrose gradient analysis of ribosomes after abrogating assembly of the 40S or 60S ribosomal subunit.
(A–P) Sucrose gradient analysis of ribosomes before and after the cessation of the synthesis of the indicated 60S (A–D and M–N) or 40S (E–L and O–P) r-proteins. Cells were grown in YEP-galactose medium and shifted to YPD medium for the indicated time before harvest. In panels M–O, the spectrophotometer was started a little earlier during gradient tapping to ensure capturing the full peak of A260 material at the top of the gradient.
Figure 3.
Figure 3.. Quantification of ribosomal components from both subunits covary after repression of genes for 60S r-proteins.
Cultures of BY4741, Pgal-uL4, Pgal-uL18, and Pgal-eL40 were grown in YEP-galactose and shifted to YPD. (A–D) Aliquots were harvested at 0, 1, 2, 4, and 8 h and constant A280 units from each sample were analyzed by Western blots probed with antisera for uS4, uL4, uL5, and uL18. The intensities of the Western bands were quantified using ImageJ. The yellow curve in (panel B) indicates the calculated dilution curve after repressing uL4 synthesis. (E–H) Data from A–D were normalized to the values for uL4. (I, J) Ratio between 18S and 25S rRNA. Total RNA was purified using RiboPure (I) or hot phenol extraction (J). Equal A260 units of each sample (0.06 corresponding to ∼3 μg) were applied to agarose gels (I). Bands were blotted to a membrane and stained with methylene blue. (J) Gel was stained with ethidium bromide, photographed on a gel imaging system, and quantified with ImageJ. Images of the Western blots are shown in Fig S3. Fig S4 shows images of the ethidium bromide stained gels. Source data are available for this figure.
Figure S3.
Figure S3.. Western blots of r-proteins uS4, uL4, uL5, and uL18 after repression of synthesis of various r-proteins.
(A–G) Cultures of strains in which BY4741 (A), uL4 (B), uL18 (C), eL40 (D), uS4 (E), uS11 (F), or uS10 (G) are under galactose control were grown in galactose medium and shifted to glucose medium. At the indicated times, aliquots were harvested and subjected to Western analysis using antisera for the indicated proteins. Samples from three independent cultures were loaded on the same gel. Source data are available for this figure.
Figure S4.
Figure S4.. Agarose gel electrophoresis of rRNA after repression of r-protein synthesis.
(A–G) Cultures of strains in which BY4741 (A), uL4 (B), uL18 (C), eL40 (D), uS4 (E), uS11 (F), or uS10 (G) are under galactose control were grown in galactose medium and shifted to glucose medium. At the indicated times, total RNA was prepared by the hot phenol method and fractionated on agarose gels. The figure shows images of gels stained with ethidium bromide.
Figure 4.
Figure 4.. Sucrose gradient analysis of ribosomes after repressing the genes for the 40S r-proteins uS4 and uS7 and 40S assembly factor Rrp7.
Cultures in YEP-galactose medium were shifted to glucose medium for the indicated lengths of time before harvest. (A, B) Pgal-uS4 at 0 and 8 h, respectively. (C) Pgal-uS7 at 8 h (D–I) Pgal-uS4 at 0, 2, 4, 5, 6, and 8 h, respectively. (J, K) Pgal-Rrp7 at 0 and 16 h, respectively. For A–C, equal volumes of fractions in the ribosome portion of the gradient were analyzed for r-proteins uS4, uL4, uL5, and uL18 by Western blot. (L, M) uL23-GFP synthesized during repression of the uS17 gene is incorporated into 80S ribosomes. Pgal-uS17 harboring an estradiol-inducible uL23-GFP gene was grown in synthetic galactose medium and shifted to synthetic glucose medium. 8 h after the shift, uL23-GFP synthesis was induced for 1 h. The indicated fractions were probed by Western analysis for GFP and uL4 proteins.
Figure 5.
Figure 5.. Quantification of ribosomal components from both subunits do not covary after repression of genes for 40S r-proteins.
Cultures of Pgal-uS4, Pgal-uS11, and Pgal-uS10 were grown in YEP-galactose and shifted to YPD. The control experiment with BY4741 is shown in Fig 3A and E. (A–C) Aliquots were harvested at 0, 1, 2, 4, and 8 h and equal A280 units from each sample were analyzed by Western blots probed with antisera for uS4, uL4, uL5, and uL18. The intensities of the Western bands were quantified using ImageJ. The yellow curve in panel A indicates the dilution curve calculated from the growth curve after repressing uS4 synthesis. (D–F) Data from A–C were normalized to the values for uL4. (G, H) Ratio between 18S and 25S rRNA. Total RNA was purified using RiboPure (G) or hot phenol extraction (H). Equal A260 units of each sample (0.06 corresponding to ∼3 μg) were applied to agarose gels. (G) Bands were blotted to a membrane and stained with methylene blue. (H) Gel was stained with ethidium bromide, photographed on a gel imaging system, and quantified with ImageJ. Images of the Western blots are shown in Fig S3. Fig S4 shows images of the ethidium bromide stained gels. Source data are available for this figure.
Figure 6.
Figure 6.. Transcription and maturation of rRNA after repression of 40S and 60S r-protein synthesis.
(A–C, F) The control strain BY4741 and strains in which the indicated proteins were expressed from the galactose promoter were grown in YEP-galactose (A–C, F) or synthetic complete galactose medium lacking uracil (panels D, E, and G). At time 0, the cultures were shifted to glucose medium for the indicated time. (A–C) Measurement of the sum of transcripts containing ITS1 and ITS2. Total RNA from BY4741, Pgal-uL4, and Pgal-uS4 was purified, and equal A260 units were loaded onto a nylon membrane in a slot format (A). The membrane was probed with ITS1 oligonucleotide O1663 (B) or ITS2 oligonucleotide O1660 (C); see panel H for the position of the sequences to which they hybridize. (D) Analysis of 5′ ends at sites A2 and A3 in rRNA processing intermediates. 32P end-labeled primer O1345 (panel G) was hybridized to equal amounts of total RNA from Pgal-uL4 (YLL2083) and extended to 5′ ends of processing intermediates generated by cleavage A2 and A3 (see panel H). (E) Run-on analysis of rRNA transcription during repression of uL4 synthesis. Aliquots of cultures of Pgal-uL4 (YLL2083) growing in synthetic medium were harvested at the indicated times after the shift to glucose medium. Equal A260 units from each sample were used for run-on labeling with α-32ATP. The products were hybridized to slot blots of pDK16 carrying the 35S rRNA transcription unit (Lindahl et al, 1994). (F) Yield of A260 material per OD600 units of culture harvested. Equal OD600 units of Pgal-uL22 and BY4741 were harvested at the indicated times. Total RNA was prepared by the hot phenol method and the A260 of the final preparation was measured and normalized to time 0. (G) Pulse-chase analysis of rRNA processing during repression of uL4 synthesis. Pgal-uL4 (YLL2083) was grown in synthetic medium and harvested 0 or 6 h after the shift to glucose medium. The cells were labeled with 3H-uracil for 2 min and then incubated (chased) with a large excess of nonradioactive uracil for the indicated times. RNA was extracted and equal amounts of radioactivity from each sample were then fractionated by agarose gel electrophoresis, transferred to a membrane, and visualized by fluorography. (H) Map of the yeast Pol I rRNA transcription unit. The black boxes immediately below the map show the positions of the oligonucleotide probes used. The arrows labeled D, A2, A3, and C2 indicate cleavage sites relevant for this study. Other processing sites are omitted. The major rRNA processing intermediates (20S and 27S) are indicated below the map. For more details on rRNA processing, see Woolford & Baserga (2013). Source data are available for this figure.
Figure 7.
Figure 7.. Cellular localization of r-proteins during repression of a 40S or a 60S r-protein gene.
Pgal-eS31 or Pgal-eL43, each carrying plasmid-borne genes for uS5-GFP or uL23-GFP expressed from their native promoters, were grown in synthetic galactose medium and shifted to synthetic glucose medium for 16 h. The cells were inspected by confocal microscopy. A uniform distribution of the GFP-tagged protein between the nucleus and cytoplasm indicates that the export of ribosomal precursor particles carrying the tagged protein is normal. A buildup of the GFP-tagged in the nucleus indicates that ribosomal precursor particles carrying the tagged protein are not matured to nuclear export competency.
Figure S5.
Figure S5.. Kinetics of the formation of the 55S peak.
(A–F) Pgal-eS31 was grown in YEP-galactose medium and shifted to glucose medium for the indicated lengths of time before harvesting. (G–J) Effect of growth medium on the level of the 55S particle. Pgal-uS4 was grown in YEP-galactose medium or synthetic complete galactose medium and shifted to the same media, but with glucose as carbon source. (G–J) YEP medium at 0 h (G), YEP medium at 8 h (H), synthetic medium at 0 h (I), and Synthetic medium at 8 h (J).
Figure 8.
Figure 8.. Analysis of the 55S peak appearing after repressing the gene for 40S r-protein uS4.
Pgal-uS4 was grown in YEP-galactose medium, and aliquots were harvested at 0 h and 8 h after the shift to glucose medium. (A, B) Equal A260 units of whole cell extracts were fractionated on sucrose gradients and equal portions of the fractions sedimenting as 40S or larger particles were fractionated on an agarose gel, transferred to a membrane, and stained with methylene blue. (C) Equal portions of fractions from identical positions in a set of sucrose gradients from a biological replicate experiment were loaded into alternate slots of an agarose gel, transferred to a membrane, and probed with a mixture of equal radioactivity of end-labeled oligonucleotides O1680 and O1660 that hybridize to ITS1 (distal to the A2 processing site) and ITS2 (Fig 3H). (D) The membrane was then stripped of radioactivity and probed with an oligonucleotide specific to the 5′ end of 25S rRNA. The positions of the A260 peaks in the gradients are indicated below the images of the membrane in (C, D). (E) Lanes marked with black dots in panel (D) were excised electronically from the image in (D) and optimized for viewing of the individual lanes. (F–G) Northern blots of RNA from the 55S and 60S fractions of a sucrose gradient of samples harvested 8 h after addition of glucose and probed with radioactive oligonucleotides hybridizing to the 5′ (panel F) or the 3′ (panel G) ends of 25S rRNA. Broken red lines to the left of the relevant lanes indicate rRNA degradation products.
Figure S6.
Figure S6.. Titration of antisera against the amount of extract loaded on Western blots.
Slots of a 15% SDS polyacrylamide gel were loaded with increasing numbers of A280 units of whole cell lysate from BY4741 grown in YEP-galactose medium. After electrophoresis and blotting, the membrane was probed with a cocktail of antisera against uS4, uL4, uL5, or uL18. The intensity of the bands was determined using ImageJ, and the relative band intensities are plotted against the number of A280 units loaded in each slot.

Similar articles

Cited by

References

    1. Axt K, French SL, Beyer AL, Tollervey D (2014) Kinetic analysis demonstrates a requirement for the Rat1 exonuclease in cotranscriptional pre-rRNA cleavage. PLoS One 9: e85703 10.1371/journal.pone.0085703 - DOI - PMC - PubMed
    1. Ban N, Beckmann R, Cate JH, Dinman JD, Dragon F, Ellis SR, Lafontaine DL, Lindahl L, Liljas A, Lipton JM, et al. (2014) A new system for naming ribosomal proteins. Curr Opin Struct Biol 24: 165–169. 10.1016/j.sbi.2014.01.002 - DOI - PMC - PubMed
    1. Bassler J, Hurt E (2018) Eukaryotic ribosome assembly. Annu Rev Biochem 88: 8.1–8.26. 10.1146/annurev-biochem-013118-110817 - DOI - PubMed
    1. Ben-Shem A, Garreau de Loubresse N, Melnikov S, Jenner L, Yusupova G, Yusupov M (2011) The structure of the eukaryotic ribosome at 3.0 Å resolution. Science 334: 1524–1529. 10.1126/science.1212642 - DOI - PubMed
    1. Bernstein KA, Bleichert F, Bean JM, Cross FR, Baserga SJ (2007) Ribosome biogenesis is sensed at the Start cell cycle checkpoint. Mol Biol Cell 18: 953–964. 10.1091/mbc.e06-06-0512 - DOI - PMC - PubMed

Publication types

MeSH terms

LinkOut - more resources