

Introducing THOR, a Model Microbiome for Genetic Dissection of Community Behavior
- PMID: 30837345
- PMCID: PMC6401489
- DOI: 10.1128/mBio.02846-18
Introducing THOR, a Model Microbiome for Genetic Dissection of Community Behavior
Abstract
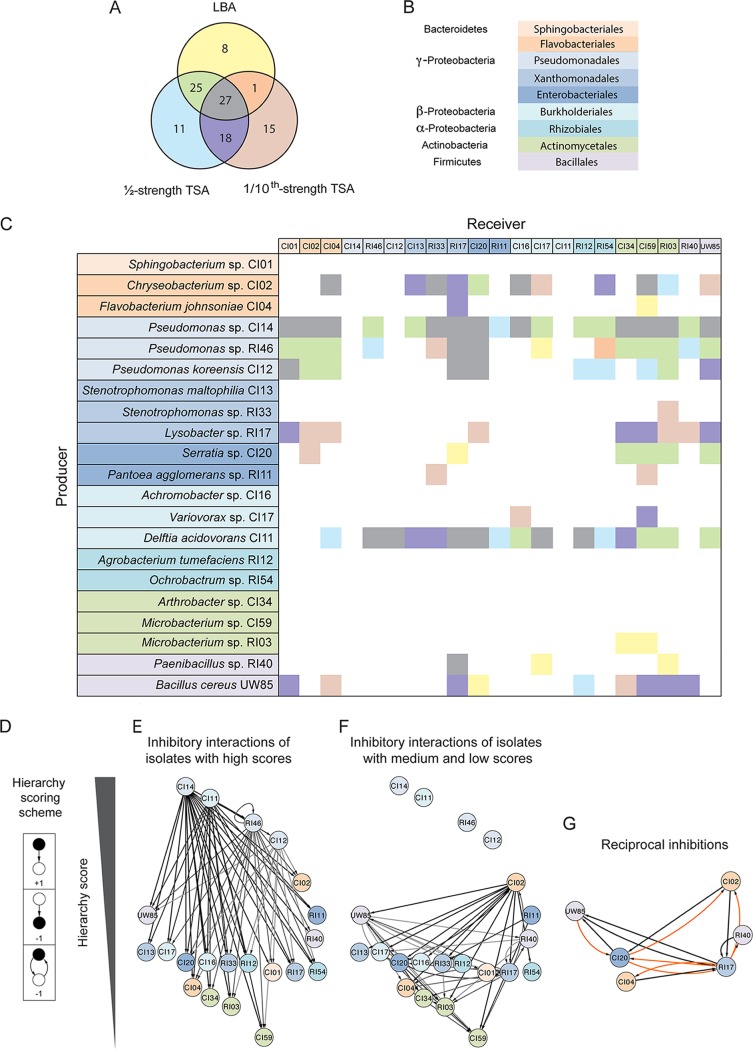
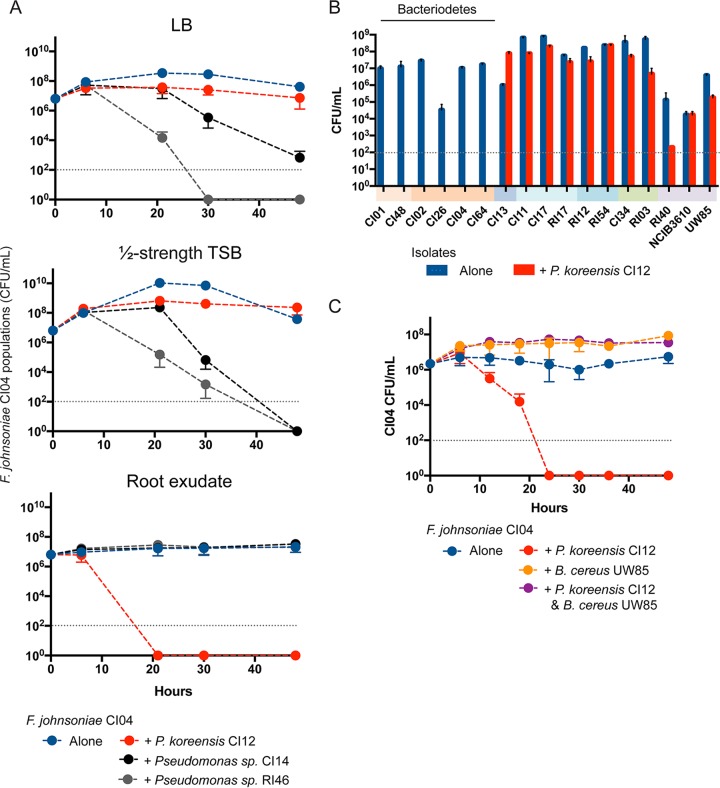
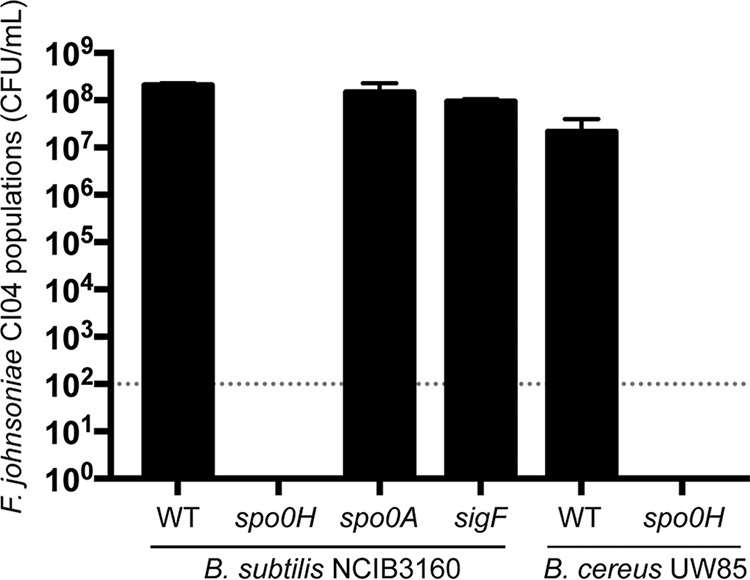
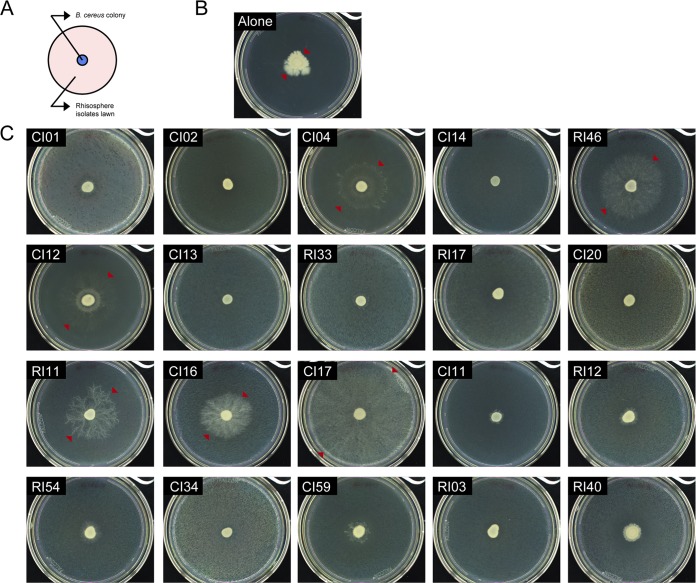
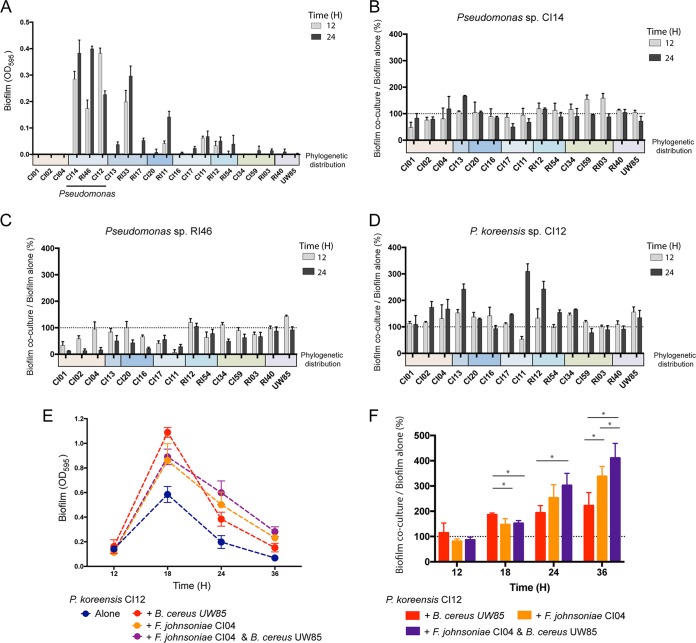
The quest to manipulate microbiomes has intensified, but many microbial communities have proven to be recalcitrant to sustained change. Developing model communities amenable to genetic dissection will underpin successful strategies for shaping microbiomes by advancing an understanding of community interactions. We developed a model community with representatives from three dominant rhizosphere taxa, the Firmicutes, Proteobacteria, and Bacteroidetes We chose Bacillus cereus as a model rhizosphere firmicute and characterized 20 other candidates, including "hitchhikers" that coisolated with B. cereus from the rhizosphere. Pairwise analysis produced a hierarchical interstrain-competition network. We chose two hitchhikers, Pseudomonas koreensis from the top tier of the competition network and Flavobacterium johnsoniae from the bottom of the network, to represent the Proteobacteria and Bacteroidetes, respectively. The model community has several emergent properties, induction of dendritic expansion of B. cereus colonies by either of the other members, and production of more robust biofilms by the three members together than individually. Moreover, P. koreensis produces a novel family of alkaloid antibiotics that inhibit growth of F. johnsoniae, and production is inhibited by B. cereus We designate this community THOR, because the members are
Keywords: Bacillus cereus; Flavobacterium johnsoniae; Pseudomonas koreensis; biofilm; colony expansion; emergent properties; inhibitory network; model community; rhizosphere.
Copyright © 2019 Lozano et al.
Figures

Similar articles
-
Surface colonization by Flavobacterium johnsoniae promotes its survival in a model microbial community.mBio. 2024 Mar 13;15(3):e0342823. doi: 10.1128/mbio.03428-23. Epub 2024 Feb 8. mBio. 2024. PMID: 38329367 Free PMC article.
-
THOR's Hammer: the Antibiotic Koreenceine Drives Gene Expression in a Model Microbial Community.mBio. 2022 Jun 28;13(3):e0248621. doi: 10.1128/mbio.02486-21. Epub 2022 Apr 18. mBio. 2022. PMID: 35435700 Free PMC article.
-
Bacterial Analogs of Plant Tetrahydropyridine Alkaloids Mediate Microbial Interactions in a Rhizosphere Model System.Appl Environ Microbiol. 2019 May 2;85(10):e03058-18. doi: 10.1128/AEM.03058-18. Print 2019 May 15. Appl Environ Microbiol. 2019. PMID: 30877115 Free PMC article.
-
Rhizospheric microbiome: Bio-based emerging strategies for sustainable agriculture development and future perspectives.Microbiol Res. 2022 Jan;254:126901. doi: 10.1016/j.micres.2021.126901. Epub 2021 Oct 23. Microbiol Res. 2022. PMID: 34700186 Review.
-
Dissection of plant microbiota and plant-microbiome interactions.J Microbiol. 2021 Mar;59(3):281-291. doi: 10.1007/s12275-021-0619-5. Epub 2021 Feb 23. J Microbiol. 2021. PMID: 33624265 Review.
Cited by
-
Microbial Community Interactions Are Sensitive to Small Changes in Temperature.Front Microbiol. 2021 May 21;12:672910. doi: 10.3389/fmicb.2021.672910. eCollection 2021. Front Microbiol. 2021. PMID: 34093493 Free PMC article.
-
Metabolic interactions affect the biomass of synthetic bacterial biofilm communities.mSystems. 2023 Dec 21;8(6):e0104523. doi: 10.1128/msystems.01045-23. Epub 2023 Nov 16. mSystems. 2023. PMID: 37971263 Free PMC article.
-
Bacterial Community Members Increase Bacillus subtilis Maintenance on the Roots of Arabidopsis thaliana.Phytobiomes J. 2020;4(4):303-313. doi: 10.1094/pbiomes-02-20-0019-r. Epub 2020 Oct 20. Phytobiomes J. 2020. PMID: 34661038 Free PMC article.
-
Experimental and computational approaches to unravel microbial community assembly.Comput Struct Biotechnol J. 2020 Dec 3;18:4071-4081. doi: 10.1016/j.csbj.2020.11.031. eCollection 2020. Comput Struct Biotechnol J. 2020. PMID: 33363703 Free PMC article. Review.
-
Plant Growth-Promoting Bacteria of Soil: Designing of Consortia Beneficial for Crop Production.Microorganisms. 2023 Nov 26;11(12):2864. doi: 10.3390/microorganisms11122864. Microorganisms. 2023. PMID: 38138008 Free PMC article. Review.
References
Publication types
MeSH terms
LinkOut - more resources
Full Text Sources
