. 2019 Mar 5;10(1):895.
doi: 10.1038/s41467-019-08806-w.

Sleep increases chromosome dynamics to enable reduction of accumulating DNA damage in single neurons

Affiliations

Sleep increases chromosome dynamics to enable reduction of accumulating DNA damage in single neurons

D Zada et al. Nat Commun. .

Abstract

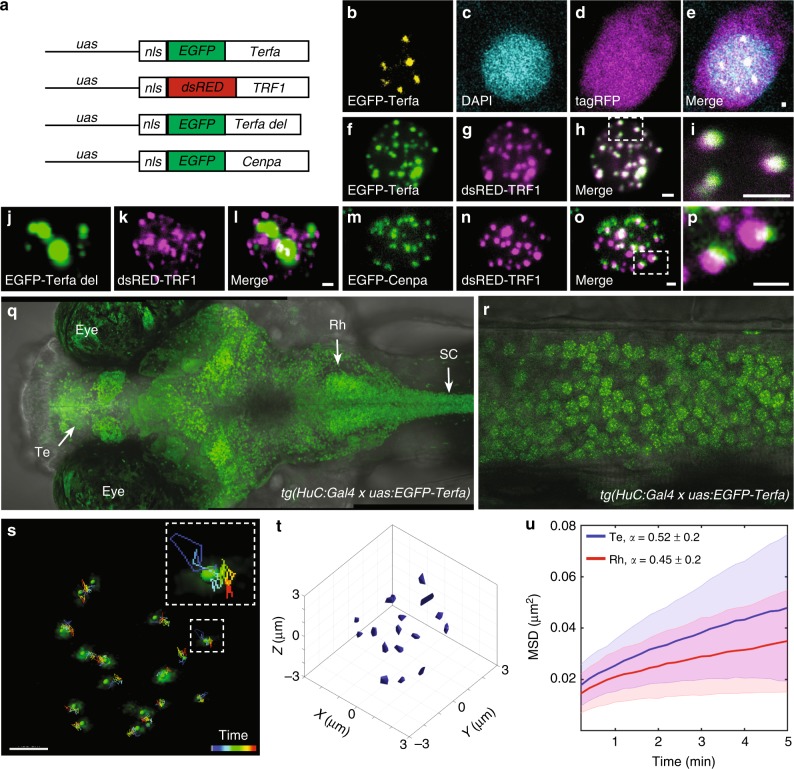
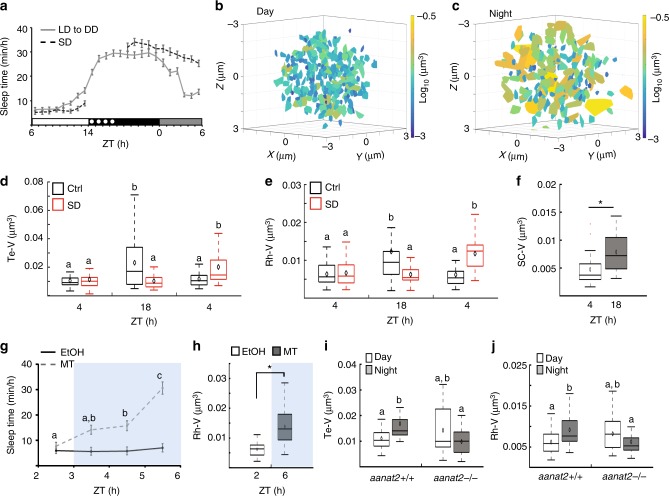
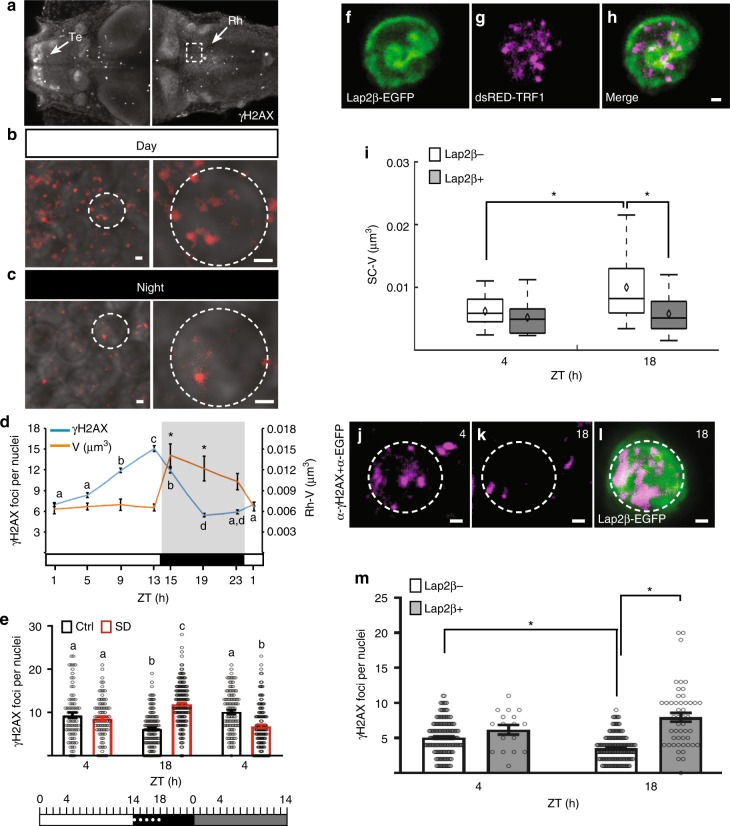
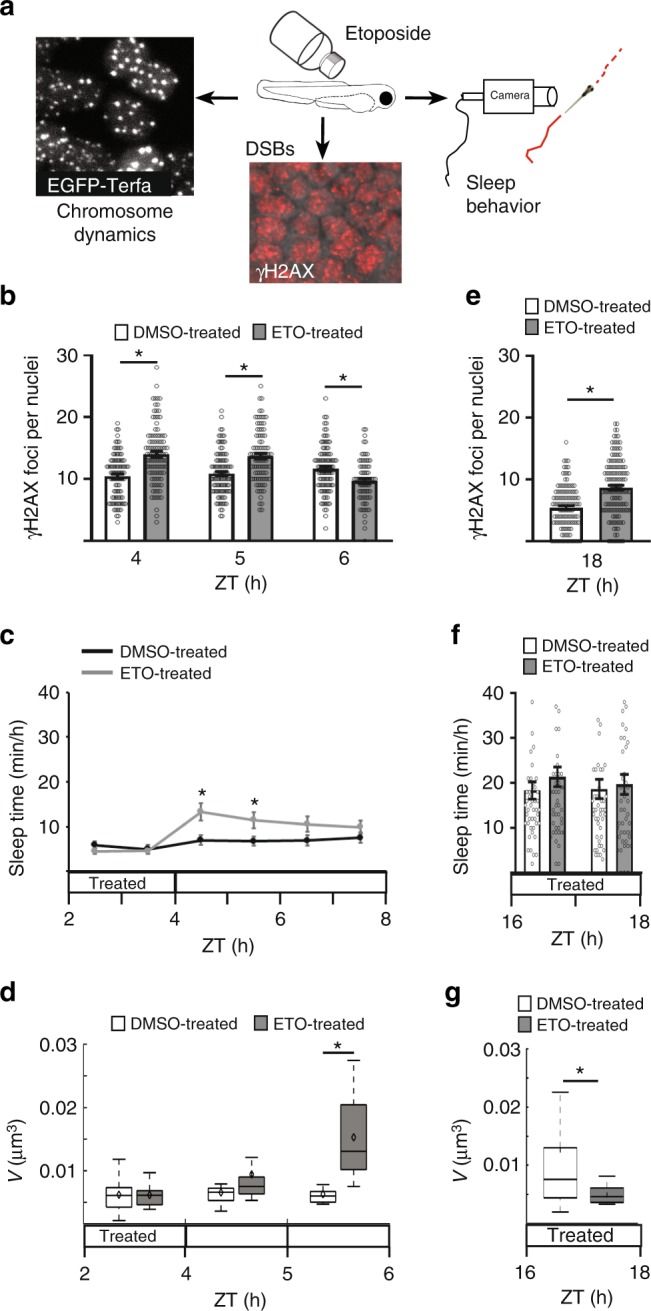
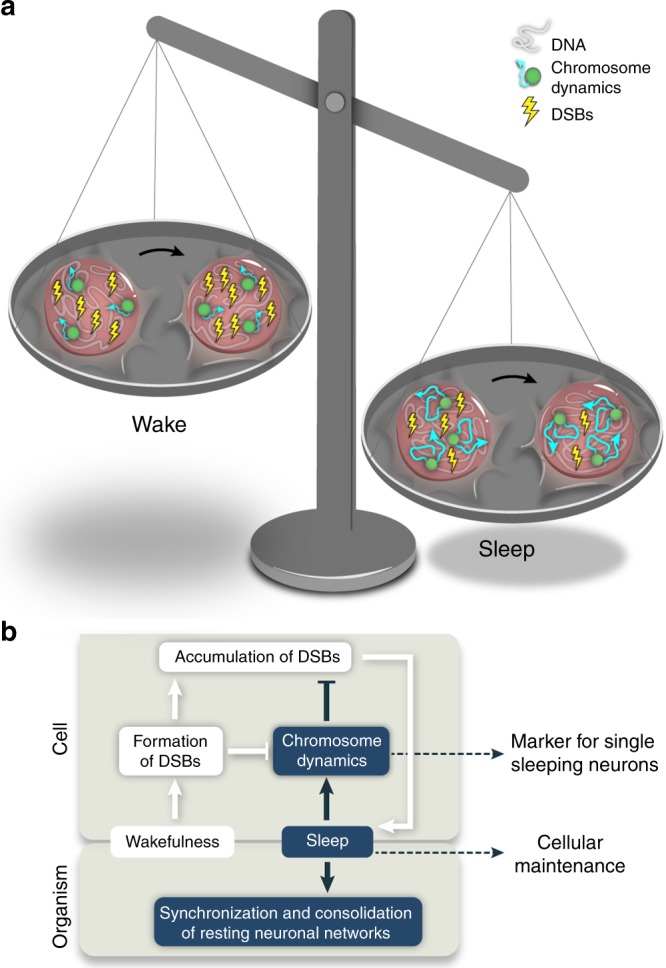
Sleep is essential to all animals with a nervous system. Nevertheless, the core cellular function of sleep is unknown, and there is no conserved molecular marker to define sleep across phylogeny. Time-lapse imaging of chromosomal markers in single cells of live zebrafish revealed that sleep increases chromosome dynamics in individual neurons but not in two other cell types. Manipulation of sleep, chromosome dynamics, neuronal activity, and DNA double-strand breaks (DSBs) showed that chromosome dynamics are low and the number of DSBs accumulates during wakefulness. In turn, sleep increases chromosome dynamics, which are necessary to reduce the amount of DSBs. These results establish chromosome dynamics as a potential marker to define single sleeping cells, and propose that the restorative function of sleep is nuclear maintenance.


Conflict of interest statement

The authors declare no competing interests.

Figures

Fig. 1
Fig. 1
Imaging single chromosome dynamics in live larvae. a The DNA constructs were used to express telomere, centromere, and truncated telomere markers. be One-plane view of a representative neuron that expresses cellular tagRFP (magenta) and nuclear EGFP-Terfa (yellow) telomeric markers in live larvae. fi Co-localization of zebrafish (f) and human (g) telomeric markers in the nucleus of a zebrafish neuron. jl Co-expression of truncated zebrafish (j) and human (k) telomeric markers. mp Co-expression of centromere (m) and telomere (n) markers. Dorsal (q) and lateral (spinal cord, r) views of 6-dpf tg(HuC:Gal4)/tg(uas:EGFP-Terfa) larvae (Te telencephalon, Rh rhombencephalon, SC spinal cord). s Live time-lapse imaging of a single neuron nucleus shows the movement of chromosomes measured over 9.5 min. Dashed box shows high magnification of a single trajectory. t 3D single-particle tracking (SPT) shows the volume of motion of chromosomes in a single nucleus. u In all Te and Rh neurons, the time-averaged mean square displacement (MSD) for telomeres trajectory (Te: n = 340 chromosomes, Rh: n = 475 chromosomes). Lines represent the means, and the shaded area represents the standard deviation (SD). Scale bar = 1 µm
Fig. 2
Fig. 2
Sleep increases chromosome dynamics in neurons. a Recording of sleep was performed in 6 dpf control or sleep-deprived larvae under an 14 h light/10 h dark cycle following by constant darkness (LD to DD, control: n = 119 larvae, sleep deprivation (SD): n = 96 larvae). b, c The area scanned by all chromosomes from all imaged Te neurons during 9.5 min (day: n = 26 cells; night: n = 29 cells). Color was coded according to the levels of volume of motion. df Volume of chromosome dynamics over 9.5 min per cell (EGFP-Terfa in d and e, EGFP-Cenpa in f). d Te neurons, ctrl: day (n = 26 cells), night (n = 29 cells), subjective day (n = 25 cells). SD: day (n = 26 cells), night (n = 35 cells), subjective day (n = 25 cells). P = 1.3 × 10−7, F = 17.54, degrees of freedom = 2. e Rh neurons, ctrl: day (n = 23 cells), night (n = 30 cells), subjective day (n = 35 cells). SD: day (n = 27 cells), night (n = 25 cells), subjective day (n = 26 cells). P = 7 × 10−6, F = 12.82, degrees of freedom = 2, determined by two-way ANOVA followed by Tukey test. f SC neurons: day (n = 33 cells), night (n = 33 cells). *P = 0.0001, determined by two-tailed t-test: two samples assuming unequal variance. Red crosses indicate outliers. g, h Monitoring sleep and chromosome dynamics under melatonin (MT) treatment. Blue background represents time under treatment. g Pretreated and EtOH/MT-treated larvae (EtOH: n = 48; MT: n = 48 larvae). P = 7.4 × 10−4, F = 14.3, degrees of freedom = 3, determined by two-way ANOVA followed by Tukey test. Values are presented as means ± SEM. h Pre-treated cells (n = 22) and MT-treated cells (n = 25). *P = 7 × 10−6, determined by two-tailed t-test: two samples assuming unequal variance. i Te neurons, aanat2 +/+ : day (n = 16 cells), night (n = 21 cells). aanat2−/−: day (n = 14 cells), night (n = 32 cells). P = 1.7 × 10−3, F = 12.26, degrees of freedom = 1. j Rh neurons, aanat2+/+ : day (n = 24 cells), night (n = 24 cells). aanat2−/−: day (n = 19 cells), night (n = 30 cells). P = 7.6 × 10−4, F = 10.42, degrees of freedom = 1, determined by two-way ANOVA followed by Tukey test. Boxplots: black diamond represents the mean, boxes indicate the median and the 25th-to-75th percentiles, whiskers extend to the most extreme data points. Letters or asterisks indicate significant differences. ZT zeitgeber time
Fig. 3
Fig. 3
Chromosome dynamics are essential for reducing the number of accumulating DSBs. ac Dorsal view of 6 dpf larvae stained with γH2AX. a Arrows indicate the telencephalon (Te) and rhombencephalon (Rh). Dashed box showing the Rh represents the area analyzed in d and e. Representative images from the Rh region during day (b) and night (c) are shown. Dashed circle indicates a single neuron. d The number of DSBs (P = 1 × 10−16, F = 118, degrees of freedom = 7) and chromosome dynamics (*P = 8 × 10−7, F = 7, degrees of freedom = 7) in single nuclei over 24 h, in 14 h light/10 h dark cycle. Determined by one-way ANOVA followed by a Tukey test. Lower case letters indicate significant changes between γH2AX groups. Asterisks indicate significant changes between chromosome dynamics groups. White and black horizontal bars represent light and dark periods, respectively. e Numbers of DSBs (dot plot, means ± SEM). Ctrl: day (n = 83 cells), night (n = 131 cells), subjective day (n = 105 cells). SD: day (n = 86 cells), night (n = 170 cells), subjective day (n = 135 cells). P = 1 × 10−6, F = 62.04, degrees of freedom = 2, determined by two-way ANOVA followed by a Tukey test. White, black, and gray rectangles represent day, night, and subjective day, respectively. Dotted white line represents the sleep deprivation (SD) period. fh Co-expression of Lap2β-EGFP (f) and human telomeric markers (g) in SC-neuronal nucleus. i Volume of chromosome dynamics in control (Lap2β−, day: n = 25; night: n = 21 cells) and Lap2β-overexpressing cells (Lap2β+, day: n = 25; night: n = 19 cells). *P = 0.026, F = 5.1, degrees of freedom = 1, determined by two-way ANOVA followed by a Tukey test. jl Representative images of double immunohistochemistry using α-γH2AX (magenta) and α-EGFP (green) in single SC neurons during day (j) and night (k, l). Dashed circle indicates a single nucleus. m The number of DSBs (dot plot, means ± SEM) in control (Lap2β−, day: n = 177; night: n = 177 cells) and Lap2β-overexpressing cells (Lap2β+, day: n = 17; night: n = 49 cells). *P = 1 × 10−6, F = 18.8, degrees of freedom = 1, determined by two-way ANOVA followed by a Tukey test. Zeitgeber time (ZT4)-day, ZT18-night. Boxplots: black diamond represents the mean, boxes indicate the median and the 25th-to-75th percentiles, whiskers extend to the most extreme data points. Letters or asterisks indicate significant differences. Scale bar = 1 µm
Fig. 4
Fig. 4
Neuronal excitation reduces chromosome dynamics in the Rh and SC. ac Simultaneous 2D imaging of neuronal activity (magenta) and chromosome dynamics (green) in the Rh neurons. d Raster plot of ΔF/F of 27 and 26 RCaMP1b-expressing single cells during day and night, respectively. Grayscale: ΔF/F amplitude. e A moderate negative correlation between chromosome dynamics and neuronal activity during day and night (RDay = −0.62, RNight = −0.64, RTotal = −0.64), determined by Pearson correlation coefficient. The average single-cell activity (f, *Pactivity= 0.035) and chromosome dynamics (g, *Pdynamics= 0.03) during day and night. Determined by two-tailed t-test: two samples assuming unequal variance. hl Optogenetic stimulation of neuronal activity reduces chromosome dynamics. hj The neurons expressed both dsRED-TRF1 and ChR2-YFP (arrow) or only dsRED-TRF1 (arrowhead). k, l Chromosome dynamics before and following the light stimuli (ChR2−, n = 9 cells; ChR2+, n = 10 cells). *P = 0.031, determined by two-tailed t-test: two-paired samples for means. Average change is marked by red line. mo Inhibition of neuronal activity during the night does not affect chromosome dynamics. m Representative raster plots of ΔF/F in the Rh of 6 dpf tg(HuC:GCaMP5) larvae under DMSO (n = 6 larvae) or BAPTA-AM (n = 6 larvae) treatments. Grayscale: ΔF/F amplitude. Bottom: histogram of the Ca2+ transients of all cells. n Average spontaneous neuronal activity in single neurons of the Rh under either DMSO (n = 6 larvae) or BAPTA-AM (n = 6 larvae) treatment (ZT23). *P = 2 × 10−4, t = 2.3, degrees of freedom = 7, determined by two-tailed t-test: two samples assuming unequal variance. o Volume of chromosome dynamics during nighttime (ZT23) in DMSO (n = 13 cells) and BAPTA-AM (n = 11 cells)-treated larvae. Values are presented as boxplots and means (black diamonds) or as dot plots and means ± SEM. Boxplots indicate the median and the 25th-to-75th percentiles. The whiskers extend to the most extreme data points. ZT zeitgeber time. Scale bar = 2 µm
Fig. 5
Fig. 5
Sleep and chromosome dynamics increased following induction of DSBs. a Larvae were treated with etoposide (ETO) during the day (ZT2–4, bd) and night (ZT16–18, eg), and DSBs, chromosome dynamics, and sleep were quantified. b Number of γH2AX foci in single nuclei. During treatment (DMSO: n = 93 cells; ETO: n = 99 cells, *P = 2.2 × 10−8), 1 h following treatment (DMSO: n = 102 cells; ETO: n = 89 cells, *P = 2.2 × 10−6), 2 h following treatment (DMSO: n = 98 cells; ETO: n = 73 cells, *P = 6.8 × 10−4). c Total sleep time. DMSO-treated (n = 84 larvae), ETO-treated (n = 78 larvae), PZT2–3 = 0.18, PZT3–4 = 0.71. Post-treatment: DMSO-treated (n = 84 larvae), ETO-treated (n = 78 larvae), *PZT4–5 = 0.0035, *PZT5–6 = 0.02, PZT6–7 = 0.07, PZT7–8 = 0.2. d Chromosome dynamics in neurons. During treatment (DMSO: n = 22 cells; ETO: n = 11 cells), 1 h following treatment (DMSO: n = 17 cells; ETO: n = 13 cells), 2 h following treatment (DMSO: n = 11 cells; ETO: n = 16 cells, *P = 3.8 × 10−5). Red crosses indicate outliers. eg Number of γH2AX foci in single neuronal nuclei (e, DMSO: n = 118; ETO: n = 138 cells, *P = 1.65 × 10−9), total sleep time (f, DMSO: n = 48; ETO: n = 48 larvae) and chromosome dynamics (g, DMSO: n = 22; ETO: n = 14 cells, *P = 0.02) in DMSO- and ETO-treated larvae during the night. Significant differences of all experiments were determined by two-tailed t-test: two samples assuming unequal variance. Values are presented as boxplots and means (black diamonds) or as dot plots and means ± SEM. Boxplots indicate the median and the 25th-to-75th percentiles. The whiskers extend to the most extreme data points. ZT zeitgeber time. Scale bar = 1 µm
Fig. 6
Fig. 6
A proposed function for sleep. a During wakefulness, chromosome dynamics are low and the number of DSBs is accumulated in neurons. The beneficial role of sleep is to increase the chromosome dynamics that are essential for the efficient reduction of the number of DSBs in single neurons. b DSBs are increased in the nucleus during wakefulness and are formed by intrinsic and extrinsic factors, such as neuronal activity, irradiation, and oxidative stress, when chromosome dynamics are low. At a given threshold, accumulations of DSBs in multiple neuronal networks can trigger sleep, which increases chromosome dynamics that are necessary for the reduction of DNA damage. This mechanism suggests that chromosome dynamics can define single sleeping neurons, and that one of the functions of sleep is nuclear maintenance

Comment in

References

    1. Levitas-Djerbi T, Appelbaum L. Modeling sleep and neuropsychiatric disorders in zebrafish. Curr. Opin. Neurobiol. 2017;44:89–93. doi: 10.1016/j.conb.2017.02.017. - DOI - PubMed
    1. Trojanowski NF, Raizen DM. Call it worm sleep. Trends Neurosci. 2016;39:54–62. doi: 10.1016/j.tins.2015.12.005. - DOI - PMC - PubMed
    1. Nath RD, et al. The jellyfish Cassiopea exhibits a sleep-like state. Curr. Biol. 2017;27:2984–2990. doi: 10.1016/j.cub.2017.08.014. - DOI - PMC - PubMed
    1. Zimmerman JE, Naidoo N, Raizen DM, Pack AI. Conservation of sleep: insights from non-mammalian model systems. Trends Neurosci. 2008;31:371–376. doi: 10.1016/j.tins.2008.05.001. - DOI - PMC - PubMed
    1. Sehgal A, Mignot E. Genetics of sleep and sleep disorders. Cell. 2011;146:194–207. doi: 10.1016/j.cell.2011.07.004. - DOI - PMC - PubMed

Publication types