. 2019 Mar 5;10(1):1047.
doi: 10.1038/s41467-019-09026-y.

The use of technical replication for detection of low-level somatic mutations in next-generation sequencing

Affiliations

The use of technical replication for detection of low-level somatic mutations in next-generation sequencing

Junho Kim et al. Nat Commun. .

Abstract

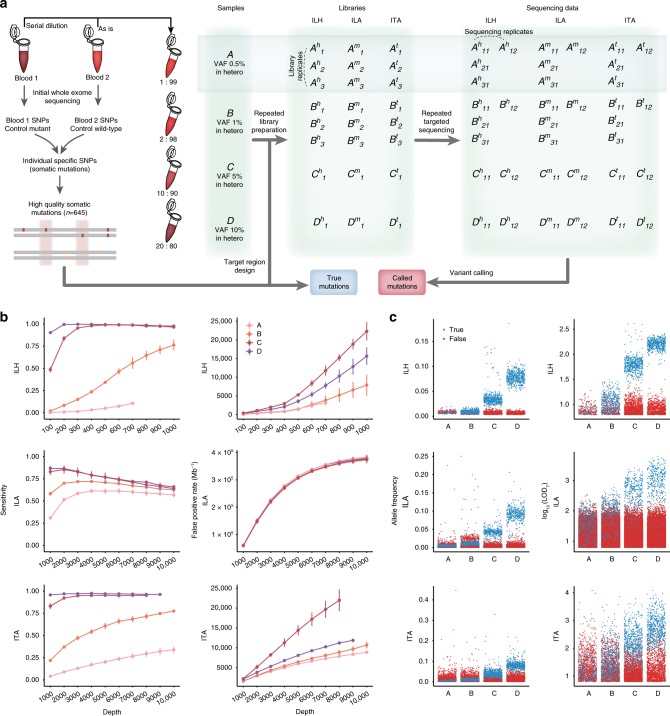
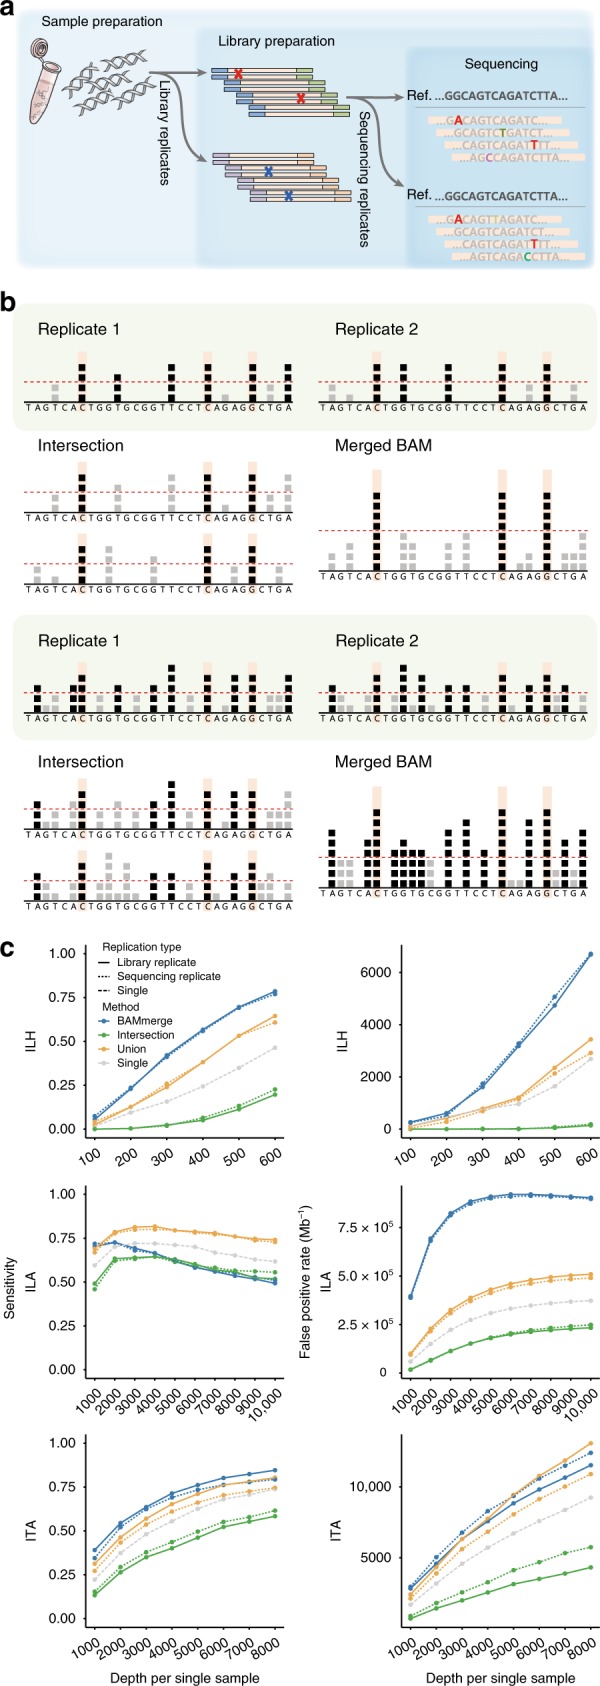
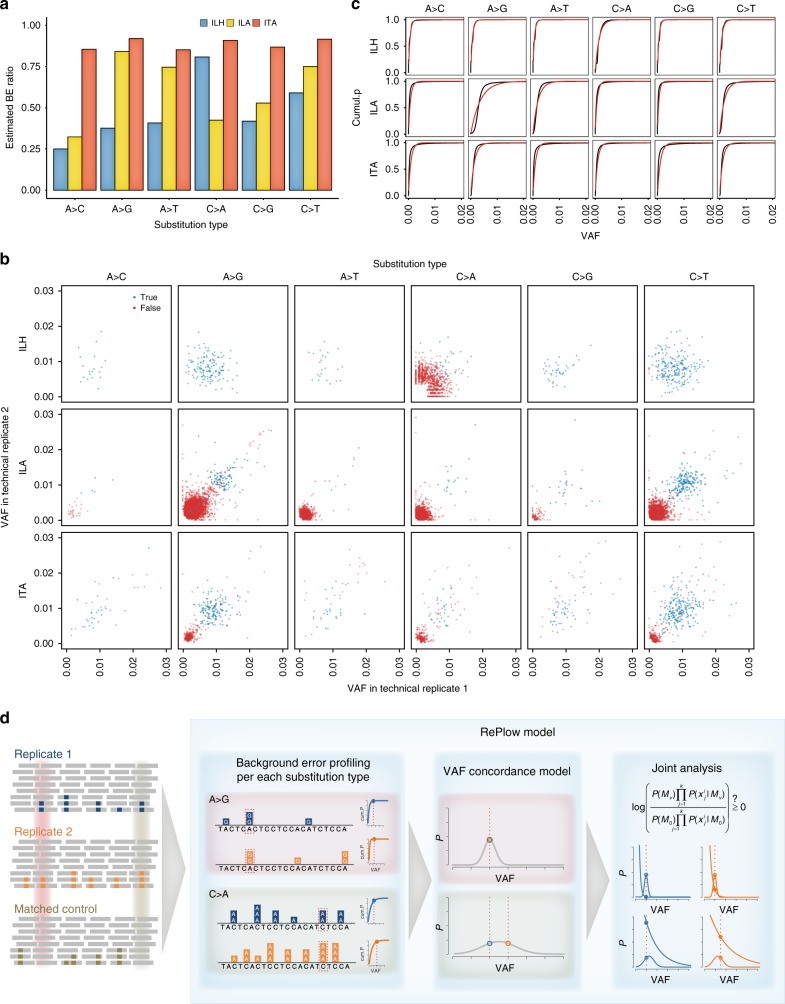
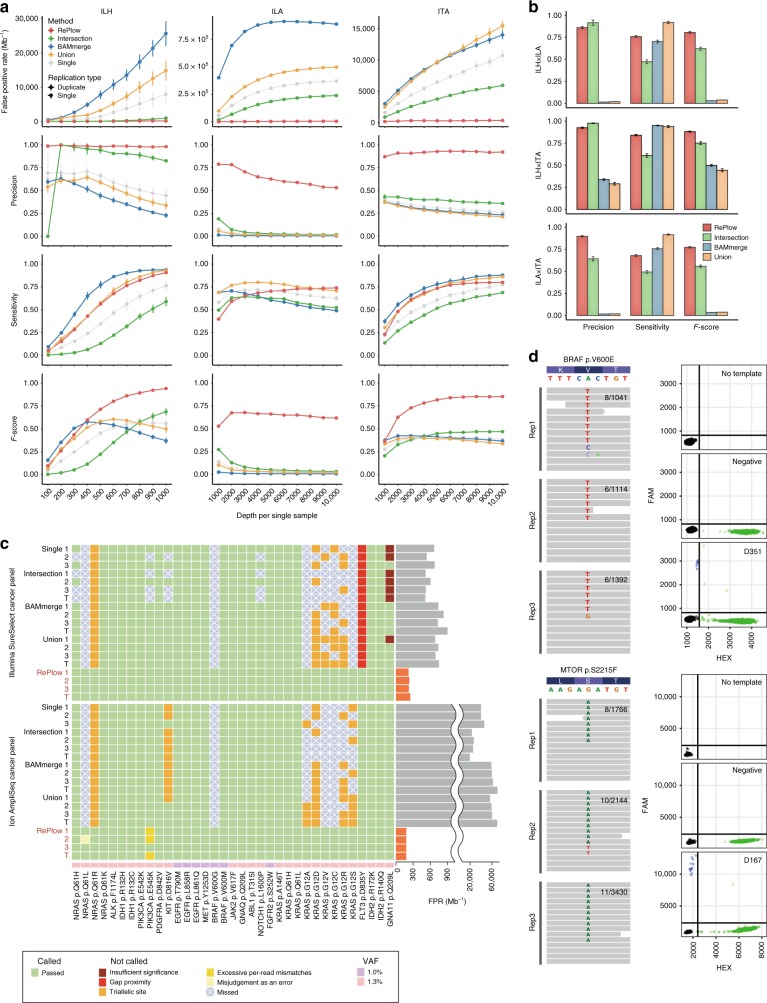
Accurate genome-wide detection of somatic mutations with low variant allele frequency (VAF, <1%) has proven difficult, for which generalized, scalable methods are lacking. Herein, we describe a new computational method, called RePlow, that we developed to detect low-VAF somatic mutations based on simple, library-level replicates for next-generation sequencing on any platform. Through joint analysis of replicates, RePlow is able to remove prevailing background errors in next-generation sequencing analysis, facilitating remarkable improvement in the detection accuracy for low-VAF somatic mutations (up to ~99% reduction in false positives). The method is validated in independent cancer panel and brain tissue sequencing data. Our study suggests a new paradigm with which to exploit an overwhelming abundance of sequencing data for accurate variant detection.


Conflict of interest statement

The authors declare no competing interests.

Figures

Fig. 1
Fig. 1
Assessment of conventional algorithms for detecting mutations with low-allele frequency. a Schematic of experimental design for test-base sequencing data. Four distinct sample mixtures (A, B, C, and D) were prepared and sequenced with three different sequencing platforms (ILH, ILA, and ITA). Constructed libraries from each platform were sequenced twice to produce sequencing replicates (X11 and X12). For samples A and B, two independent sets of sequencing library were additionally prepared to sequence data from library replicates (X21 and X31). Each set of sequencing data was sequentially downsampled ten times to evaluate the effects of read depth. All generated datasets were analyzed, and average performances were reported for each depth and platform. b Sensitivity and FPR of conventional methods (MuTect with adjusted parameters, others in Supplementary Figs. 1 and 2) by sequencing depth and VAF for each sequencing platform. Points are depicted within the maximum depth of the sequencing data (Supplementary Table 1). Error bars, 95% confidence intervals. Source data are provided as a Source Data file. c Distribution of allele frequencies and probabilistic odd-ratio scores (LODT) for true-positive and false-positive calls for each sample mixture (colored by blue and red, respectively). ILH hybrid-capture-based Illumina sequencing, ILA amplicon-based Illumina sequencing, ITA amplicon-based Ion Torrent sequencing, VAF variant allele frequency, FPR false-positive rate
Fig. 2
Fig. 2
Use of replicates with primitive models. a Experimental steps in the typical NGS process. Errors can be generated at each step. Note that background errors in the library preparation step (red marks and bases) cannot be discriminated with the sequencing replicates (pseudo-replicates). b Description of primitive approaches (intersection and BAM-merge) with their expected (upper) and real (lower) effects. Each square represents an observed B allele for a given position. Positions with a number of B alleles beyond the detection threshold (red dashed line) are called as mutation candidates (positions with black squares). Both approaches are expected to discriminate true variants (orange-shaded positions) from false calls based on the randomness of error (upper). However, in real high-depth data, both approaches are ineffective due to excessive background errors (lower). c Sensitivity and FPR of the primitive approaches with sample B (1% VAF) for each platform. Primitive approaches were applied for both library (solid lines) and sequencing (dotted lines) duplicates. Calls from the single sample (dashed lines) are also depicted to evaluate the improvement with replicates. All mutation calls were made by MuTect. Source data are provided as a Source Data file
Fig. 3
Fig. 3
Development of the RePlow model. a The estimated proportion of background errors (BEs) from total mismatches by substitution type. MOS values were measured for each substitution type from total mismatches of matched control samples. Positions with germline variants were excluded to assume that all mismatches originated from either sequencing or background errors. The ratio of the sum of MOS scores to the total mismatch count is regarded as an estimate of the BE proportion. b VAF distribution of called mutation candidates from library replicates of sample B (1% VAF) for each platform. All candidates were called by MuTect in at least one replicate. True positive and false-positive calls are colored in blue and red, respectively. c Empirical and fitted cumulative distribution for the VAFs of background errors. To estimate the PDF of background errors, VAF profiles based on the MOS value of each position (empirical cumulative distribution, black lines) were constructed and fitted by cumulative exponential distribution (red lines) (see Methods). PDFs were then constructed for each substitution type with the estimated parameter of the cumulative exponential model. d Overview and examples of mutation detection by RePlow. Mapped sequencing data of replicates and matched control are taken as input. For each data set, VAF profiles of background errors per substitution type are constructed first to estimate the PDF. Then, each genomic position is analyzed to calculate probabilities of being a variant or an error using estimated concordance models with the average VAF (normal distribution) and background error profiles (exponential distribution), respectively (see Methods). Both probabilities are jointly analyzed to estimate the likelihood thereof in a sequence context. Sites with a C > A mutation (green-shaded area) show a higher VAF than A > G mutation sites (red-shaded area). However, due to the excessive occurrence of context-specific error (C > A) and VAF discordance between replicates, RePlow selects only the A > G mutation site as a final candidate based on the joint analysis result. MOS mismatch over-representation score, PDF probability density function
Fig. 4
Fig. 4
Comparative performances of RePlow and the primitive approaches. a Performance assessment with the library replicates of test-base data. FPR, precision, sensitivity, and F-score were measured for sample B (1% VAF). All three combinations of duplicates were tested, and their average performances were reported with 95% confidence intervals (typically smaller than marks). b Performance assessment with the combination of replicates in multiplatforms. All pairs of library replicates between different platforms were tested with test-base data of sample B. Only the data sets with the highest depth of each platform were used for the combination (1000× for ILH and 10,000× for ILA and ITA). Error bars, 95% confidence intervals. c Independent assessment with a reference material sequenced by two widely-used cancer panels. Detection of 35 true cancer hotspot SNVs (1–1.3% VAF) were tested for all combinations of library triplicates (X1X2, X2X3, X1X3, and X1X2X3 are denoted as 1, 2, 3, and T, respectively). Green shading means a correct detection, and other colors represent the reason for the rejection or no detection (with X marks). FPRs of RePlow are highlighted in orange to emphasize their reductions therein, compared to other primitive approaches. d Experimental validation of rescued low-level mutations from the samples negative for pathogenic mutations in previous analysis. Observed allele counts are described in each replicate (left). Droplet digital PCR results for no DNA template (No template), DNA from healthy controls (negative), and disease samples are shown together for each site (right). Green and blue dots represent wild type- and mutant-specific signals, respectively. Source data for a, b are provided as a Source Data file

References

    1. Newman AM, et al. An ultrasensitive method for quantitating circulating tumor DNA with broad patient coverage. Nat. Med. 2014;20:548–554. doi: 10.1038/nm.3519. - DOI - PMC - PubMed
    1. Dan S, et al. Non-invasive prenatal diagnosis of lethal skeletal dysplasia by targeted capture sequencing of maternal plasma. PLOS ONE. 2016;11:e0159355. doi: 10.1371/journal.pone.0159355. - DOI - PMC - PubMed
    1. Lim JS, et al. Brain somatic mutations in MTOR cause focal cortical dysplasia type II leading to intractable epilepsy. Nat. Med. 2015;21:395–400. doi: 10.1038/nm.3824. - DOI - PubMed
    1. Spence JM, Spence JP, Abumoussa A, Burack WR. Ultradeep analysis of tumor heterogeneity in regions of somatic hypermutation. Genome Med. 2015;7:24. doi: 10.1186/s13073-015-0147-1. - DOI - PMC - PubMed
    1. Carlson CA, et al. Decoding cell lineage from acquired mutations using arbitrary deep sequencing. Nat. Methods. 2012;9:78–80. doi: 10.1038/nmeth.1781. - DOI - PMC - PubMed

Publication types

LinkOut - more resources