. 2019 Mar 5;10(1):1044.
doi: 10.1038/s41467-019-09010-6.

Stem cell proliferation is induced by apoptotic bodies from dying cells during epithelial tissue maintenance

Affiliations

Stem cell proliferation is induced by apoptotic bodies from dying cells during epithelial tissue maintenance

Courtney K Brock et al. Nat Commun. .

Abstract

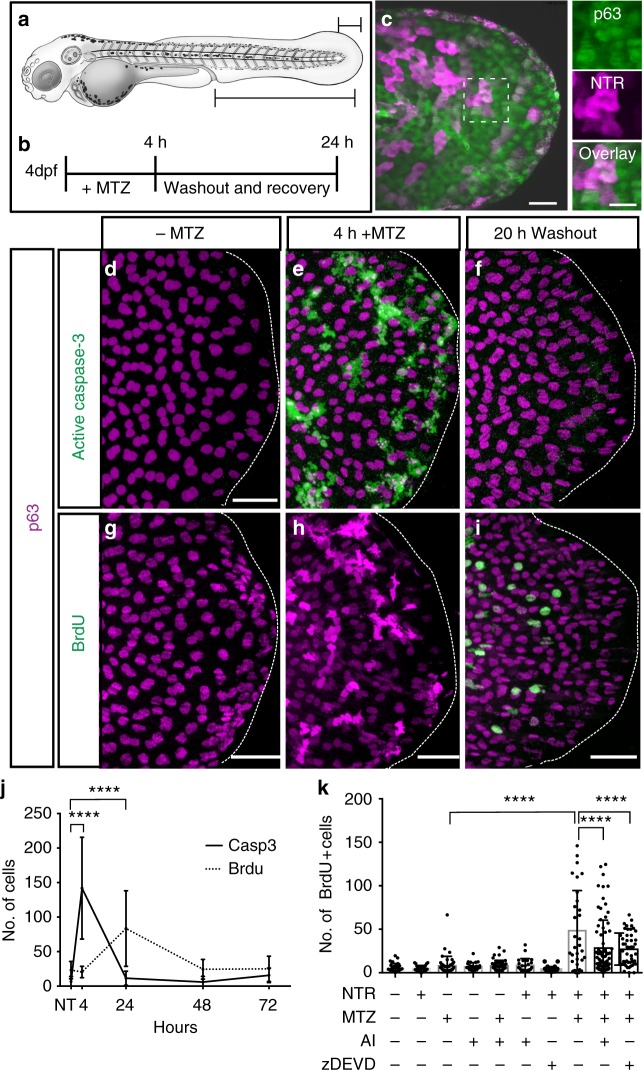
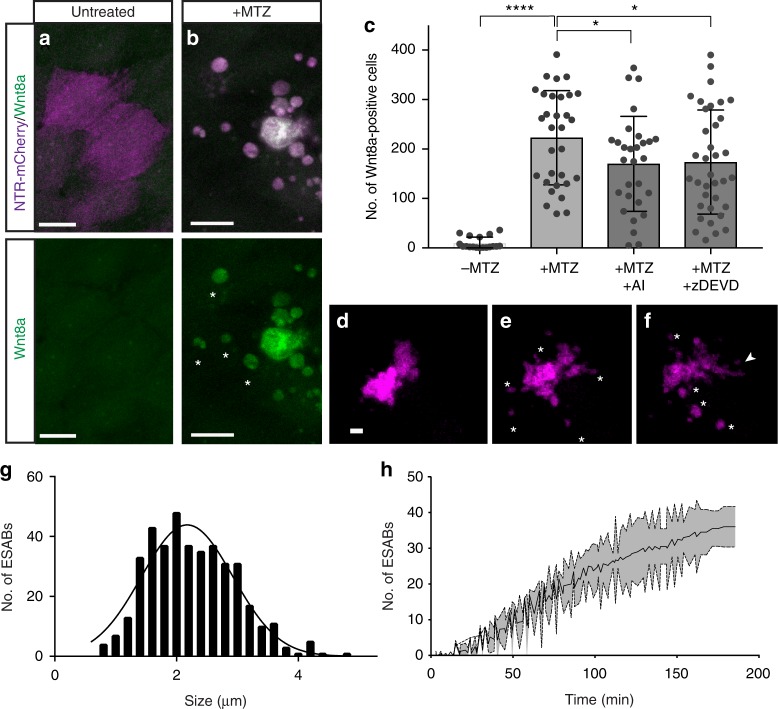
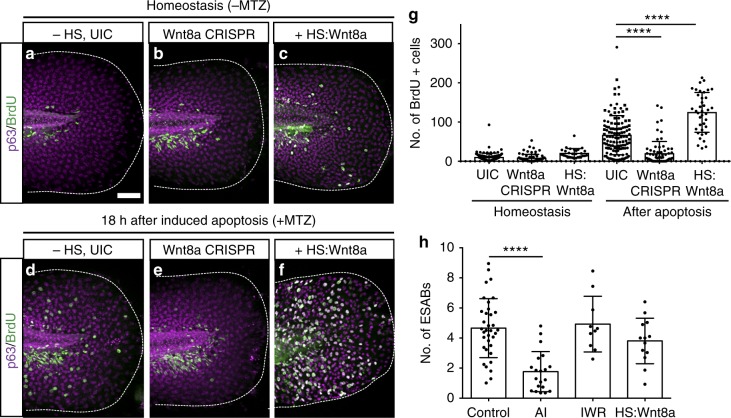
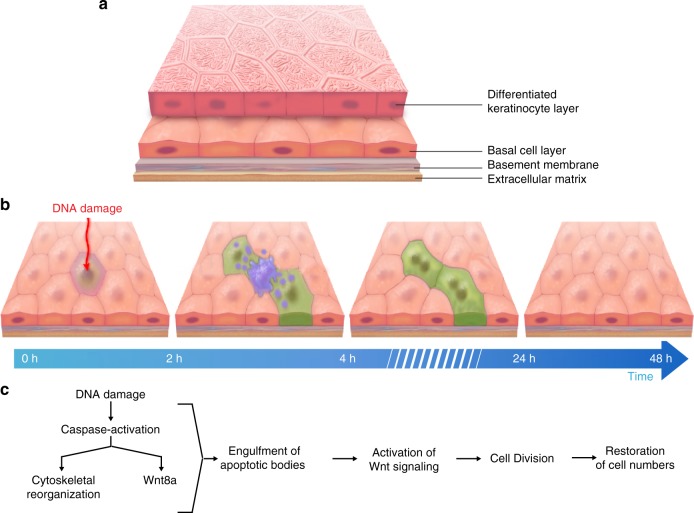
Epithelial tissues require the removal and replacement of damaged cells to sustain a functional barrier. Dying cells provide instructive cues that can influence surrounding cells to proliferate, but how these signals are transmitted to their healthy neighbors to control cellular behaviors during tissue homeostasis remains poorly understood. Here we show that dying stem cells facilitate communication with adjacent stem cells by caspase-dependent production of Wnt8a-containing apoptotic bodies to drive cellular turnover in living epithelia. Basal stem cells engulf apoptotic bodies, activate Wnt signaling, and are stimulated to divide to maintain tissue-wide cell numbers. Inhibition of either cell death or Wnt signaling eliminated the apoptosis-induced cell division, while overexpression of Wnt8a signaling combined with induced cell death led to an expansion of the stem cell population. We conclude that ingestion of apoptotic bodies represents a regulatory mechanism linking death and division to maintain overall stem cell numbers and epithelial tissue homeostasis.


Conflict of interest statement

The authors declare no competing interests.

Figures

Fig. 1
Fig. 1
Caspase-dependent proliferation after stem cell ablation. a Schematic of a 4-day post-fertilization (dpf) zebrafish larvae. Large region denotes area of the animal where cell death and proliferation were quantified before and after cell ablation. Small region marks the area used for fixed and live imaging. b Timeline for the addition and removal of metronidazole (MTZ). c The zc1036a GAL4 enhancer trap line drives expression of fluorescently tagged nitroreductase (NTR) in a subset of p63-positive basal stem cells (scale = 100 µm, 50 µm inset). Maximum intensity projections of confocal images for activated caspase-3 (df) and bromodeoxyuridine (BrdU) (gi) at different points after inducing damage (scale = 50 µm). j Quantification of active caspase-3- and BrdU-positive cells reveals a temporal relationship for the proliferative response. Mean number of positive cells from at least n = 11 individual larvae across three independent experiments per time point are plotted. NT=No treatment. k Mean number of BrdU-positive cells in individual larvae after induced apoptosis (n = 31) and in combination with treatment of the apoptosis inhibitor, NS3694 (AI) (n = 77) or caspase-3 peptide inhibitor zDEVD-fmk (zDEVD) (n = 49). Data are from three independent experiments and error bars represent sd; ****p < 0.0001. One-way analysis of variance (ANOVA) with Dunnett’s mutiple comparisons test (j, k)
Fig. 2
Fig. 2
Caspase-dependent generation of Wnt8a in apoptotic cells and bodies. a, b Maximum intensity projections of confocal images of Wnt8a in healthy and apoptotic stem cells (scale = 10 µm). c Mean number of Wnt8a-positive cells in individual larvae after induced apoptosis (n = 31), and in combination with treatment of AI (n = 29) or zDEVD (n = 36). Data are from three independent experiments and error bars represent sd. df Still images from time-lapse microscopy of an individual apoptotic cell over time (scale = 5 µm), asterisks mark apoptotic bodies and arrowheads mark filopodia extensions (see Supplementary Movie 1). g Size distribution of epithelial stem cell-derived apoptotic bodies. h Quantification of the production of apoptotic bodies from individual cells. Data from at least three independent experiments are represented as mean ± sd. ****p < 0.0001, *p < 0.03, One-way analysis of variance (ANOVA) with Holm–Sidak multiple comparisons test (c)
Fig. 3
Fig. 3
Apoptotic body uptake stimulates Wnt signaling and stem cell division. ac Confocal maximum intensity projections from time-lapse imaging of a p63-positive cell (green), asterisk, engulfing two apoptotic bodies (magenta), arrowheads (scale = 5 µm), see Supplementary Movie 2. d, e Transmission electron micrographs of apoptotic bodies in adjacent basal cells (scale = 2 µm, 500 nm). fh Time-lapse imaging of a dividing p63:EGFP-positive stem cell that has engulfed apoptotic bodies (arrowheads; scale = 5 µm), see Supplementary Movie 3. i Quantitation of actively dividing p63:EGFP-positive epithelial stem cells over time after induced apoptosis. jl Confocal images of Wnt-responsive cells (TCF-Siam:GFP positive) after apoptosis. Arrowheads denote increased Wnt activity in a cell engulfing apoptotic bodies (scale = 50 µm). m Mean number of TCF-Siam:GFP-positive cells from individual larvae after stem cell ablation (n = 5) and treatment with the Wnt inhibitor IWR-1 (n = 9). Data are from three independent experiments and error bars represent sem; ***p < 0.0001, **p < 0.0007. One-way analysis of variance (ANOVA) with Dunnett’s mutiple comparisons test (m)
Fig. 4
Fig. 4
ESAB (epithelial stem cell-derived apoptotic body)-delivered Wnt8a is required for apoptosis-induced stem cell division. af Maximum intensity projections of confocal images for bromodeoxyuridine (BrdU) (green) and p63 (magenta) after perturbation of Wnt8a signaling (ac), and in combination with induction of apoptosis (df) (scale = 50 µm). g Mean number of BrdU-positive cells from individual larvae after perturbation of Wnt8a (n = 9) and in combination with induced apoptosis (n = 10). h Quantitative analysis of ESAB production from controls (n = 35) and after treatment with apoptosis inhibitor (AI) (n = 20), the Wnt inhibitor IWR (n = 10) or overexpression of Wnt8a (n = 13). Data are represented as mean ± sd; ****p < 0.0001. One-way analysis of variance (ANOVA) with Dunnett’s mutiple comparisons test (g, h)
Fig. 5
Fig. 5
Apoptosis-induced stem cell division requires Wnt8a on the surface of ESABs (epithelial stem cell-derived apoptotic bodies). ac Time-lapse confocal images of an epithelial stem cell producing an apoptotic body containing Wnt8a-GFP (scale = 5 µm), see Supplementary Movie 4. d Quantitation of green fluorescent protein (GFP) fluorescence in ESABs after overexpression of Wnt8a by heat-shock induction. e Schematic of strategy to isolate ESABs by differential centrifugation. fh Whole cells (scale = 10 µm) and ESABs (scale = 5 µm) isolated by differential centrifugation exhibit mCherry fluorescence (magenta) and are appropriate size and morphology. i Quantification of the number of mCherry-positive ESABs after purification (magenta), compared to extracellular vesicles isolated from zebrafish larvae under homeostatic conditions (gray), using flow cytometry. j Size distribution of apoptotic bodies compared to size match bead controls (1 µm and 3 µm boxes, FSC = forward scatter, SSC = side scatter, see gating strategy in Supplementary Figure 6 a-b). km Transmission electron micrographs of Wnt8a immunogold labeling on whole-mount purified apoptotic bodies (scale = 500 nm). n The mean number of Wnt8a foci on individual ESABs from uninjected (n = 21) and Wnt8a CRISPR (clustered regularly interspaced short palindromic repeats)-injected (n = 10) animals. Data are from three independent experiments and error bars represent sd; ****p < 0.0001, **p < 0.001. Unpaired two-tailed t-test (d, n)
Fig. 6
Fig. 6
Model of apoptosis-induced stem cell turnover in an epithelial bilayer. a Schematic of an epithelial bilayer. b Sequence of cellular events observed by time-lapse imaging. c Temporal activation of distinct molecular mechanisms promoting the replacement of lost cells

References

    1. Turner JR. Molecular basis of epithelial barrier regulation: from basic mechanisms to clinical application. Am. J. Pathol. 2006;169:1901–1909. doi: 10.2353/ajpath.2006.060681. - DOI - PMC - PubMed
    1. Garcia-Castillo MD, Chinnapen DJ, Lencer WI. Membrane transport across polarized epithelia. Cold Spring Harb. Perspect. Biol. 2017;9:pii: a027912. doi: 10.1101/cshperspect.a027912. - DOI - PMC - PubMed
    1. Rojas R, Apodaca G. Immunoglobulin transport across polarized epithelial cells. Nat. Rev. Mol. Cell Biol. 2002;3:944–955. doi: 10.1038/nrm972. - DOI - PubMed
    1. Stadnyk AW. Cytokine production by epithelial cells. FASEB J. 1994;8:1041–1047. doi: 10.1096/fasebj.8.13.7926369. - DOI - PubMed
    1. Fan Y, Bergmann A. Distinct mechanisms of apoptosis-induced compensatory proliferation in proliferating and differentiating tissues in the Drosophila eye. Dev. Cell. 2008;14:399–410. doi: 10.1016/j.devcel.2008.01.003. - DOI - PMC - PubMed

Publication types

MeSH terms