. 2019 Mar 5;9(1):3491.
doi: 10.1038/s41598-019-39424-7.

Degradation of p47 by autophagy contributes to CADM1 overexpression in ATLL cells through the activation of NF-κB

Affiliations

Degradation of p47 by autophagy contributes to CADM1 overexpression in ATLL cells through the activation of NF-κB

Bidhan Sarkar et al. Sci Rep. .

Abstract

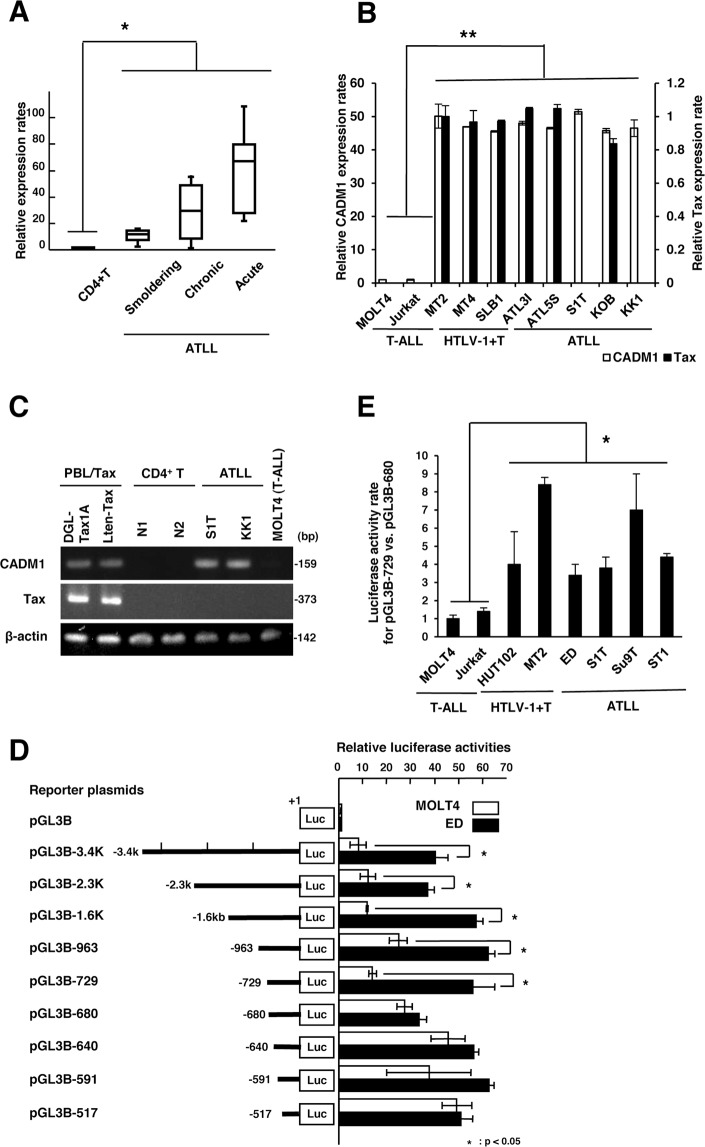
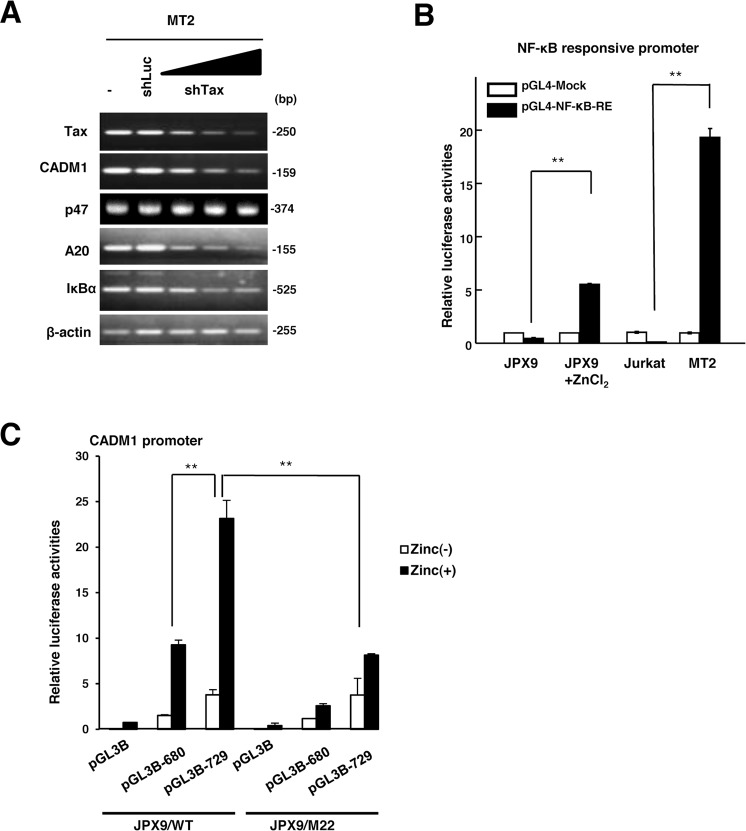
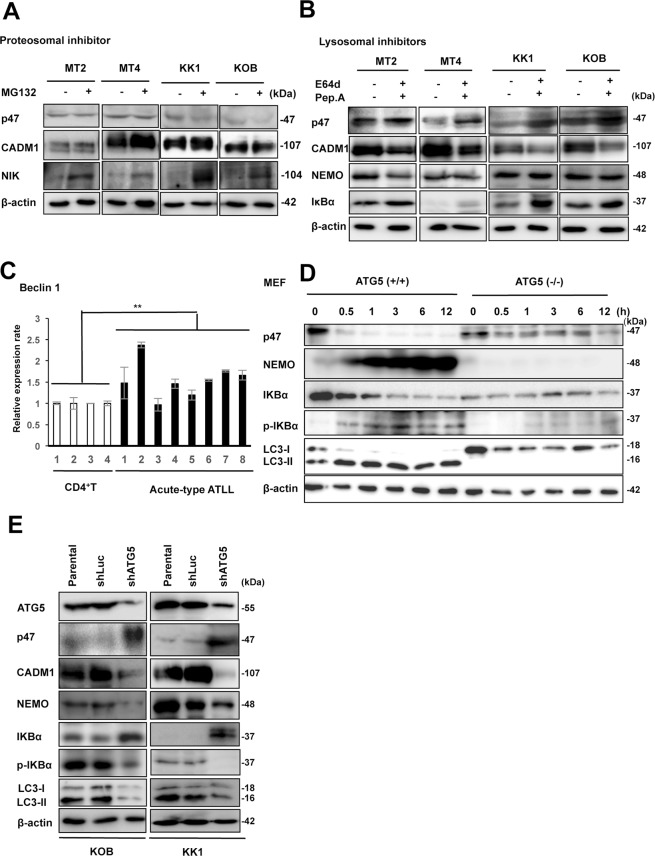
Cell adhesion molecule 1 (CADM1), a member of the immunoglobulin superfamily, is identified as a novel cell surface marker for human T-cell leukemia virus (HTLV-1)-infected T cells. Adult T-cell leukemia/lymphoma (ATLL) is developed in HTLV-1-infected T-cells after a long infection period. To examine the mechanism of CADM1 overexpression in ATLL, we first identified that CADM1 is transcriptionally up-regulated by a transcriptional enhancer element through NF-κB signaling pathway. In HTLV-1-infected T-cells, CADM1 expression is dependent on HTLV-1/Tax through activation of canonical and non-canonical NF-κB; however, in ATLL cells with frequent loss of Tax expression, the activation of canonical NF-κB only enhances the CADM1 expression. Along with active mutations in signaling molecules under T-cell recepor (TCR) signaling, degradation of p47, a negative regulator of NF-κB, was essential for activation of canonical NF-κB through stabilization of NEMO (NF-κB essential modulator). The mechanism of p47 degradation is primarily dependent on activation of lysosomal-autophagy and the autophagy is activated in most of the HTLV-infected and ATLL cells, suggesting that the p47 degradation may be a first key molecular event during HTLV-1 infection to T-cells as a connector of two important signaling pathways, NF-κB and autophagy.


Conflict of interest statement

The authors declare no competing interests.

Figures

Figure 1
Figure 1
Activation of CADM1 gene expression and identification of the transcriptional activator region in the CADM1 promoter in ATLL. (A) Real-time RT-PCR analysis for CADM1 in CD4+ T-cells from three healthy volunteers and ATLL cells from patients with three different subtypes of ATLL (each six cases of the smoldering, chronic and acute types). Box plots of the relative CADM1 mRNA expression are shown. *P < 0.05 (Student’s t test). (B) Real-time RT-PCR analysis for CADM1 and Tax in two HTLV-1-negative T-ALL cell lines (T-ALL), three HTLV-1-infected T-cell lines (HTLV-1 + T), and six ATLL cell lines (ATLL) as indicated in the figure. The data represent the means ± S.D. of triplicate determinations and are presented relative to the MOLT4 (for CADM1) and MT2 (for Tax) cell lines (set as 1). **P < 0.01 (Mann-Whitney U test). (C) Semiquantitative RT-PCR analysis for CADM1 and Tax in two samples of Tax-immortalized T-cells (PBL/Tax), two samples of CD4+ T-cells from healthy volunteers, two ATLL cell lines (S1T and KK1), and one T-ALL cell line (MOLT4). β-actin was used as a loading control. (D) Luciferase activity of the serial CADM1 promoter deletion mutants from −3,400 to −517 bp, as indicated in the figure, was determined by transfection into the ED/ATLL cell line (black box) or MOLT4/T-ALL cell line (white box). The data represent the means ± S.D. of triplicate determinations and are presented relative to pGL3-basic activity. *P < 0.05 (Student’s t test). (E) Luciferase activity of the pGL3B-729 and pGL3B-680 constructs in two T-ALL (Jurkat and MOLT4; white box) and six ATLL-related cell lines (HUT102, MT2, ED, S1T, Su9T, and ST1; black box). The data represent the fold change in the luciferase activity of pGL3B-729 over that of pGL3B-680 and are presented relative to the MOLT4 cell line. *P < 0.05 (Mann-Whitney U test).
Figure 2
Figure 2
NF-κB transcription factors function in the transcriptional activation of CADM1 in ATLL cells. (A) Schematic representation of the sequence from −729 to −680 in the CADM1 promoter and potential transcription factor-binding sites. The position of each probe fragment (AC) used in the EMSA is also shown. (B) EMSA performed with fragment (AC) probe and nuclear extracts (NE) from two ATLL cell lines (KK1 and KOB) and the MOLT4/T-ALL cell line. A reaction using a probe alone with no nuclear extract was included as a negative control (−). (C,D) Competitive EMSA performed with fragment A or B probe and nuclear extracts from the KK1/ATLL cell line in the presence of a 200-fold excess of the indicated competitor DNA fragments (AB, or each binding sequence of transcription factors). A specific shifted band is indicated as Complex A or B, and # indicates the background signal. (E) EMSA performed with the fragment A or B probe, or AP-1 probe as a control, and nuclear extracts from the two ATLL cell lines (MT2 and KK1) treated or untreated with various concentrations (0, 1, 3, 5 or 10 μM) of the NF-κB inhibitor BAY11-7082. (F) Real-time RT-PCR analysis for CADM1 in two ATLL-related cell lines (KK1 and MT2) 12 h after treatment with various concentrations of the NF-κB inhibitor Bay11-7082. The data represent the means ± S.D. of triplicate determinations and are presented relative to the untreated control (set as 1). *P < 0.05, **P < 0.01 (Student’s t test). (G) ChIP-PCR performed on HTLV-1-infected T-cell lines (MT2, MT4, and SLB1) and ATLL cell lines (KOB, KK1, and S1T) with each indicated antibody and amplified primers specific for the NF-κB-like site in the CADM1 promoter. One-hundredth of the total DNA from nuclear extracts is the positive control (Input), and precipitated DNA with non-immune immunoglobulin of the same isotype (cont. IgG) was used as a negative control.
Figure 3
Figure 3
HTLV-1/Tax-dependent activation of CADM1 expression via the NF-κB pathway. (A) Semiquantitative RT-PCR analysis was performed for Tax, CADM1, p47, A20, IκBα in the HTLV-1-infected T-cell line MT2 after transfection with various concentrations of shRNA-expression vector for Tax (shTax) or a shRNA expression vector for luciferase (shLuc) as a control. β-actin was used as a loading control. (B) Luciferase activity of the NF-κB-responsive luciferase reporter vector (pGL4-NF-κB-RE) or mock vector (pGL4-Mock) was determined in Tax-inducible JPX-9 cells with or without 120 µM of ZnCl2 treatment, MT2, and Jurkat cells. The data represent the means ± S.D. of triplicate determinations and are presented relative to the luciferase activity of JPX-9 cells transfected with pGL4-Mock. **P < 0.01 (Student’s t test). (C) Luciferase activity of the pGL3B-729 or pGL3B-680 construct was determined in the JPX-9 or NF-κB-mutated JPX-9/M22 cells with or without 120 µM ZnCl2 treatment. The data represent the means ± S.D. of triplicate determinations and are presented relative to the JPX-9 cells transfected with pGL3B/Mock without ZnCl2 treatment. **P < 0.01 (Student’s t test).
Figure 4
Figure 4
p47 is posttranslationally down-regulated in HTLV-1-infected and ATLL cell lines. (A) Semiquantitative RT-PCR analysis for CADM1, Tax, LC3B, A20, CYLD, p47 and NEMO was performed in two T-ALL cell lines (Jurkat and MOLT4), three HTLV-1-infected T-cell lines (HUT102, MT2, and MT4), and three ATLL cell lines (S1T, KOB, and KK1). β-actin was used as a loading control. (B) Immunoblot analysis of CADM1, Tax, and the indicated NF-κB and autophagy signaling proteins was performed in the same series of cell lines used in Fig. 4A. β-actin was used as a loading control. The cropped gels/blots are used in the figure, and the full-length gels/blots are presented in Supplementary Fig. S7. (C) Real-time RT-PCR analysis for p47 in CD4+ T cells from five healthy volunteers and ATLL cells from three smoldering-type, four chronic-type, and four acute-type ATLL patients. The data represent the means ± S.D. of triplicate determinations and are presented relative to the p47 expression level in control CD4+ T-cells (lane 1). (D) Immunoblot analysis of p47, CADM1, Tax, and LC3B was performed in four CD4+ T-cells from healthy volunteers and ATLL cells from eight acute-type ATLL patients. β-actin was used as a loading control. The cropped gels/blots are used in the figure, and the full-length gels/blots are presented in Supplementary Fig. S7.
Figure 5
Figure 5
Down-regulation of p47 contributes to the activation of the canonical NF-κB pathway with enhanced expression of CADM1 in ATLL cells. (A) Immunoblot analysis of p47, CADM1, NEMO, and IκBα in KK1 or HUT102 cells was performed after transfection of a p47 expression or mock vector. Duplicated experiments were performed (#1 and #2), and β-actin was used as a loading control. The cropped gels/blots are used in the figure, and the full-length gels/blots are presented in Supplementary Fig. S7. (B) The cell proliferation of KK1 and HUT102 cells transfected with a p47 expression or mock vector was determined under the same condition as that in (A). The data represent the means ± S.D. of triplicate determinations. *P < 0.05, **P < 0.01 (Student’s t test). (C) Immunoblot analysis of p47, CADM1, NEMO, IκBα, and p-IκBα (Ser32/36) in Jurkat or MOLT4 cells was performed after transfection with an increasing dose of a p47 shRNA expression vector (0, 1, and 3 µg) under TNF-α treatment. β-actin was used as a loading control. The cropped gels/blots are used in the figure, and the full-length gels/blots are presented in Supplementary Fig. S7. (D) Cell proliferation was determined in Jurkat and MOLT4 cells under TNF-α treatment and the same condition as that in (C). Duplicated experiments were performed (#1 and #2). The data represent the means ± S.D. of triplicate determinations. *P < 0.05 (Student’s t test). (E) Luciferase activity was determined in Jurkat and MOLT4 cells with or without TNF-α treatment after the transfection of pGL3B-729 (pGL3B-CADM1) or pGL3-basic (pGL3B-mock). The data represent the means ± S.D. of triplicate determinations and are presented relative to pGL3-basic activity in the absence of TNF-α. **P < 0.01 (Student’s t test).
Figure 6
Figure 6
p47 protein is efficiently degraded by the lysosome-dependent pathway in ATLL-related cell lines. (A) Immunoblot analysis of p47, CADM1, and NIK was performed in two HTLV-1-infected T-cell lines (MT2 and MT4) and two ATLL cell lines (KK1 and KOB) after treatment with or without MG132 for 48 hours. β-actin was used as a loading control. The cropped gels/blots are used in the figure, and the full-length gels/blots are presented in Supplementary Fig. S7. (B) Immunoblot analysis of p47, CADM1, NEMO, and IκBα was performed in two HTLV-1-infected T-cell lines (MT2 and MT4) and two ATLL cell lines (KK1 and KOB) after treatment with or without E64d and pepstatin A for 48 hours. β-actin was used as a loading control. The cropped gels/blots are used in the figure, and the full-length gels/blots are presented in Supplementary Fig. S7. (C) Relative expression of Beclin 1 was determined by quantitative RT-PCR in CD4+ T-cells from four healthy cases and leukemia cells from eight acute-type ATLL patients. The data represent the means ± S.D. of triplicate experiments and are presented relative to control CD4+ T-cells (lane 1). **P < 0.01 (Student’s t test). (D) After autophagy-deficient primary Atg5(−/−) MEF cells and wild-type primary Atg5(+/+) MEF cells as control were cultured under starvation for each indicated time, and immunoblot analysis of p47 and various NF-κB and autophagy-related signaling molecules was performed using each specific antibody. The cropped gels/blots are used in the figure, and the full-length gels/blots are presented in Supplementary Fig. S7. (E) Two ATLL cell lines (KOB and KK1) were transfected using an shRNA expression vector for ATG5 (shATG5) or luciferase as a control (shLuc), and the transfected cells were analyzed for the expression of p47 and protein with various NF-κB and autophagy-related signaling molecules by immunoblotting. β-actin was used as a loading control. The cropped gels/blots are used in the figure, and the full-length gels/blots are presented in Supplementary Fig. S7.

Similar articles

Cited by

References

    1. Ishitsuka K, Tamura K. Human T-cell leukaemia virus type I and adult T-cell leukaemia-lymphoma. Lancet Oncol. 2014;11:517–26. doi: 10.1016/S1470-2045(14)70202-5. - DOI - PubMed
    1. Murakami Y. Involvement of a cell adhesion molecule, TSLC1/IGSF4, in human oncogenesis. Cancer Sci. 2005;96:543–52. doi: 10.1111/j.1349-7006.2005.00089.x. - DOI - PMC - PubMed
    1. Sasaki H, et al. Overexpression of a cell adhesion molecule, TSLC1, as a possible molecular marker for acute-type adult T-cell leukemia. Blood. 2005;105:1204–13. doi: 10.1182/blood-2004-03-1222. - DOI - PubMed
    1. Dewan MZ, et al. Critical role for TSLC1 expression in the growth and organ infiltration of adult T-cell leukemia cells in vivo. J Virol. 2008;23:11958–63. doi: 10.1128/JVI.01149-08. - DOI - PMC - PubMed
    1. Nakahata S, et al. Clinical significance of CADM1/TSLC1/IgSF4 expression in adult T-cell leukemia/lymphoma. Leukemia. 2012;6:1238–46. doi: 10.1038/leu.2011.379. - DOI - PubMed

Publication types

MeSH terms