. 2019 Mar 5;9(1):3470.
doi: 10.1038/s41598-019-39143-z.

A retinal model of cerebral malaria

Affiliations

A retinal model of cerebral malaria

François Paquet-Durand et al. Sci Rep. .

Abstract

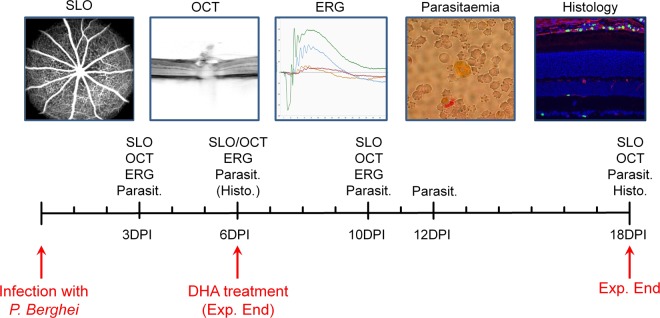
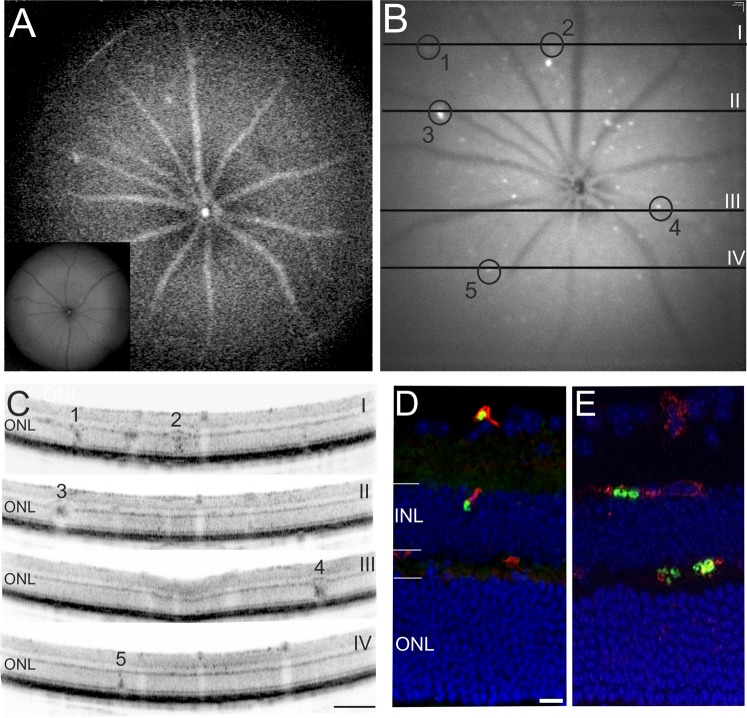
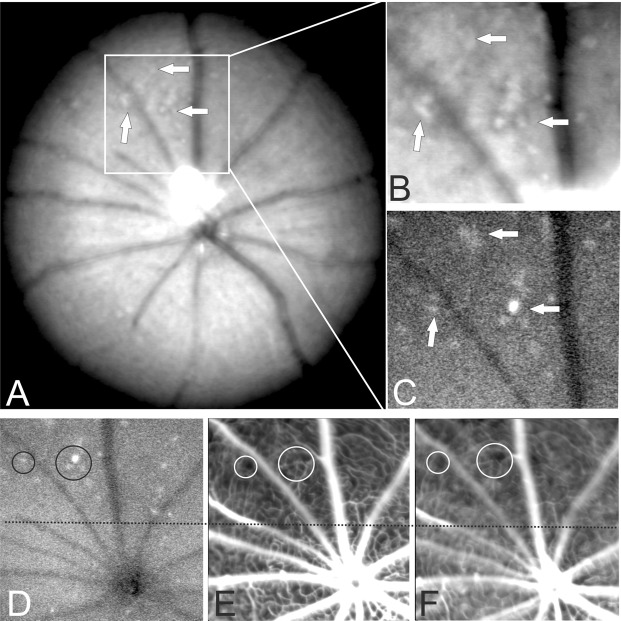
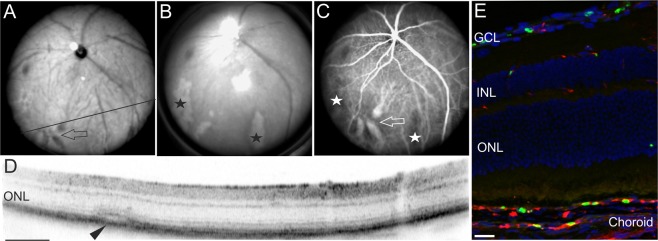
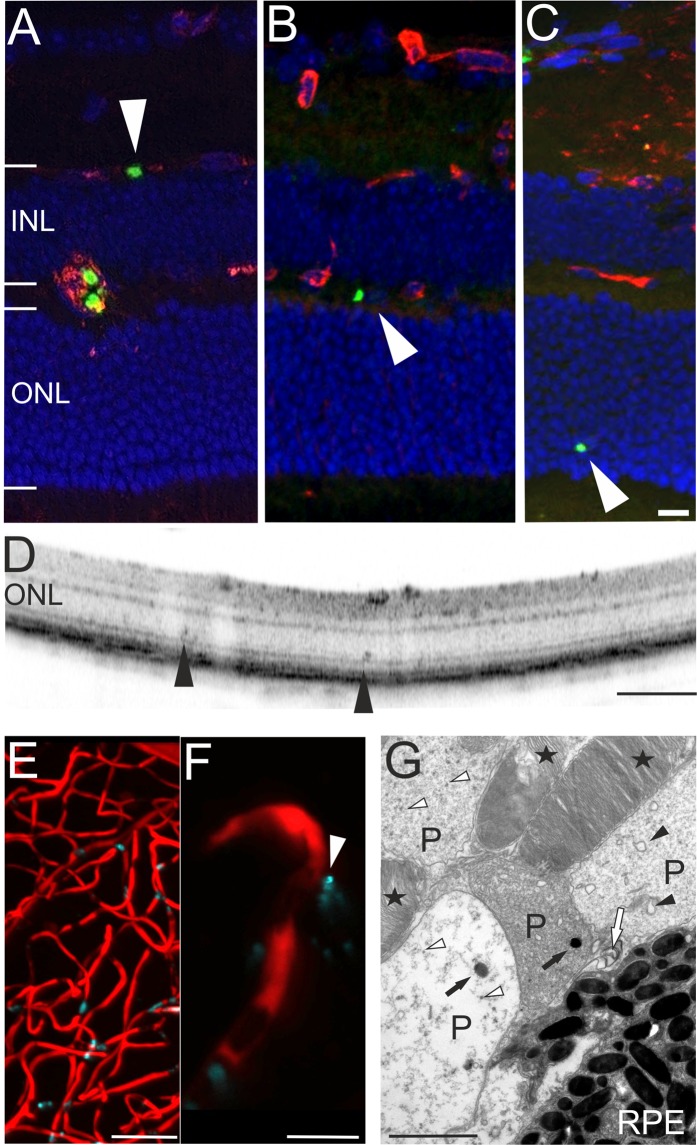
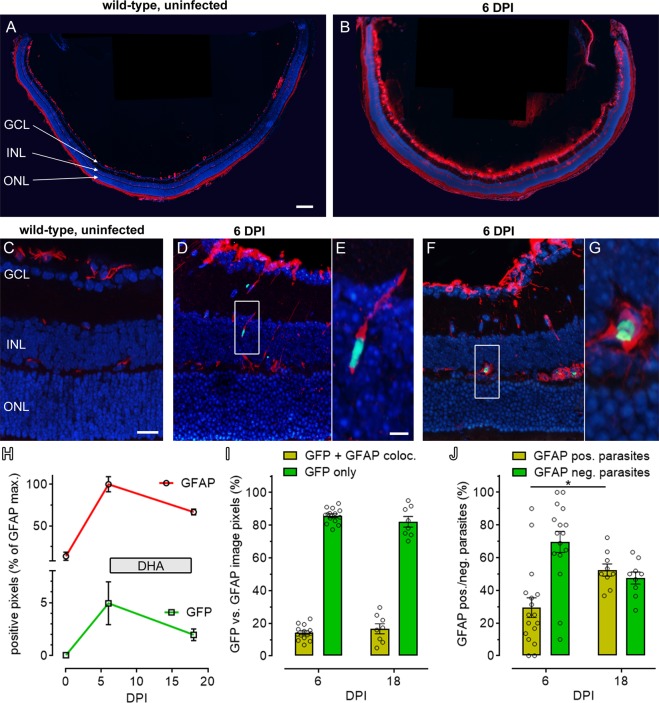
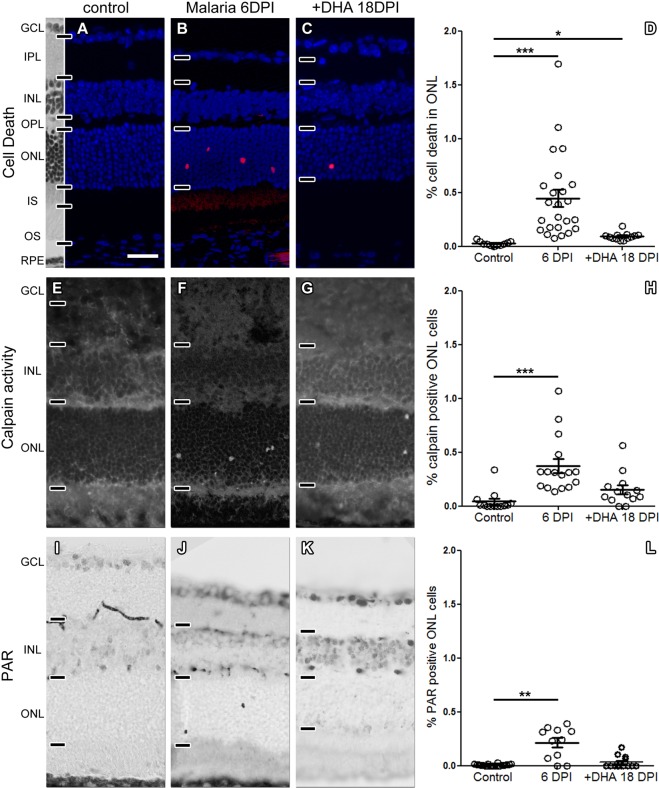
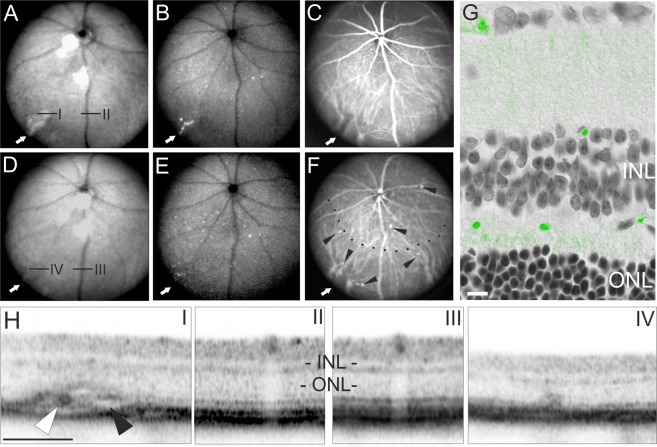
Malaria is a causative factor in about 500.000 deaths each year world-wide. Cerebral malaria is a particularly severe complication of this disease and thus associated with an exceedingly high mortality. Malaria retinopathy is an ocular manifestation often associated with cerebral malaria, and presumably shares a substantial part of its pathophysiology. Here, we describe that indeed murine malaria retinopathy reproduced the main hallmarks of the corresponding human disease. In the living animal, we were able to follow the circulation and cellular localization of malaria parasites transgenically labelled with GFP via non-invasive in vivo retinal imaging. We found that malaria parasites cross the blood-retinal-barrier and infiltrate the neuroretina, concomitant with an extensive, irreversible, and long-lasting retinal neurodegeneration. Furthermore, anti-malarial treatment with dihydroartemisinin strongly diminished the load of circulating parasites but resolved the symptoms of the retinopathy only in part. In summary, we introduce here a novel preclinical model for human cerebral malaria that is much more directly accessible for studies into disease pathophysiology and development of novel treatment approaches. In vivo retinal imaging may furthermore serve as a valuable tool for the early diagnosis of the human disease.


Conflict of interest statement

The authors declare no competing interests.

Figures

Figure 1
Figure 1
Experimental design. Animals were infected with P. berghei (1 Mio parasites i.v.) and examined on several days post-infection (DPI). Measurements included non-invasive, in vivo scanning laser ophthalmoscopy (SLO), optic coherence tomography (OCT), and electroretinography (ERG), as well as determination of parasitaemia and eventually histological workup and analysis. At 6DPI, after in vivo examination, the animals were treated with DHA and monitored for a further 12DPI until experiment end.
Figure 2
Figure 2
In vivo and ex vivo detection of GFP-labelled P. berghei in the retina. (AC) in vivo imaging of a representative animal at 3DPI. (A) SLO AF mode (overview) visualized plasmodia flowing in the blood stream of the large retinal vessels and capillaries (inset: uninfected wild-type). (B) SLO AF mode with focus into deeper retinal layers detected clusters of GFP expressing parasites inside the retina. Regions of interest (ROI) are denoted by black circles. The lines depict the position of the OCT sections. (C) OCT sections with correspondingly numbered ROI visualizing sequestration of parasites. (D,E) Histological sections detected GFP expressing clusters of plasmodia (green) that colocalized with vascular CF8 staining (red). DAPI (blue) was used as nuclear counterstain. Scale bar in C = 200 µm; D = 20 µm.
Figure 3
Figure 3
In vivo SLO imaging directly correlates altered retinal morphology with presence of plasmodia. (A) Native fundus imaging at 3DPI. (B) Magnification. (C,D) AF mode detecting GFP expressing plasmodia. (E) Fluorescein angiography, (F) Indocyanine green angiography. Areas of retinal whitening (arrows in A, 20° fundus overview and B, magnification) could directly be correlated to the presence of GFP expressing plasmodia (arrows in C). Several sites of capillary non-perfusion (CNP) were detected by angiography (E, fluorescein and F, indocyanine green) that could directly be correlated to the plasmodia (examples are denoted by circles in DF) and the areas of retinal whitening (A,B). The numerous sites of CNP accumulated to a large area of reduced tissue perfusion affecting a considerable part of the visible fundus (above the dotted line in DF).
Figure 4
Figure 4
Severe symptoms of malaria retinopathy affecting large vessels. Examination of a representative infected mouse at 6DPI. (A) SLO native imaging with IR mode depicting the position of the respective OCT scan (D). (B) SLO native imaging in RF mode revealed large areas of retinal whitening (asterisks) that could be correlated to areas of non-perfusion (C, asterisks), vascular dilation in native imaging (A, arrow) and in ICG angiography (C, arrow), as well as with fluid accumulation seen in OCT imaging (D, arrowhead). (E) Histological sections detected sequestration of parasites in choroidal vessels. GFP expressing plasmodia (green), vascular CF8 staining (red). Scale bar in D = 200 µm; E = 40 µm.
Figure 5
Figure 5
Evidence for extravascular parasites. (AC) Histological sections revealed parasites (green) that did not colocalize to the vascular CF8 staining (red). In both, OCT imaging (D, arrowheads) and ex vivo histology (C, arrowhead) plasmodia were detected in the avascular outer retina. Two-photon microscopy analysis (E, overview) also revealed extravascular parasites (F, magnification). (G) In electron microscopy, plasmodia (P) displacing the photoreceptor outer segments (asterisks) could be identified based on membrane bound bodies (black arrow heads), food vacuoles with pigment (black arrows), pigment granules (white arrow heads), and the inner membrane complex or plastid of the parasite (white arrow). RPE, retinal pigment epithelium; scale bars: C = 20 µm, D = 200 µm, E = 50 µm, F = 10 µm, G = 2 µm.
Figure 6
Figure 6
Müller glial cell activation indicates neuronal cell death. Uninfected wild-type mice presented with GFAP immunoreactivity (red) in the end feet of Müller glial cells (A,C), In contrast, at 6DPI, malaria infected animals displayed a marked increase of GFAP expression, leading to a labelling of entire Müller cells spanning the whole retina from GCL to ONL (B, DG). Areas of strong GFAP immunoreactivity correlated with presence of P. berghei parasites (green) and in some cases parasites appeared localized within glial cells. GFAP and GFP labelling within the retina increased markedly from 0 to 6DPI and decreased with DHA treatment until 18DPI (H). A comparison of GFP and GFAP co-labelled image pixels did not reveal clear changes from 6DPI to 18 DPI (I). However, counting of GFP-positive parasites that were associated with GFAP-positive Müller cells showed a significant increase of parasites within Müller cells (i.e. GFAP positive parasites) from 6DPI to 18DPI (J). Images in (E,G) are close-ups of (D,F) DAPI (blue) was used as nuclear counterstain; scale bars: A = 200 µm, C = 25 µm, E = 5 µm. n (6DPI) = 14–17 observations from 4 animals, n (18DPI) = 8–9/2; statistical comparison: two-tailed t-test; *p < 0.05.
Figure 7
Figure 7
Malaria causes retinal neurodegeneration. (A,B) When compared to control, at 6DPI, the outer nuclear layer (ONL) of P. berghei infected mice presented with a significantly increased number of dying, TUNEL positive cells (red). (C) At 18DPI, after 12 days of DHA treatment, ONL cell death was reduced, but still significantly higher than in control. (D) Quantification for (AC). (EL) Similarly, calpain activity and cellular accumulation of PAR were increased at 6DPI and brought back down to almost pre-infection levels by DHA treatment. Scale bar in A = 50 µm; n (control) = 11 observations from 6 animals, n (6DPI) = 24/5; n (18DPI) = 13/4; statistical comparisons: one-way ANOVA with Dunn’s post-test, ***p < 0.001; **p < 0.01; *p < 0.05.
Figure 8
Figure 8
Longitudinal analysis of malaria retinopathy during treatment with DHA. (AF) SLO imaging: (A,D) in RF mode, (B,E) GFP detection in AF mode, (C,F) ICG angiography. ROIs (I–IV); (G) histological section. (H) OCT sections corresponding to ROIs in the SLO images. ROIs I, IV show infected areas, while ROIs II, III show unaffected regions with healthy fundus appearance in SLO and normal retinal layering as assessed by OCT. (AC, H I and II) show the analysis at 10DPI (i.e. after 4 days of DHA treatment). (DG, H III and IV) show the 18DPI time point (12 days of treatment). Scale bars in G = 20 µm; H = 200 µm.

References

    1. Gething PW, et al. Mapping Plasmodium falciparum Mortality in Africa between 1990 and 2015. N. Engl. J Med. 2016;375:2435–2445. doi: 10.1056/NEJMoa1606701. - DOI - PMC - PubMed
    1. Helbok R, et al. The Lambarene Organ Dysfunction Score (LODS) is a simple clinical predictor of fatal malaria in African children. J Infect. Dis. 2009;200:1834–1841. doi: 10.1086/648409. - DOI - PubMed
    1. Idro R, et al. Cerebral malaria is associated with long-term mental health disorders: a cross sectional survey of a long-term cohort. Malar. J. 2016;15:184. doi: 10.1186/s12936-016-1233-6. - DOI - PMC - PubMed
    1. Schmutzhard J, et al. Severe malaria in children leads to a significant impairment of transitory otoacoustic emissions–a prospective multicenter cohort study. BMC. Med. 2015;13:125. doi: 10.1186/s12916-015-0366-8. - DOI - PMC - PubMed
    1. Beare NA, Taylor TE, Harding SP, Lewallen S, Molyneux ME. Malaria retinopathy: a newly established diagnostic sign in severe malaria. Am J Trop. Med. Hyg. 2006;75:790–797. doi: 10.4269/ajtmh.2006.75.790. - DOI - PMC - PubMed

Publication types

LinkOut - more resources