

Characterization of Plaque-Sized Variants of Daniel's (DA) Strain in Theiler's Virus-Induced Epilepsy
- PMID: 30837498
- PMCID: PMC6401140
- DOI: 10.1038/s41598-019-38967-z
Characterization of Plaque-Sized Variants of Daniel's (DA) Strain in Theiler's Virus-Induced Epilepsy
Abstract
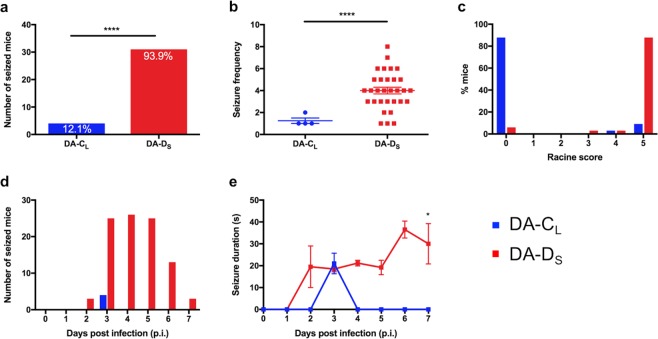
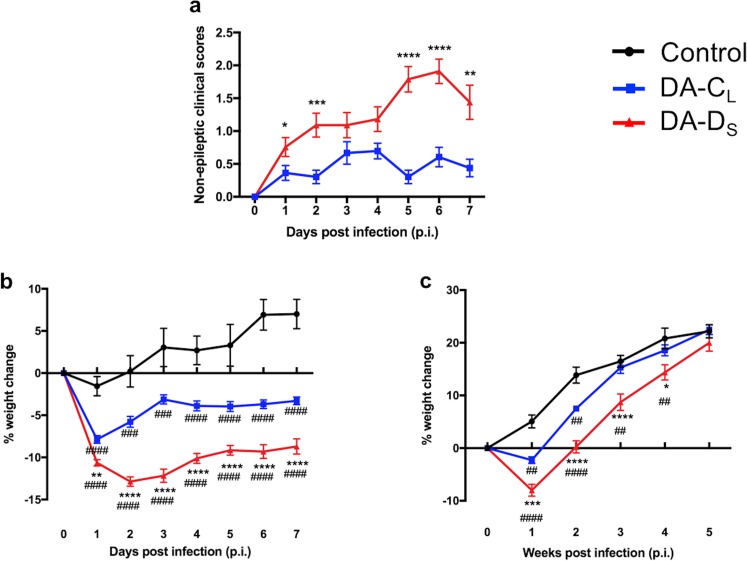
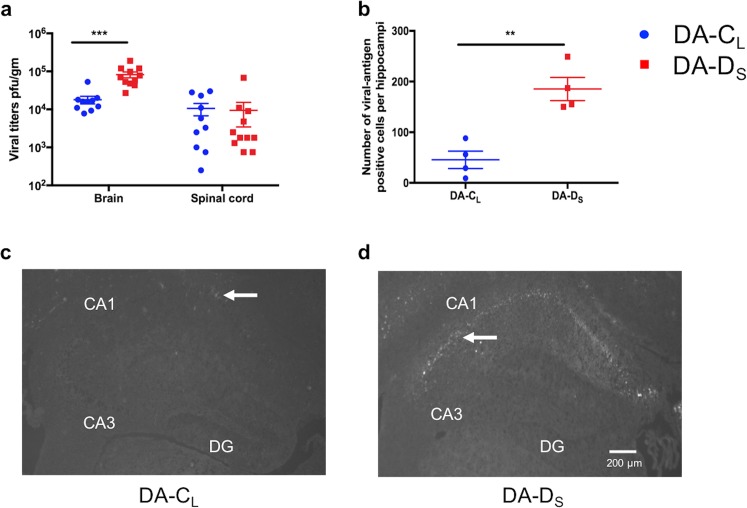
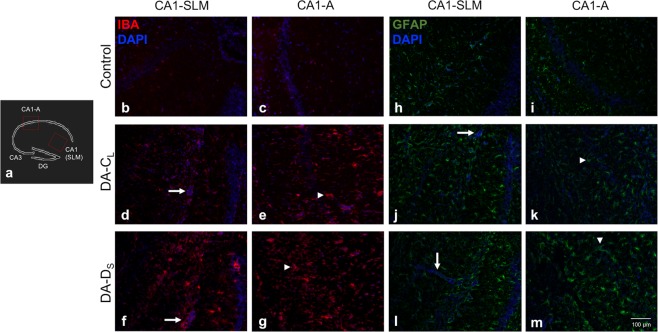
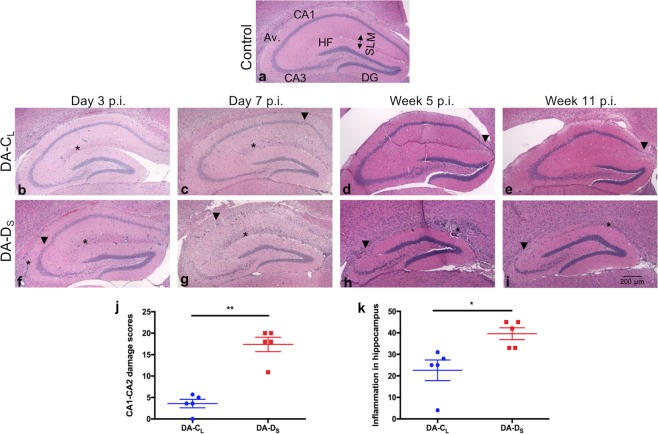
Epilepsy is a complex neurological disease characterized by recurrent seizures. Patients with viral encephalitis have a 16-fold increased risk of developing epilepsy, and this risk can persist for about 15 years after the occurrence of initial viral infection. Theiler's murine encephalomyelitis virus (TMEV) infection induces a well-characterized experimental model of epilepsy in C57BL/6 mice. In response to intracerebral (I.C.) injection of Daniel's (DA) strain of TMEV, there is vigorous immune response, which is detrimental to neurons and contributes to acute seizures, rendering mice susceptible to epilepsy. A comparative in vivo challenge study with either one of the two variants of the DA strain, small (DA-DS) or large (DA-CL) plaque forming variants, revealed differences in the diseases they induced in C57BL/6 mice. Compared to DA-CL-, DA-DS-infected mice exhibited significantly more seizures, higher clinical scores, neuroinflammation, and neuronal damage (mainly in the CA1-CA2 regions of hippocampus). Moreover, the brains of DA-DS infected mice contained approximately five-fold higher virus than those of DA-CL infected mice. A sequence comparison of the DA-CL and DA-DS genome sequences showed mutations in the leader (L) and L* proteins of DA-CL variant, which may be the cause of attenuating phenotype of DA-CL variant in the C57BL/6 mouse model of epilepsy.
Conflict of interest statement
The authors declare no competing interests.
Figures

Similar articles
-
Facets of Theiler's Murine Encephalomyelitis Virus-Induced Diseases: An Update.Int J Mol Sci. 2019 Jan 21;20(2):448. doi: 10.3390/ijms20020448. Int J Mol Sci. 2019. PMID: 30669615 Free PMC article. Review.
-
The role of peripheral interleukin-6 in the development of acute seizures following virus encephalitis.J Neurovirol. 2017 Oct;23(5):696-703. doi: 10.1007/s13365-017-0554-8. Epub 2017 Jul 24. J Neurovirol. 2017. PMID: 28741149 Free PMC article.
-
Evaluating an etiologically relevant platform for therapy development for temporal lobe epilepsy: effects of carbamazepine and valproic acid on acute seizures and chronic behavioral comorbidities in the Theiler's murine encephalomyelitis virus mouse model.J Pharmacol Exp Ther. 2015 May;353(2):318-29. doi: 10.1124/jpet.114.222513. Epub 2015 Mar 9. J Pharmacol Exp Ther. 2015. PMID: 25755209 Free PMC article.
-
Impaired cognitive ability and anxiety-like behavior following acute seizures in the Theiler's virus model of temporal lobe epilepsy.Neurobiol Dis. 2014 Apr;64:98-106. doi: 10.1016/j.nbd.2013.12.015. Epub 2014 Jan 9. Neurobiol Dis. 2014. PMID: 24412221 Free PMC article.
-
Theiler's murine encephalomyelitis virus (TMEV): the role of a small out-of-frame protein in viral persistence and demyelination.Jpn J Infect Dis. 1999 Dec;52(6):228-33. Jpn J Infect Dis. 1999. PMID: 10738359 Review.
Cited by
-
Genetic and immunological contributors to virus-induced paralysis.Brain Behav Immun Health. 2021 Nov 26;18:100395. doi: 10.1016/j.bbih.2021.100395. eCollection 2021 Dec. Brain Behav Immun Health. 2021. PMID: 34917987 Free PMC article.
-
Inflammatory monocytes and microglia play independent roles in inflammatory ictogenesis.J Neuroinflammation. 2022 Jan 29;19(1):22. doi: 10.1186/s12974-022-02394-1. J Neuroinflammation. 2022. PMID: 35093106 Free PMC article.
-
Host genetic diversity drives variable central nervous system lesion distribution in chronic phase of Theiler's Murine Encephalomyelitis Virus (TMEV) infection.PLoS One. 2021 Aug 20;16(8):e0256370. doi: 10.1371/journal.pone.0256370. eCollection 2021. PLoS One. 2021. PMID: 34415947 Free PMC article.
-
IFN-β Deficiency Results in Fatal or Demyelinating Disease in C57BL/6 Mice Infected With Theiler's Murine Encephalomyelitis Viruses.Front Immunol. 2022 Feb 9;13:786940. doi: 10.3389/fimmu.2022.786940. eCollection 2022. Front Immunol. 2022. PMID: 35222374 Free PMC article.
-
Screening of prototype antiseizure and anti-inflammatory compounds in the Theiler's murine encephalomyelitis virus model of epilepsy.Epilepsia Open. 2022 Mar;7(1):46-58. doi: 10.1002/epi4.12550. Epub 2021 Nov 3. Epilepsia Open. 2022. PMID: 34668659 Free PMC article.
References
-
- Lipton, H. L. & Canto, M. C. Theiler’s virus-induced central nervous system disease in mice. UCLA forum in medical sciences, 263–277 (1976). - PubMed
Publication types
MeSH terms
Substances
Grants and funding
LinkOut - more resources
Full Text Sources
Medical
Molecular Biology Databases
Miscellaneous
