. 2019 Mar 5;9(1):3521.
doi: 10.1038/s41598-019-39724-y.

pyPhotometry: Open source Python based hardware and software for fiber photometry data acquisition

Affiliations

pyPhotometry: Open source Python based hardware and software for fiber photometry data acquisition

Thomas Akam et al. Sci Rep. .

Abstract

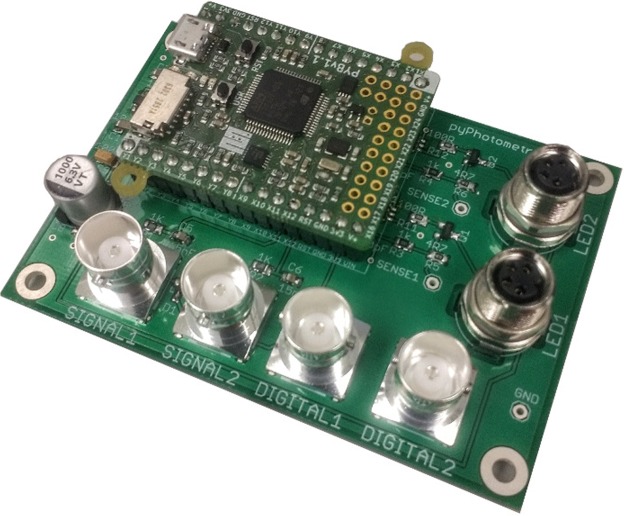
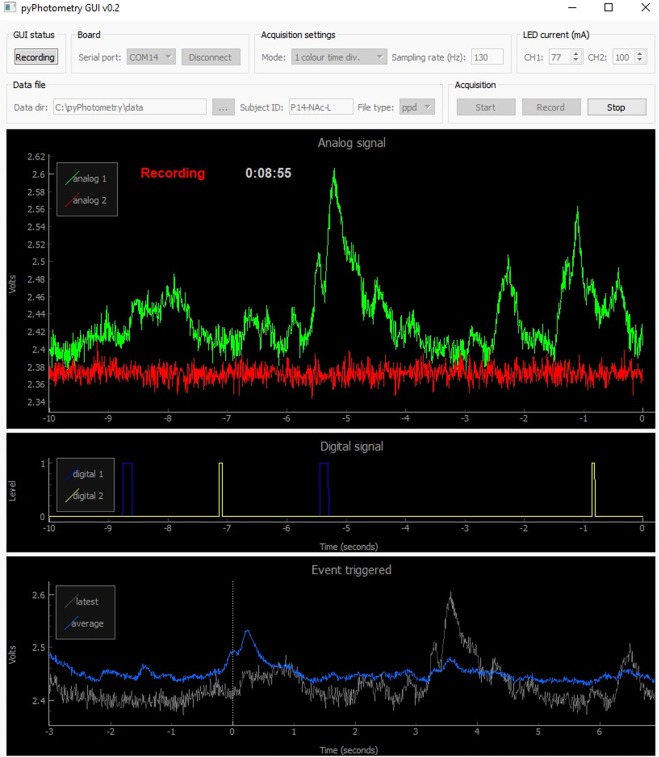
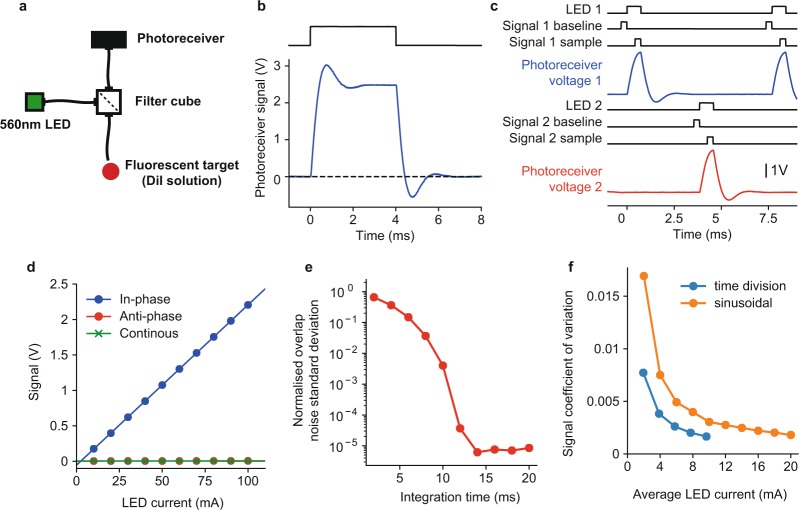
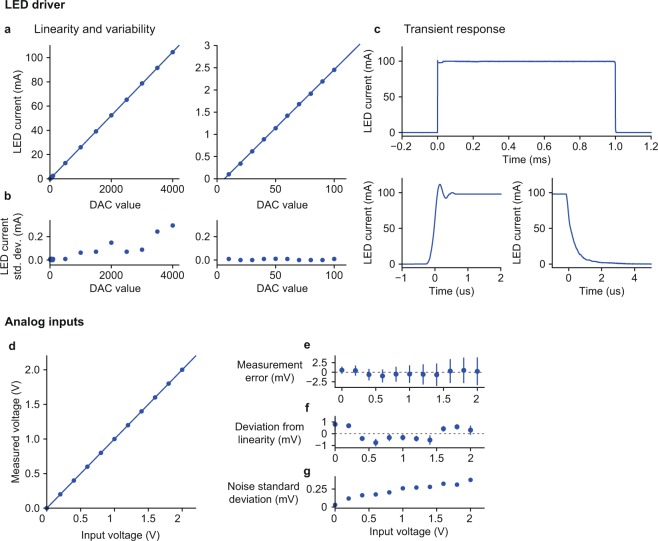
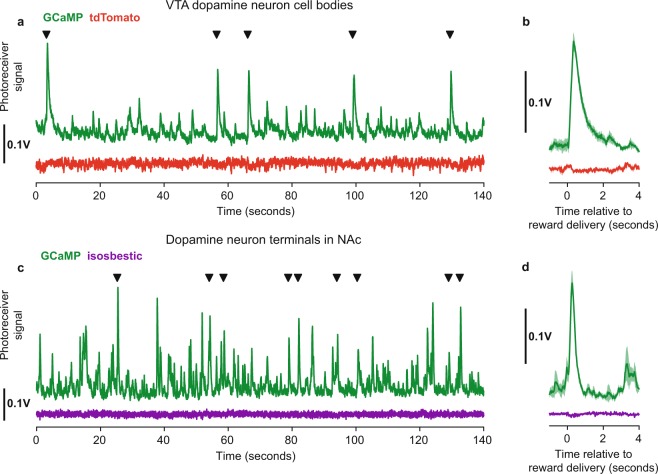
Fiber photometry is the process of recording bulk neural activity by measuring fluorescence changes in activity sensitive indicators such as GCaMP through an optical fiber. We present a system of open source hardware and software for fiber photometry data acquisition consisting of a compact, low cost, data acquisition board built around the Micropython microcontroller, and a cross platform graphical user interface (GUI) for controlling acquisition and visualising signals. The system can acquire two analog and two digital signals, and control two external LEDs via built in LED drivers. Time-division multiplexed illumination allows independent readout of fluorescence evoked by different excitation wavelengths from a single photoreceiver signal. Validation experiments indicate this approach offers better signal to noise for a given average excitation light intensity than sinusoidally-modulated illumination. pyPhotometry is substantially cheaper than commercial hardware filling the same role, and we anticipate, as an open source and comparatively simple tool, it will be easily adaptable and therefore of broad interest to a wide range of users.


Conflict of interest statement

T.A. has a consulting contract with Open Ephys Production Site who sell assembled pyPhotometry acquisition boards. M.E.W. has no competing interests.

Figures

Figure 1
Figure 1
Acquisition board.
Figure 2
Figure 2
Graphical user interface.
Figure 3
Figure 3
Time-division illumination. (a) Optical setup for testing time-division illumination and comparison with sinusoidal illumination. (b) Photoreceiver voltage response to 4 ms illumination light pulse. (c) Timing of events and photoreceiver voltage waveforms for time-division acquisition sequence at 130 Hz sampling rate. Black lines show timing of LED illumination and ADC reads of baseline and sample for signals 1 and 2. Blue and red lines show the photoreceiver voltage waveform due to fluorescence evoked by illumination of LEDs 1 and 2. (d) Baseline subtracted signal as a function of LED current for in-phase illumination, anti-phase illumination and continuous illumination of fluorescent target. (e) Numerical evaluation of the integration time required for orthogonality between sinusoidal modulations at 211 and 531 Hz. Orthogonality was quantified as the standard deviation of the overlap between the two sinusoids normalised by the average overlap of one sinusoid with itself - where overlap between two signals was defined as their product integrated over the time window. (f) Comparison of noise on signals obtained using sinusoidal illumination with lock-in amplification (orange) and time-division illumination with baseline subtraction (blue). Noise was quantified as the coefficient of variation (standard deviation divided by mean) of the signal, as a function of the average LED current.
Figure 4
Figure 4
LED driver and analog input characterisation. (ac) LED driver (a) LED current as a function of the value written to the Pyboard DAC in 12 bit mode, points show average measurement across 4 driver circuits tested, lines show linear fit. Left panel – full range of DAC values, right panel – low range of DAC values. The linear fit is the same on both panels. (b) Standard deviation of LED current across tested driver circuits. (c) Current waveform in response to 1 ms command voltage pulse, top panel - full pulse, bottom panels –rising and falling edges. Line shows average of 32 waveforms, shaded area shows standard deviation (shaded area is hard to see as standard deviation is very small). (df) Analog inputs. (d) Voltage measured by Pyboard analog inputs as a function of input voltage. Points show average of 8 inputs across 4 Pyboards, line shows linear fit. (e) Error between measured voltage and input voltage. Points show mean and error bars show standard deviation across inputs. (f) Deviation from linearity of individual inputs, points show the average residuals from separate linear fits to each input, error bars show the standard deviation of the residuals across inputs. (g) Standard deviation of noise in the measured voltage, point show the mean across inputs.
Figure 5
Figure 5
VTA dopamine neuron recordings. (a) Fluorescent signals acquired in VTA from GCaMP6f (green) and tdTomato (red) expressed in dopamine neurons, recorded using the ‘2 colour time division’ acquisition mode. Black triangles indicate times of unpredictable reward delivery. (b) VTA response aligned on reward delivery, line shows mean and shaded area shows standard error. (c) Signals acquired from GCaMP6f expressing dopamine neuron terminals in nucleus accumbens using the ‘1 colour time division’ acquisition mode with 465 nm illumination (green) and 405 nm isosbestic illumination (purple). (d) NAc terminal response aligned on reward delivery.

References

    1. Adelsberger H, Garaschuk O, Konnerth A. Cortical calcium waves in resting newborn mice. Nat Neurosci. 2005;8:988–990. doi: 10.1038/nn1502. - DOI - PubMed
    1. Cui G, et al. Deep brain optical measurements of cell type–specific neural activity in behaving mice. Nat Protoc. 2014;9:1213–1228. doi: 10.1038/nprot.2014.080. - DOI - PMC - PubMed
    1. Cui G, et al. Concurrent activation of striatal direct and indirect pathways during action initiation. Nature. 2013;494:238–242. doi: 10.1038/nature11846. - DOI - PMC - PubMed
    1. Gunaydin LA, et al. Natural Neural Projection Dynamics Underlying Social Behavior. Cell. 2014;157:1535–1551. doi: 10.1016/j.cell.2014.05.017. - DOI - PMC - PubMed
    1. Lerner TN, et al. Intact-brain analyses reveal distinct information carried by SNc dopamine subcircuits. Cell. 2015;162:635–647. doi: 10.1016/j.cell.2015.07.014. - DOI - PMC - PubMed

Publication types