. 2019 Mar 5;9(1):3532.
doi: 10.1038/s41598-019-39991-9.

Categorization of everyday sounds by cochlear implanted children

Affiliations

Categorization of everyday sounds by cochlear implanted children

Aurore Berland et al. Sci Rep. .

Abstract

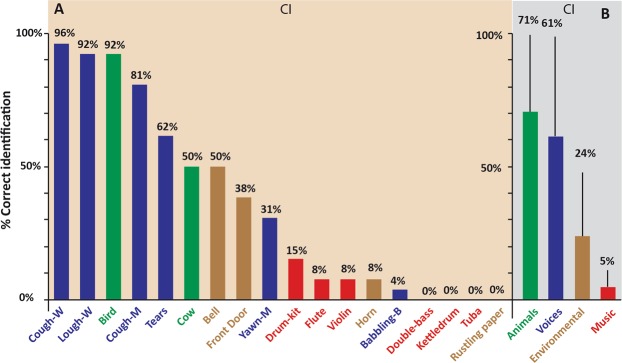
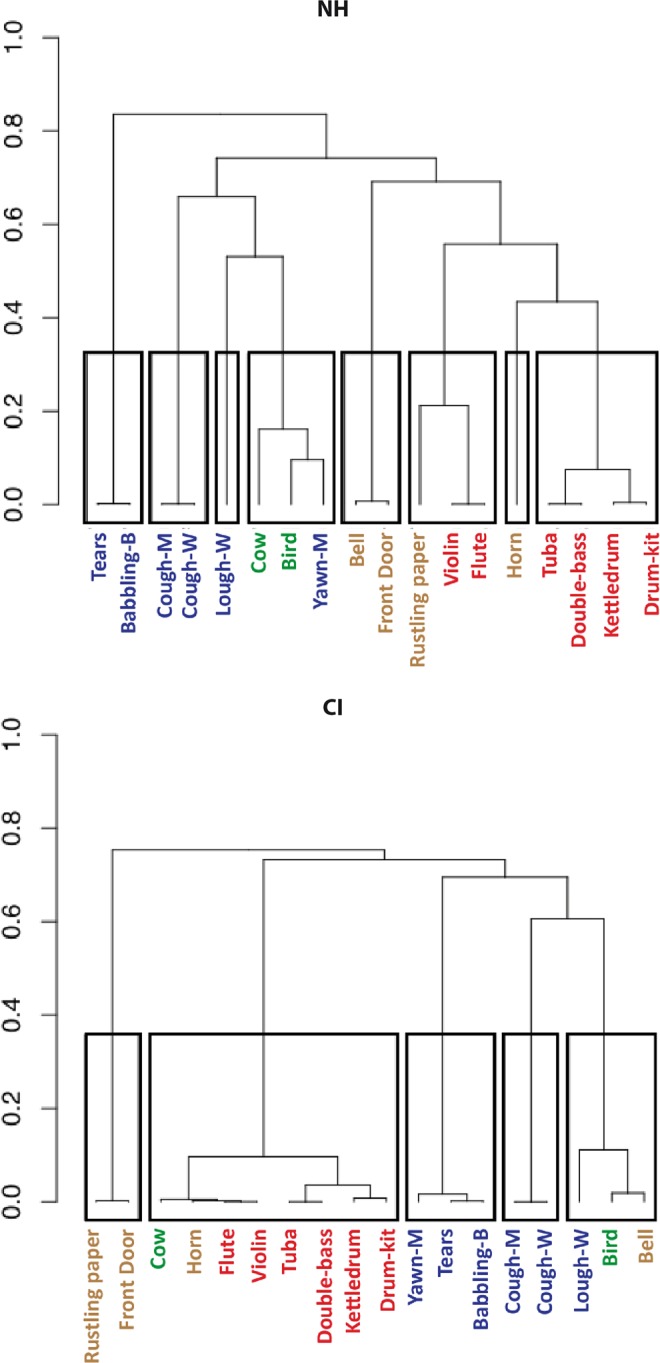
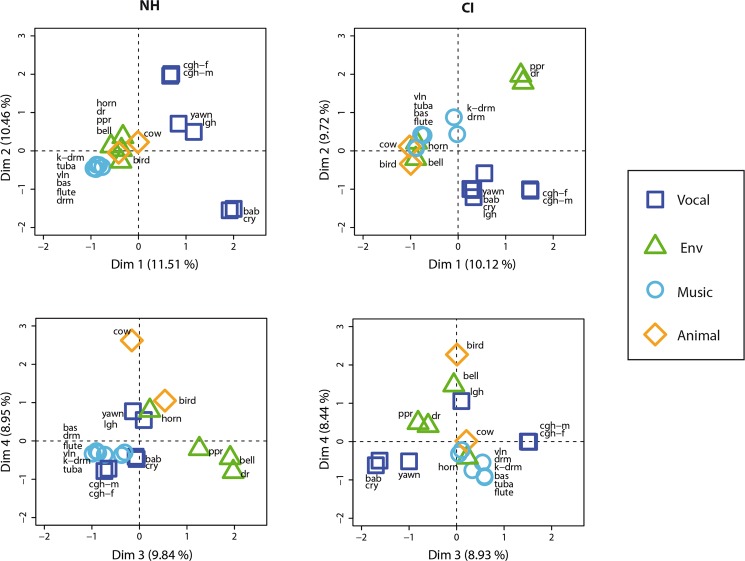
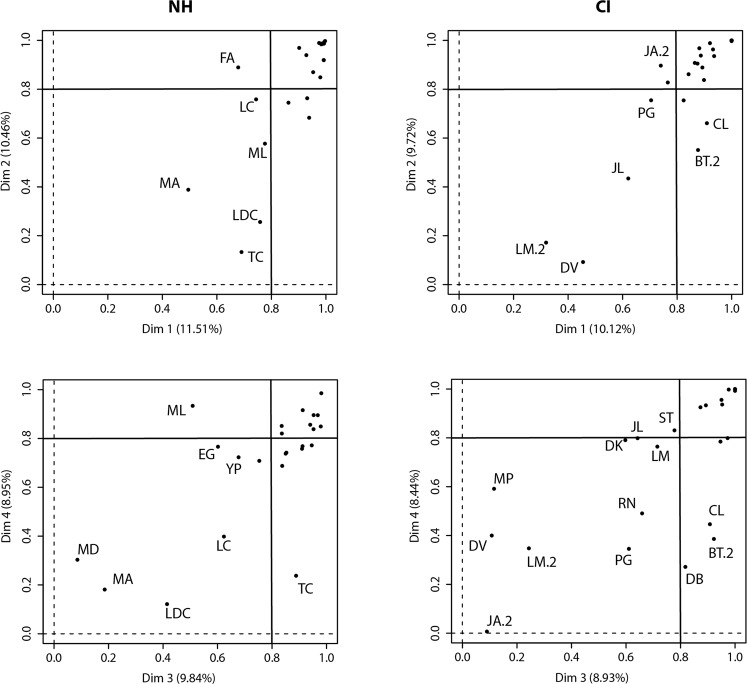
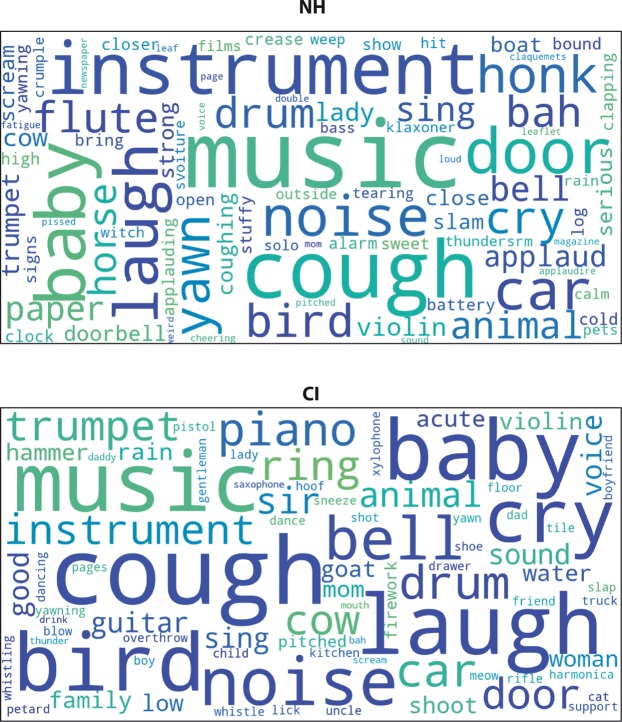
Auditory categorization is an important process in the perception and understanding of everyday sounds. The use of cochlear implants (CIs) may affect auditory categorization and result in poor abilities. The current study was designed to compare how children with normal hearing (NH) and children with CIs categorize a set of everyday sounds. We tested 24 NH children and 24 children with CI on a free-sorting task of 18 everyday sounds corresponding to four a priori categories: nonlinguistic human vocalizations, environmental sounds, musical sounds, and animal vocalizations. Multiple correspondence analysis revealed considerable variation within both groups of child listeners, although the human vocalizations and musical sounds were similarly categorized. In contrast to NH children, children with CIs categorized some sounds according to their acoustic content rather than their associated semantic information. These results show that despite identification deficits, children with CIs are able to categorize environmental and vocal sounds in a similar way to NH children, and are able to use categorization as an adaptive process when dealing with everyday sounds.


Conflict of interest statement

The authors declare no competing interests.

Figures

Figure 1
Figure 1
Bar chart showing percentages of correct sound identification by children with CIs. In Panel A, the 18 everyday sounds are ranked according to the percentage of correct and stable (Response category 1) identification (see Table 3). Different colours are used to indicate the four a priori categories of sounds: nonlinguistic human vocalizations (blue), musical sounds (red), environmental sounds (gold), and animal vocalizations (green). Panel B provides the mean identification performance (correct and stable: Response category 1) for each of the four a priori categories, showing that human vocalizations and animal vocalizations were both well identified by the children with CIs.
Figure 2
Figure 2
Hierarchical clustering dendrograms. The left panel shows the categorization of stimuli by NH children, and the right panel shows the categorization by CI users. The overall categories yielded by the hierarchical clustering analysis (HCPC) are indicated by rectangles, while the upper limits of these rectangles indicate the points at which each dendrogram was cut (as described in the main text). The HCPC used the dimensions selected from the MCA analysis: seven for the NH group and four for the CI group (see Table 4). The height indicates the perceptual distance between each stimulus, such that the greater the height, the more dissimilar the two stimuli were deemed to be by participants, and vice versa. Stimuli are labelled using the abbreviated sound IDs in Table 2.
Figure 3
Figure 3
Factor maps of categories created by participants (sound stimuli). Stimuli are plotted along the first four dimensions yielded by the MCA analysis (Dimensions 1 & 2 along the top row, and Dimensions 3 & 4 along the bottom row) for NH children (left column) and CI users (right column). The amount of variance accounted for by each dimension is given as a percentage on the x- and y-axes, and all plots use the same scale. Stimuli that lie on the dotted line (zero) are not considered to be part of the corresponding dimension. Finally, the stimuli are coloured according to the a priori categories and labelled using the abbreviated sound IDs given in Table 2.
Figure 4
Figure 4
Factor maps of category variables (participants). Similar to Fig. 3, participants are plotted along the first two dimensions of the MCA analysis. This is done to show how strongly each participant adhered to the use of a particular dimension, with high values indicating strong adherence. To avoid clutter, subject codes are provided only for outliers (often below the contribution value of 0.8 for any dimension). Percentages are again given to show the variance covered by each dimension.
Figure 5
Figure 5
Word clouds of category descriptors. Word clouds show the words that were most used by participants to describe the categories they created in the FST (using Python package Wordcloud). The size the words reflects the frequency with which they were used by both groups (NH and CI). It should be noted that this figure does not reflect differences in the frequency of word usage between the groups (children with CIs generally used the words less frequently). For example, the word most frequently used by the children with CIs was cough, but they used it 30% less frequently than the NH children.

References

    1. Wilson K, et al. Cochlear implant assessment and candidacy for children with partial hearing. Cochlear Implants International. 2016;17:66–69. doi: 10.1080/14670100.2016.1152014. - DOI - PubMed
    1. Heman-Ackah SE, Roland JT, Haynes DS, Waltzman SB. Pediatric cochlear implantation: candidacy evaluation, medical and surgical considerations, and expanding criteria. Otolaryngol. Clin. North Am. 2012;45:41–67. doi: 10.1016/j.otc.2011.08.016. - DOI - PubMed
    1. Davidson LS, Geers AE, Blamey PJ, Tobey EA, Brenner C. Factors contributing to speech perception scores in long-term pediatric CI users. Ear and Hearing. 2011;32:19S–26S. doi: 10.1097/AUD.0b013e3181ffdb8b. - DOI - PMC - PubMed
    1. Leybaert, J. et al. Effet de l’implant cochléaire sur le développement du langage et l’architecture cognitive de l’enfant sourd. in L’acquisition du langage par l’enfant sourd: les signes, l’oral et l’écrit (eds Transler, C., Leybaert, J. & Gombert, J.-E.) 173–193 (Solal, 2005).
    1. Shannon RV, Zeng FG, Kamath V, Wygonski J, Ekelid M. Speech recognition with primarily temporal cues. Science. 1995;270:303–304. doi: 10.1126/science.270.5234.303. - DOI - PubMed

Publication types