

Inter-relationship between subtropical Pacific sea surface temperature, Arctic sea ice concentration, and North Atlantic Oscillation in recent summers
- PMID: 30837570
- PMCID: PMC6401109
- DOI: 10.1038/s41598-019-39896-7
Inter-relationship between subtropical Pacific sea surface temperature, Arctic sea ice concentration, and North Atlantic Oscillation in recent summers
Abstract
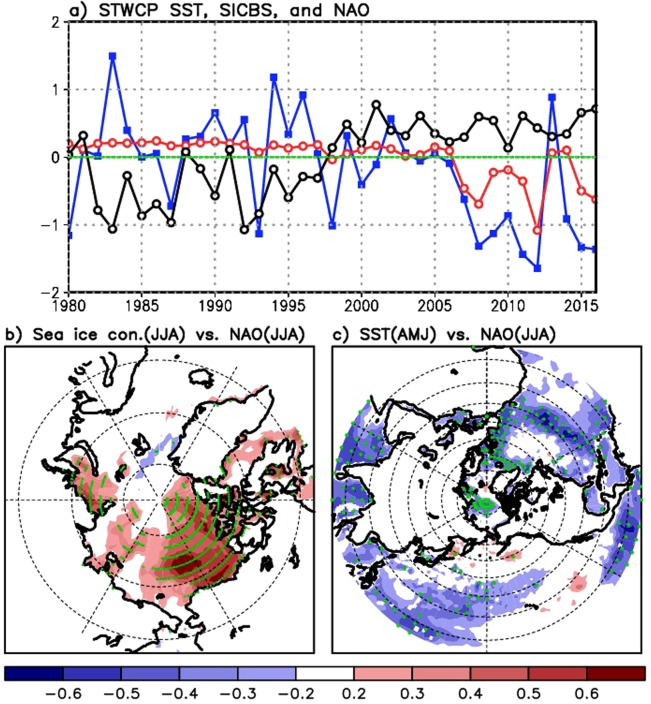
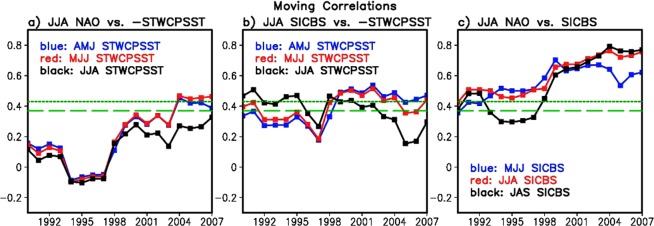
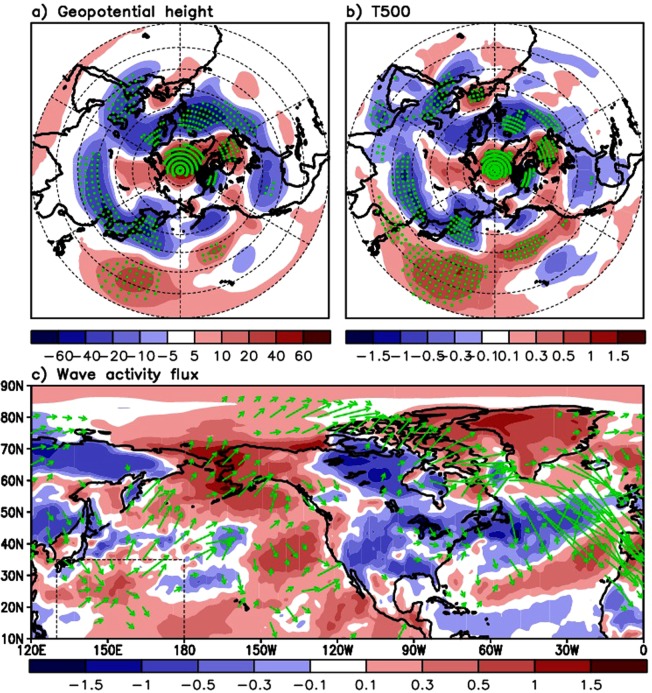
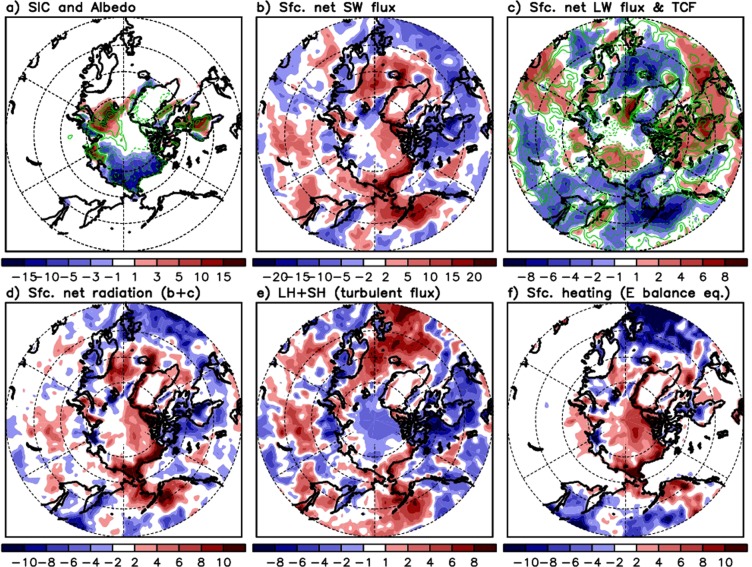
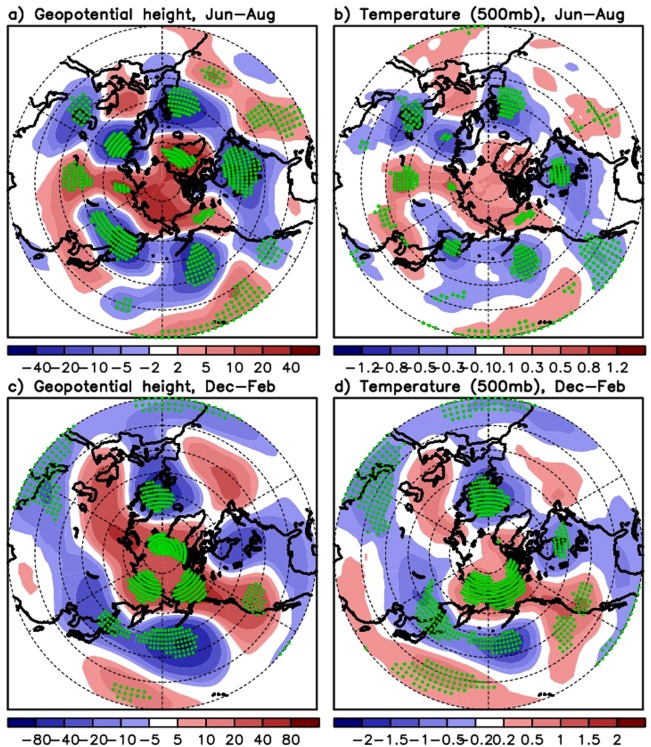
The inter-relationship between subtropical western-central Pacific sea surface temperatures (STWCPSST), sea ice concentrations in the Beaufort Sea (SICBS), and the North Atlantic Oscillation (NAO) in summer are investigated over the period 1980-2016. It is shown that the Arctic response to the remote impact of the Pacific SST is more dominant in recent summers, leading to a frequent occurrence of the negative phase of the NAO following the STWCPSST increase. Lag-correlations of STWCPSST positive (negative) anomalies in spring with the negative (positive) NAO and SICBS loss (recovery) in summer have increased over the last two decades, reaching r = 0.4-0.5 with significance at the 5 percent level. Both observations and the atmospheric general circulation model experiments suggest that the positive STWCPSST anomaly and subsequent planetary-scale wave propagation act to increase the Arctic upper-level geopotential heights and temperatures in the following season. This response extends to Greenland, providing favorable conditions for developing the negative phase of the NAO. Connected with this atmospheric response, SIC and surface albedo decrease with an increase in the surface net shortwave flux over the Beaufort Sea. Examination of the surface energy balance (radiative and turbulent fluxes) reveals that surplus energy that can heat the surface increases over the Arctic, enhancing the SIC reduction.
Conflict of interest statement
The authors declare no competing interests.
Figures
References
-
- NOAA National Oceanic and Atmospheric Administration. Standardized Northern Hemisphere teleconnection indices, ftp://ftp.cpc.ncep.noaa.gov/wd52dg/data/indices/tele_index.nh Accessed Mar 2018.
-
- Fettweis X, et al. Important role of the mid-tropospheric atmospheric circulation in the recent surface melt increase over the Greenland ice sheet. Cryosphere. 2013;7:241–248. doi: 10.5194/tc-7-241-2013. - DOI
-
- Hanna E, Cropper TE, Jones PD, Scaife AA, Allan R. Recent seasonal asymmetric changes in the NAO (a marked summer decline and increased winter variability) and associated changes in the AO and Greenland Blocking Index. Int. J. Climatol. 2015;35:2540–2554. doi: 10.1002/joc.4157. - DOI
-
- Hanna E, et al. Hydrologic response of the Greenland ice sheet: The role of oceanographic warming. Hydrol. Processes. 2009;23:7–30. doi: 10.1002/hyp.7090. - DOI
-
- Hanna E, et al. Atmospheric and oceanic climate forcing of the exceptional Greenland ice sheet surface melt in summer 2012. Int. J. Climatol. 2014;34:1022–1037. doi: 10.1002/joc.3743. - DOI
Grants and funding
- 12-IDS12-0120/NASA | Goddard Space Flight Center (NASA's Goddard Space Flight Center)
- 12-IDS12-0120/NASA | Goddard Space Flight Center (NASA's Goddard Space Flight Center)
- 12-IDS12-0120/NASA | Goddard Space Flight Center (NASA's Goddard Space Flight Center)
- 12-IDS12-0120/NASA | Goddard Space Flight Center (NASA's Goddard Space Flight Center)
LinkOut - more resources
Full Text Sources
