

Event-to-event intensification of the hydrologic cycle from 1.5 °C to a 2 °C warmer world
- PMID: 30837575
- PMCID: PMC6400949
- DOI: 10.1038/s41598-019-39936-2
Event-to-event intensification of the hydrologic cycle from 1.5 °C to a 2 °C warmer world
Abstract
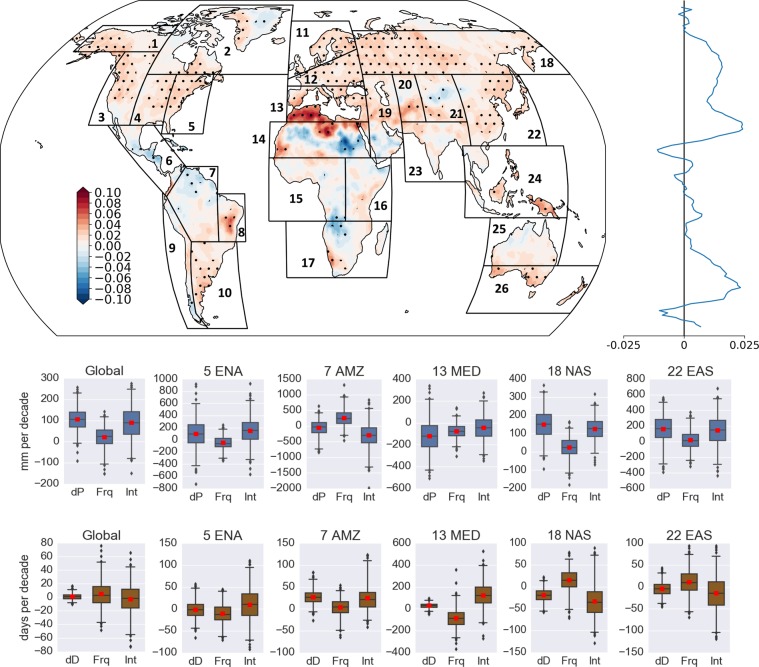
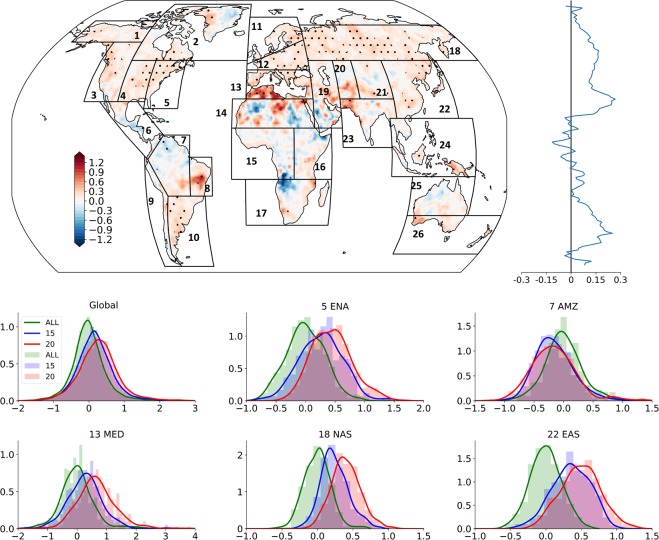
The Paris agreement was adopted to hold the global average temperature increase to well below 2 °C and pursue efforts to limit it to 1.5 °C. Here, we investigate the event-to-event hydroclimatic intensity, where an event is a pair of adjacent wet and dry spells, under future warming scenarios. According to a set of targeted multi-model large ensemble experiments, event-wise intensification will significantly increase globally for an additional 0.5 °C warming beyond 1.5 °C. In high latitudinal regions of the North American continent and Eurasia, this intensification is likely to involve overwhelming increases in wet spell intensity. Western and Eastern North America will likely experience more intense wet spells with negligible changes of dry spells. For the Mediterranean region, enhancement of dry spells seems to be dominating compared to the decrease in wet spell strength, and this will lead to an overall event-wise intensification. Furthermore, the extreme intensification could be 10 times stronger than the mean intensification. The high damage potential of such drastic changes between flood and drought conditions poses a major challenge to adaptation, and the findings suggest that risks could be substantially reduced by achieving a 1.5 °C target.
Conflict of interest statement
The authors declare no competing interests.
Figures
References
-
- UNFCCC. Adoption of the Paris Agreement FCCC/CP/2015/L.9/Rev.1, http://unfccc.int/resource/docs/2015/cop21/eng/l09r01.pdf, United Nations Framework Convention on Climate Change (2015).
-
- Mitchell D, et al. Realizing the impacts of a 1.5 °C warmer world. Nat. Clim. Change. 2016;6:735–737. doi: 10.1038/nclimate3055. - DOI
-
- Mitchell D, et al. Half a degree additional warming, prognosis and projected impacts (HAPPI): background and experimental design. Geosci. Model Dev. 2017;10:571. doi: 10.5194/gmd-10-571-2017. - DOI
-
- IPCC Global Warming of 1.5 °C (eds Masson-Delmotte, V. et al.) (World Meteorological Organization, 2018).
Publication types
LinkOut - more resources
Full Text Sources
