. 2019 Mar 5;9(1):3451.
doi: 10.1038/s41598-019-40129-0.

Nucleation and Formation of a Primary Clot in Insect Blood

Affiliations

Nucleation and Formation of a Primary Clot in Insect Blood

Pavel Aprelev et al. Sci Rep. .

Abstract

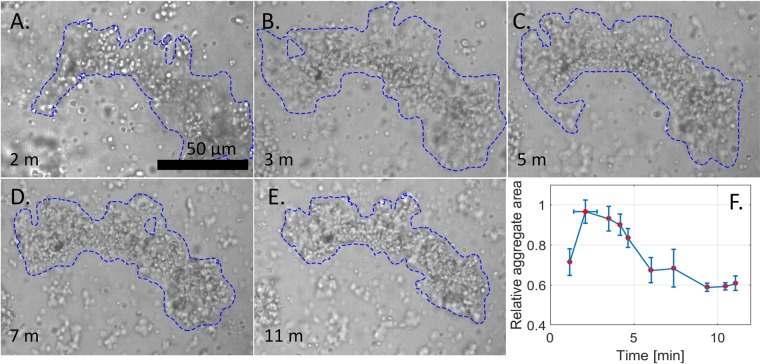
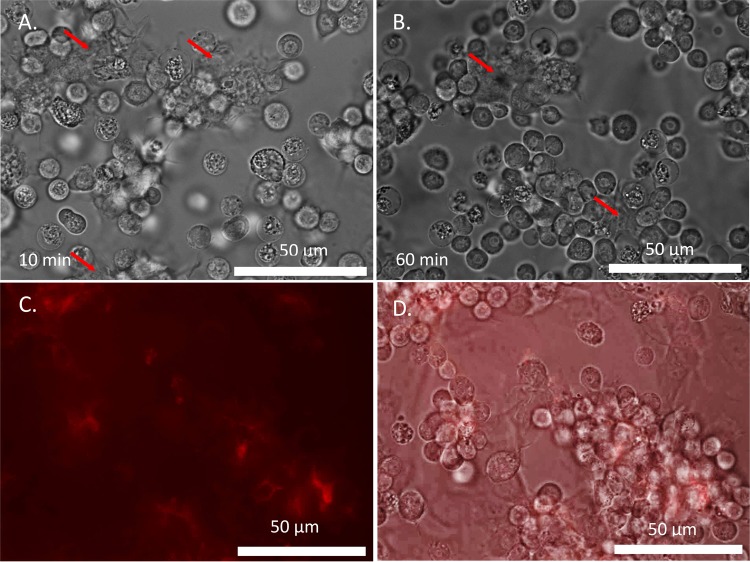
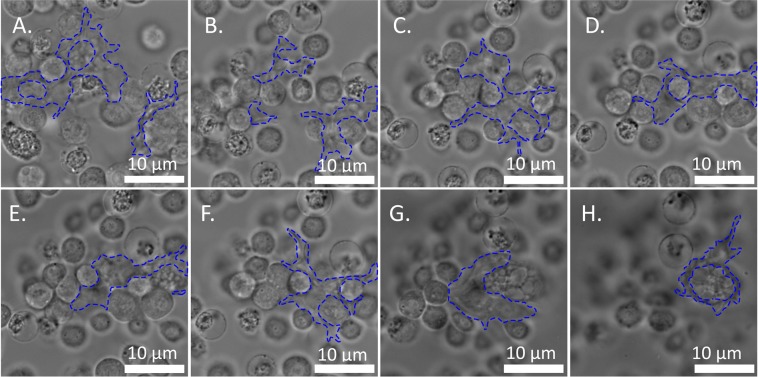
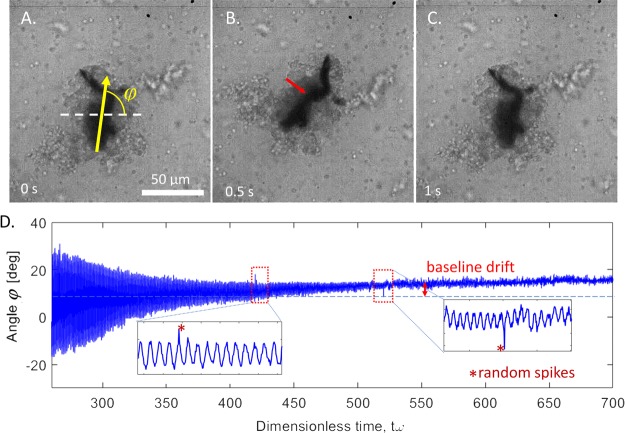
Blood clotting at wound sites is critical for preventing blood loss and invasion by microorganisms in multicellular animals, especially small insects vulnerable to dehydration. The mechanistic reaction of the clot is the first step in providing scaffolding for the formation of new epithelial and cuticular tissue. The clot, therefore, requires special materials properties. We have developed and used nano-rheological magnetic rotational spectroscopy with nanorods to quantitatively study nucleation of cell aggregates that occurs within fractions of a second. Using larvae of Manduca sexta, we discovered that clot nucleation is a two-step process whereby cell aggregation is the time-limiting step followed by rigidification of the aggregate. Clot nucleation and transformation of viscous blood into a visco-elastic aggregate happens in a few minutes, which is hundreds of times faster than wound plugging and scab formation. This discovery sets a time scale for insect clotting phenomena, establishing a materials metric for the kinetics of biochemical reaction cascades. Combined with biochemical and biomolecular studies, these discoveries can help design fast-working thickeners for vertebrate blood, including human blood, based on clotting principles of insect blood.


Conflict of interest statement

The authors declare no competing interests.

Figures

Figure 1
Figure 1
Growth and shrinkage of cellular aggregates in incubating hemolymph. (AE) A gallery of bright-field micrographs of an in-vitro incubating droplet of blood from a larva of M. sexta. Cells can be seen as bright and dark circles freely floating in the fluid (grey background) and as part of the aggregate (blue outline); t is the incubation time of the sample. The boundary of the aggregate was determined using a Photoshop user-assisted image analysis algorithm, Quick Selection Tool. (F) Average non-dimensional area of aggregates of three larvae as a function of incubation time, t. The area was normalized by its maximum for each aggregate. The rate of area shrinkage approaches 0 after about 10 minutes of incubation.
Figure 2
Figure 2
Micrographs of incubated hemolymph aggregates. (A,B) Time-lapse snapshots taken in the same location at t = 2 minutes (A) and t = 7 minutes (B) after extraction under an inverted transmitted-light phase-enhanced microscope. Aggregation of cells connected with an amorphous dark grey material is visible (red arrow). As incubation time increases, the aggregates become more closely packed and the grey material darkens. The average distance between adjacent cells at t = 2 minutes is 8.9 ± 1.5 μm (N = 27) and at t = 7 minutes is 7.6 ± 1.1 μm (N = 37). (C,D) Fluorescent micrograph of hemolymph stained with Rhodamine-labeled PNA and incubated for 8–15 minutes. (C) Brighter red corresponds to higher protein concentration. The labeled proteins line the outer walls of the hemocytes inside the formed aggregates. (D) A composite image of phase-enhanced (greyscale) and fluorescence (red) micrographs of formed hemocyte aggregates. The phase-enhanced portion of the image reveals hemocyte aggregates, and the fluorescent portion of the image reveals glycosylated proteins in the aggregates.
Figure 3
Figure 3
Growth of a single pseudopodial thread (red arrow). The thread bends as it extends, eventually adhering to the surface of another cell.
Figure 4
Figure 4
Time-lapse developmental series of pseudopodial extensions and intercellular matrix (outlined in blue). The extensions originate from only a few cells and can stretch for tens of microns. (See SI for video).
Figure 5
Figure 5
Rotation of a cluster of Ni nanorods embedded in the cell aggregate. (AC) Snapshots of the aggregate oscillations detected five minutes after insect wounding and blood extraction. The panels show the maximum and the minimum declinations from the mean orientation during one period of oscillation. The dark cluster of Ni nanorods is indicated with a red arrow in panel B. The cells form a large grey clump around the nanorods. (D) Time dependence of angle φ. The amplitude of oscillations decreases with time exponentially, exp(t/τ), which signifies an increasing rigidity of the material. The specifics of the probe fluctuations are illustrated in the inserts. In this example, τ = 77 s.
Figure 6
Figure 6
Schematics of two scenarios of material response to probe oscillation. The probe is modeled as a rod with its original horizontal position, B is the vector of applied magnetic field and m is magnetic moment of the nanorod. The probe is surrounded by a cellular matrix. A Newtonian scenario is analyzed for reference. (A) The probe is partially embedded in an elastic aggregate and exposed to viscous fluid. The elastic and viscous drag are added in series. (B) The probe is completely embedded in the gel-like aggregate, which produces an elastic and a viscous torque simultaneously; hence, the spring and dashpot are in parallel. The symbols are explained in the text. (CE) Numerical analysis of rotation of a ferromagnetic probe in viscous Newtonian (blue), Maxwell (orange), and Kelvin-Voigt (yellow) materials. For illustration, the following parameters were used in calculations ωcr = 1, ωc(tω)/ω=ω˜c0exp(tω/τω), and ω˜c0 = 0.3, τω= 75. (C) Elastic modulus is constant and viscosity increases exponentially. (D) Elastic modulus and viscosity increase exponentially. (E) A plot of the behavior of the Maxwell model using the experimentally obtained parameters: ω˜c0 = 0.25, τω = 85, ωr = 0.55. The theoretically obtained profile is similar to the experimentally obtained profile in Fig. 5D.

References

    1. Salt, G. The cellular defence reactions of insects. (Cambridge University Press, 1970).
    1. Gillespie JP, Kanost MR, Trenczek T. Biological mediators of insect immunity. Annu. Rev. Entomol. 1997;42:611–643. doi: 10.1146/annurev.ento.42.1.611. - DOI - PubMed
    1. Jiang, H., Vilcinskas, A. & Kanost, M. R. In Invertebrate Immunity Vol. 708 Advances in experimental medicine and biology (ed K. Soderhall) 181–204 (Springer-Verlag Berlin, 2010).
    1. Strand MR. The insect cellular immune response. Insect Sci. 2008;15:1–14. doi: 10.1111/j.1744-7917.2008.00183.x. - DOI
    1. Dushay MS. Insect hemolymph clotting. Cell. Mol. Life Sci. 2009;66:2643–2650. doi: 10.1007/s00018-009-0036-0. - DOI - PMC - PubMed

Publication types