. 2019 Mar 5;9(1):3430.
doi: 10.1038/s41598-019-40158-9.

Active propagation of dendritic electrical signals in C. elegans

Affiliations

Active propagation of dendritic electrical signals in C. elegans

Tomomi Shindou et al. Sci Rep. .

Abstract

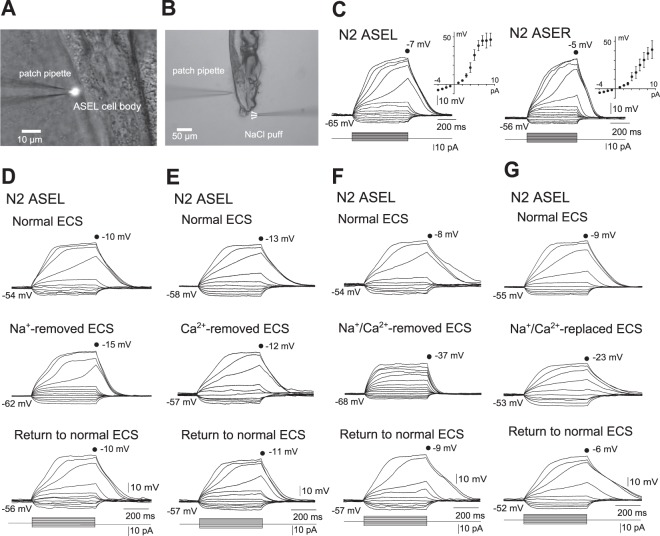
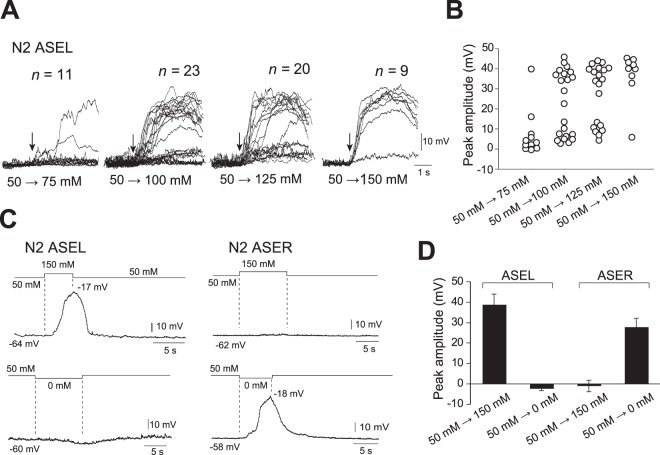
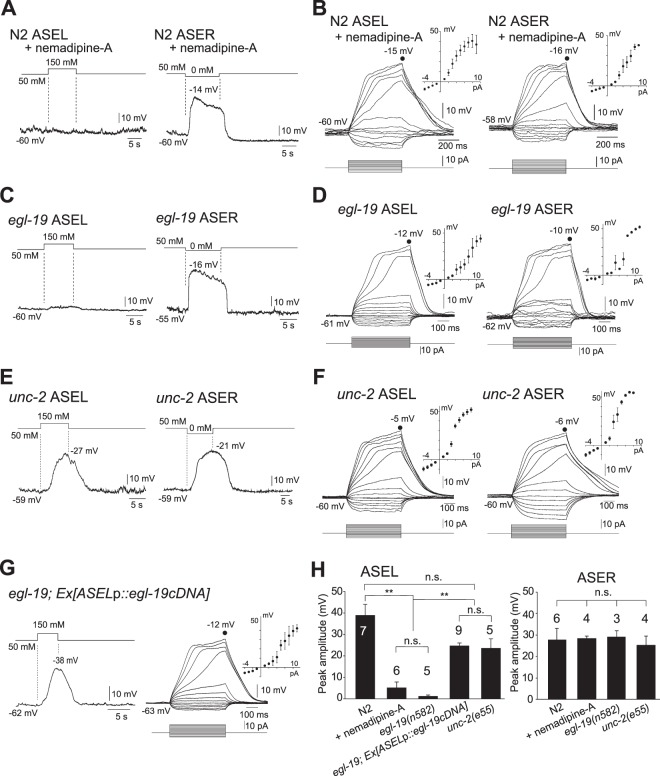
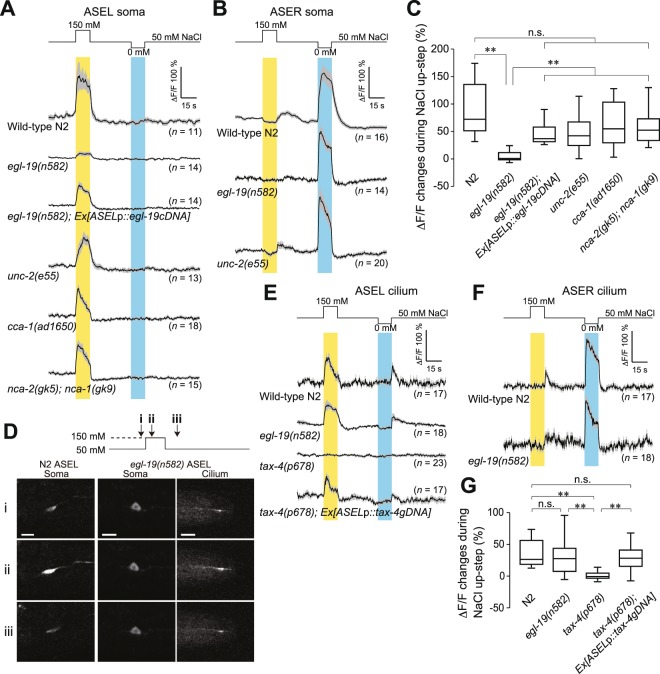
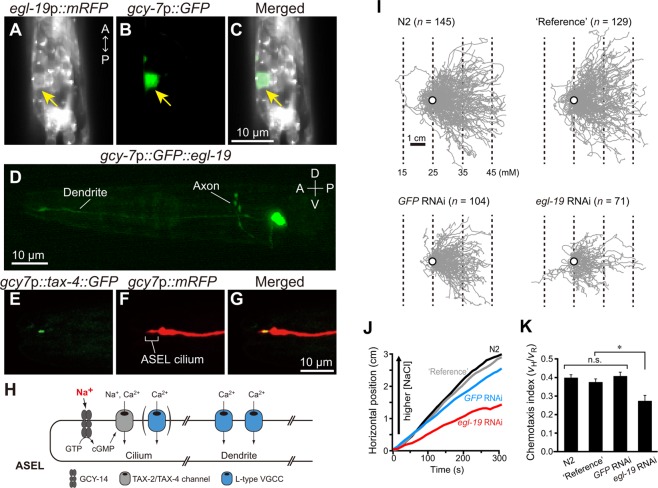
Active propagation of electrical signals in C. elegans neurons requires ion channels capable of regenerating membrane potentials. Here we report regenerative depolarization of a major gustatory sensory neuron, ASEL. Whole-cell patch-clamp recordings in vivo showed supralinear depolarization of ASEL upon current injection. Furthermore, stimulation of animal's nose with NaCl evoked all-or-none membrane depolarization in ASEL. Mutant analysis showed that EGL-19, the α1 subunit of L-type voltage-gated Ca2+ channels, is essential for regenerative depolarization of ASEL. ASEL-specific knock-down of EGL-19 by RNAi demonstrated that EGL-19 functions in C. elegans chemotaxis along an NaCl gradient. These results demonstrate that a natural substance induces regenerative all-or-none electrical signals in dendrites, and that these signals are essential for activation of sensory neurons for chemotaxis. As in other vertebrate and invertebrate nervous systems, active information processing in dendrites occurs in C. elegans, and is necessary for adaptive behavior.


Conflict of interest statement

The authors declare no competing interests.

Figures

Figure 1
Figure 1
Whole-cell, current-clamp recordings in vivo of ASE neurons in wild-type N2 animals. (A) Image of a patch-clamp recording. gcy-7p::GFP-transfected N2 specifically producing GFP in ASEL was glued to a cover glass, and was transferred to a recording chamber. Under a microscope, a small piece of cuticle and body wall was dissected to exteriorize ASEL cell bodies. (B) Image of an animal under stimulation with NaCl-containing buffer. Animals were treated with the same procedures as in (A), and their nose tips were stimulated with NaCl solutions released from a puffing capillary. (C) Membrane voltage changes in response to current steps and averaged I-V curves in wild-type ASEL (left, n = 22) and ASER (right, n = 7). Error bars, s.e.m. (DG) Membrane voltage changes in response to current steps in wild-type ASEL. Current-clamp recordings of an animal were carried out three times consecutively, first and third in normal ECS (top and bottom), and the second in ECS, from which Na+ was removed (Na+-removed ECS) (D), Ca2+ of which was removed (Ca2+-removed ECS) (E), Na+ and Ca2+ of which were removed (Na+/Ca2+-removed ECS. In this experiment, current was injected until the membrane potential exceeded −40 mV) (F), or Na+ and Ca2+ of which were replaced with NMDG+ and Mg2+ (Na+/Ca2+-replaced ECS) (G). These are representatives of at least three independent recordings.
Figure 2
Figure 2
Membrane depolarization evoked by application of various concentrations of NaCl to the nose tips of animals. (A) Membrane voltage traces of ASEL in response to 75 mM, 100 mM, 125 mM, or 150 mM NaCl. An experimental setting is shown in Fig. 1B. Vertical arrows indicate onset times of NaCl-evoked depolarization. Voltage traces from different animals were superimposed by synchronizing onset times at the same position. (B) Peak amplitudes, which are shown by circles, of membrane voltage traces shown in (A). (C) Membrane voltage traces of ASEL and ASER in response to application of 150 mM NaCl or NaCl-free buffer, respectively. Note that ASEL and ASER responded to increases and decreases of NaCl concentration, respectively. (D) Mean amplitudes of membrane voltage peaks in response to 150 mM NaCl or NaCl-free buffer (ASEL: n = 7 up-steps, n = 3 down-steps; ASER: n = 4 up-steps, n = 6 down-steps). Error bars, s.e.m.
Figure 3
Figure 3
EGL-19 plays an essential role in active propagation of electrical signals in ASEL. (A,B) Membrane voltage traces of wild-type ASEL and ASER in the presence of nemadipine-A, 1.0 μM, upon stimulation with 150 mM NaCl and NaCl-free buffer, respectively, to the nose tips of animals (A), or upon current steps with mean I-V curves (ASEL: n = 6, ASER: n = 4) (B). (C,D) Membrane voltage traces of ASEL and ASER in egl-19 mutants upon stimulation with 150 mM NaCl and NaCl-free buffer, respectively (C), or upon current injection with mean I-V curves (ASEL: n = 5, ASER: n = 3) (D). (E,F) Membrane voltage traces of ASEL and ASER in unc-2 mutants upon stimulation with 150 mM NaCl and NaCl-free buffer, respectively (E), or upon current injection with mean I-V curves (ASEL: n = 5, ASER: n = 4) (F). (G) Membrane voltage traces of ASEL in egl-19 transgenic animals specifically producing wild-type EGL-19 in ASEL upon stimulation with 150 mM NaCl buffer (left), or upon current injection with mean I-V curves (right, n = 9). (H) Mean amplitudes of membrane voltage peaks of the traces shown above in (A,C,E,G). Numbers above bars indicate numbers of animals measured. N2 data are derived from Fig. 2D. **p < 0.01, n.s., not significant by one-way ANOVA with Dunn’s test. Error bars, s.e.m.
Figure 4
Figure 4
Ca2+ transients in cell body and sensory cilium of ASE neurons of animals immobilized in microfluidic chambers. (A) Ca2+ transients in ASEL cell bodies of wild type, egl-19, ASEL-specifically rescued egl-19, unc-2, cca-1, and a double mutant, nca-2; nca-1, in response to NaCl concentration changes for 15 s, which are shown on top. Grey bands, s.e.m. (B) Ca2+ transients in ASER cell bodies of wild-type, egl-19, and unc-2 animals in response to NaCl concentration changes for 15 s. (C) Mean ΔF/F changes in ASEL cell bodies measured in (A) during 15-s stimulation with 150 mM NaCl buffers. Horizontal lines in boxes indicate 25th, 50th, and 75th percentiles, and whiskers represent 5th and 95th percentiles. (D) Upon stimulation of ASEL cilia with 150 mM NaCl buffer for 15 s, Ca2+ transients of ASEL cilia of egl-19(n582) were monitored 3 s before the stimulation (i), 5 s after the NaCl up-step (ii), and 8 s after cessation of the stimulation (iii). Note that Ca2+ influx into the cilia, but not to the cell body, of egl-19 ASEL was detected. Ca2+ transients in the ASEL cell body of wild-type N2 are also shown as references at the left. (E) Ca2+ transients in ASEL cilia of wild type, egl-19, tax-4, and tax-4 rescued by ASEL-specific expression of tax-4 genomic DNA, in response to NaCl concentration changes for 15 s as shown on top. (F) Ca2+ transients in ASER cilia of wild-type and egl-19 animals in response to NaCl concentration changes for 15 s. (G) Mean ΔF/F changes in ASEL cilium in (E) during 15-s stimulation with 150 mM NaCl buffers. Horizontal lines in boxes indicate 25th, 50th, and 75th percentiles, and whiskers represent 5th and 95th percentiles. **p < 0.01, n.s., not significant by Steel-Dwass test.
Figure 5
Figure 5
EGL-19 produced in ASEL is required for chemotaxis. (AD) Expression patterns of egl-19. (A) mRFP production under control of the egl-19 promoter. Note mRFP produced in ASEL as indicated by arrow. (B,C) GFP production under control of the gcy-7 promoter. Note specific production of GFP in ASEL. (D) Subcellular localization of the GFP::EGL-19 fusion protein produced under control of the gcy-7 promoter. Note specific localization of the fusion in ASEL dendrite, axon and cell soma. (EG) Subcellular localization of the TAX-4 protein in ASEL. (E) TAX-4::GFP produced under control of the gcy-7 promoter. (F) mRFP under control of the gcy-7 promoter. (G) Merged image of (E,F). Note that TAX-4::GFP located in the chemosensory cilium, but not in dendrite, of ASEL. (H) Subcellular localization of membrane proteins involved in NaCl-induced signal propagation in the ASEL cilium and dendrite. (I) Trajectories of animals, wild-type N2, N2 producing GFP in ASEL and coelomocytes (‘Reference’), ‘Reference’ animals treated with GFP RNAi and ‘Reference’ animals treated with egl-19 RNAi, on chemotaxis assay plates with an NaCl linear gradient. Open circles indicate the starting position for all trajectories of individual animals during the initial 250 s. Dotted lines indicate NaCl concentrations calculated by assuming that the gradient is linear (5 mM NaCl/cm). (J) Mean horizontal positions of the four strains during the NaCl chemotaxis. (K) Effect of knock-down of EGL-19 specifically in ASEL by RNAi on chemotactic efficiency of animals toward preferred NaCl concentrations. Chemotaxis index vH/vR, which is horizontal velocity divided by velocity along the trajectory, was computed for each strain (see Materials and methods ‘Behavioral analysis’). Each data point represents the mean ± s.e.m. One-way ANOVA with Dunn’s post-hoc test was used for statistical analysis of the data. *p < 0.05. n.s., not significant.

Similar articles

Cited by

References

    1. Brette R. Philosophy of the Spike: Rate-Based vs. Spike-Based Theories of the Brain. Front. Syst. Neurosci. 2015;9:151. doi: 10.3389/fnsys.2015.00151. - DOI - PMC - PubMed
    1. Van Rullen R, Thorpe SJ. Rate coding versus temporal order coding: what the retinal ganglion cells tell the visual cortex. Neural. Comput. 2001;13:1255–1283. doi: 10.1162/08997660152002852. - DOI - PubMed
    1. Baden T, Euler T, Weckstrom M, Lagnado L. Spikes and ribbon synapses in early vision. Trends Neurosci. 2013;36:480–488. doi: 10.1016/j.tins.2013.04.006. - DOI - PubMed
    1. Rydqvist B, Lin JH, Sand P, Swerup C. Mechanotransduction and the crayfish stretch receptor. Physiol. Behav. 2007;92:21–28. doi: 10.1016/j.physbeh.2007.05.055. - DOI - PubMed
    1. Bargmann CI. Neurobiology of the Caenorhabditis elegans genome. Science. 1998;282:2028–2033. doi: 10.1126/science.282.5396.2028. - DOI - PubMed

Publication types