

Molecular imaging HDACs class IIa expression-activity and pharmacologic inhibition in intracerebral glioma models in rats using PET/CT/(MRI) with [18F]TFAHA
- PMID: 30837601
- PMCID: PMC6401080
- DOI: 10.1038/s41598-019-40054-2
Molecular imaging HDACs class IIa expression-activity and pharmacologic inhibition in intracerebral glioma models in rats using PET/CT/(MRI) with [18F]TFAHA
Abstract
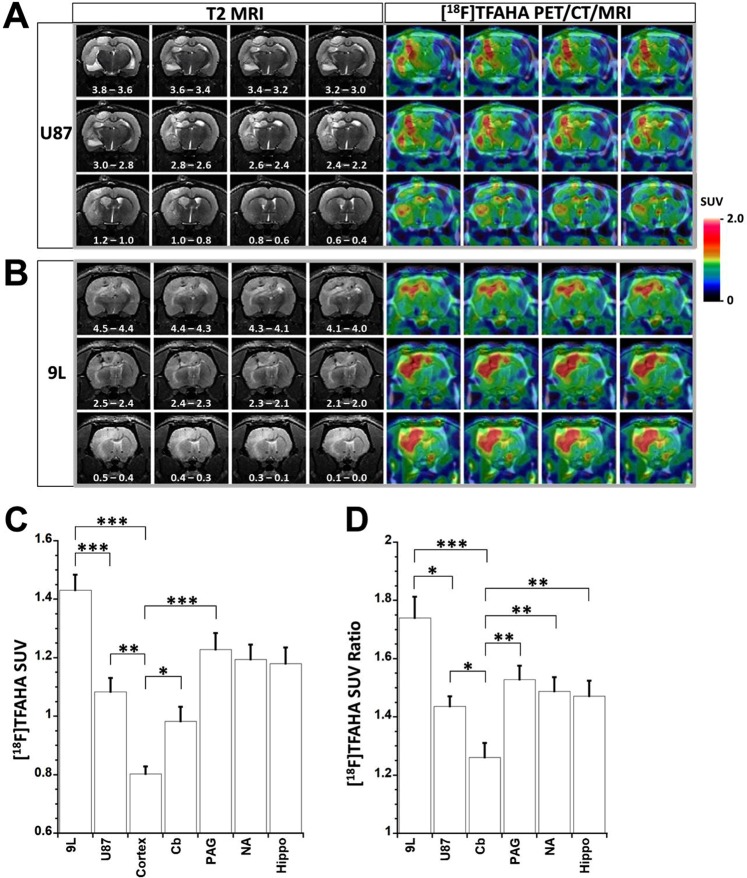
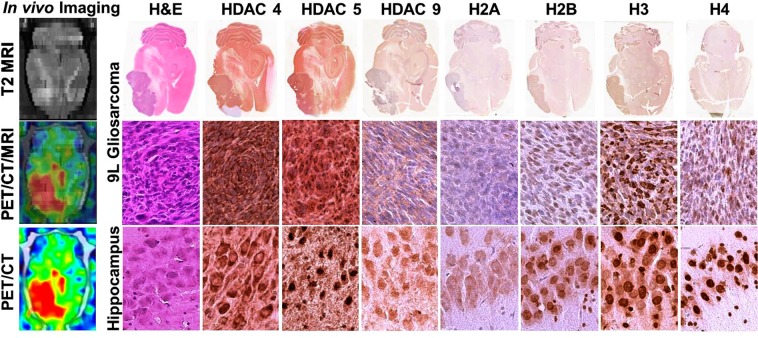
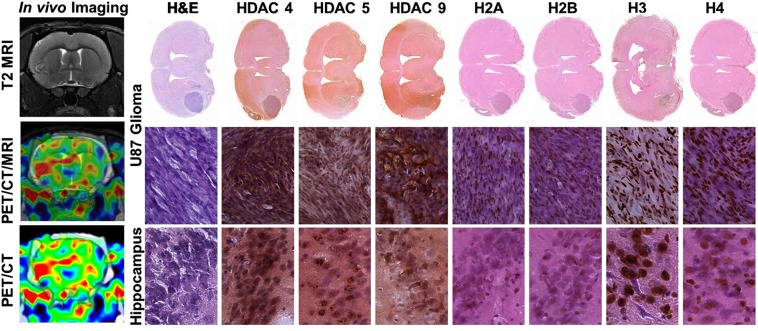
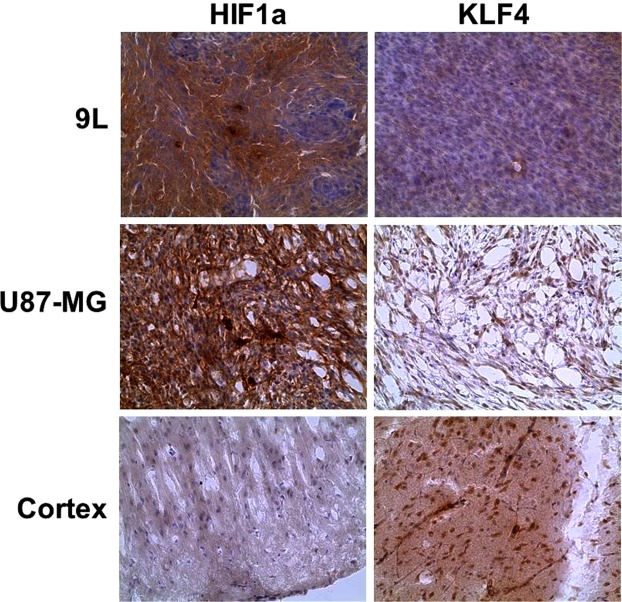
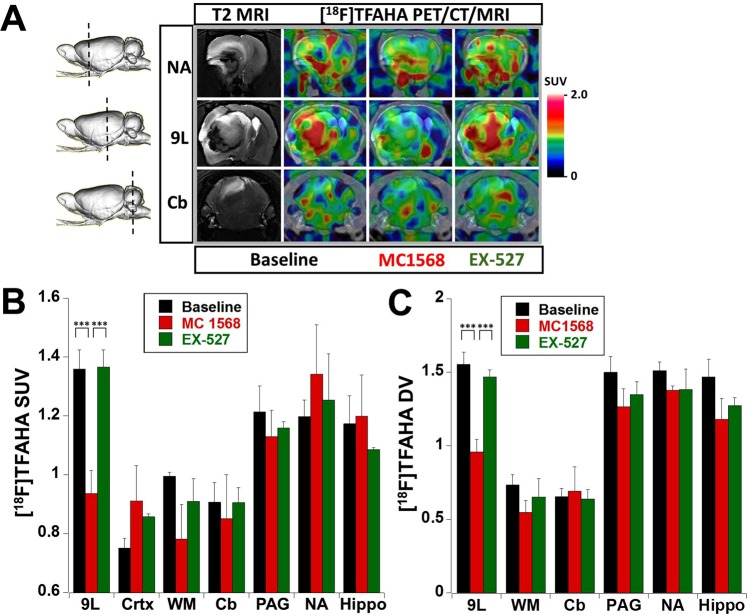
HDAC class IIa enzymes (HDAC4, 5, 7, 9) are important for glioma progression, invasion, responses to TMZ and radiotherapy, and prognosis. In this study, we demonstrated the efficacy of PET/CT/(MRI) with [18F]TFAHA for non-invasive and quantitative imaging of HDAC class IIa expression-activity in intracerebral 9L and U87-MG gliomas in rats. Increased accumulation of [18F]TFAHA in 9L and U87-MG tumors was observed at 20 min post radiotracer administration with SUV of 1.45 ± 0.05 and 1.08 ± 0.05, respectively, and tumor-to-cortex SUV ratios of 1.74 ± 0.07 and 1.44 ± 0.03, respectively. [18F]TFAHA accumulation was also observed in normal brain structures known to overexpress HDACs class IIa: hippocampus, n.accumbens, PAG, and cerebellum. These results were confirmed by immunohistochemical staining of brain tissue sections revealing the upregulation of HDACs 4, 5, and 9, and HIF-1α, hypoacetylation of H2AK5ac, H2BK5ac, H3K9ac, H4K8ac, and downregulation of KLF4. Significant reduction in [18F]TFAHA accumulation in 9L tumors was observed after administration of HDACs class IIa specific inhibitor MC1568, but not the SIRT1 specific inhibitor EX-527. Thus, PET/CT/(MRI) with [18F]TFAHA can facilitate studies to elucidate the roles of HDAC class IIa enzymes in gliomagenesis and progression and to optimize therapeutic doses of novel HDACs class IIa inhibitors in gliomas.
Conflict of interest statement
The authors declare no competing interests.
Figures
Similar articles
-
Noninvasive quantification of SIRT1 expression-activity and pharmacologic inhibition in a rat model of intracerebral glioma using 2-[18F]BzAHA PET/CT/MRI.Neurooncol Adv. 2020 Jan-Dec;2(1):vdaa006. doi: 10.1093/noajnl/vdaa006. Epub 2020 Jan 16. Neurooncol Adv. 2020. PMID: 32118205 Free PMC article.
-
Novel Histone Deacetylase Class IIa Selective Substrate Radiotracers for PET Imaging of Epigenetic Regulation in the Brain.PLoS One. 2015 Aug 5;10(8):e0133512. doi: 10.1371/journal.pone.0133512. eCollection 2015. PLoS One. 2015. PMID: 26244761 Free PMC article.
-
Evaluation of Class IIa Histone Deacetylases Expression and In Vivo Epigenetic Imaging in a Transgenic Mouse Model of Alzheimer's Disease.Int J Mol Sci. 2021 Aug 11;22(16):8633. doi: 10.3390/ijms22168633. Int J Mol Sci. 2021. PMID: 34445342 Free PMC article.
-
Roles and targets of class I and IIa histone deacetylases in cardiac hypertrophy.J Biomed Biotechnol. 2011;2011:928326. doi: 10.1155/2011/928326. Epub 2010 Nov 29. J Biomed Biotechnol. 2011. PMID: 21151616 Free PMC article. Review.
-
Targeting Class IIa HDACs: Insights from Phenotypes and Inhibitors.Curr Med Chem. 2021;28(42):8628-8672. doi: 10.2174/0929867328666210629160647. Curr Med Chem. 2021. PMID: 34212828 Review.
Cited by
-
Radiomics characterization of tissues in an animal brain tumor model imaged using dynamic contrast enhanced (DCE) MRI.Sci Rep. 2023 Jul 2;13(1):10693. doi: 10.1038/s41598-023-37723-8. Sci Rep. 2023. PMID: 37394559 Free PMC article.
-
Mechanism and application of feedback loops formed by mechanotransduction and histone modifications.Genes Dis. 2023 Aug 2;11(5):101061. doi: 10.1016/j.gendis.2023.06.030. eCollection 2024 Sep. Genes Dis. 2023. PMID: 39071110 Free PMC article. Review.
-
Opportunities for histone deacetylase inhibition in amyotrophic lateral sclerosis.Br J Pharmacol. 2021 Mar;178(6):1353-1372. doi: 10.1111/bph.15217. Epub 2020 Aug 26. Br J Pharmacol. 2021. PMID: 32726472 Free PMC article. Review.
-
HDAC Inhibitors: Innovative Strategies for Their Design and Applications.Molecules. 2022 Jan 21;27(3):715. doi: 10.3390/molecules27030715. Molecules. 2022. PMID: 35163980 Free PMC article. Review.
-
Introducing HDAC-Targeting Radiopharmaceuticals for Glioblastoma Imaging and Therapy.Pharmaceuticals (Basel). 2023 Feb 1;16(2):227. doi: 10.3390/ph16020227. Pharmaceuticals (Basel). 2023. PMID: 37259375 Free PMC article. Review.
References
Publication types
MeSH terms
Substances
Grants and funding
LinkOut - more resources
Full Text Sources
Medical
Molecular Biology Databases
