

Examination of the temporal and spatial dynamics of the gut microbiome in newborn piglets reveals distinct microbial communities in six intestinal segments
- PMID: 30837612
- PMCID: PMC6400902
- DOI: 10.1038/s41598-019-40235-z
Examination of the temporal and spatial dynamics of the gut microbiome in newborn piglets reveals distinct microbial communities in six intestinal segments
Abstract
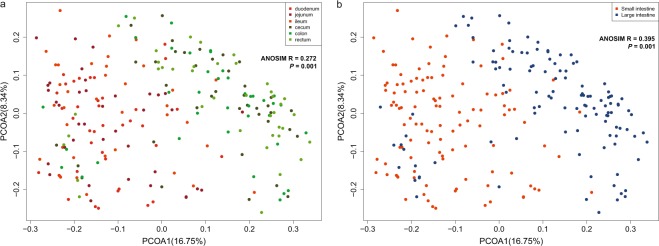
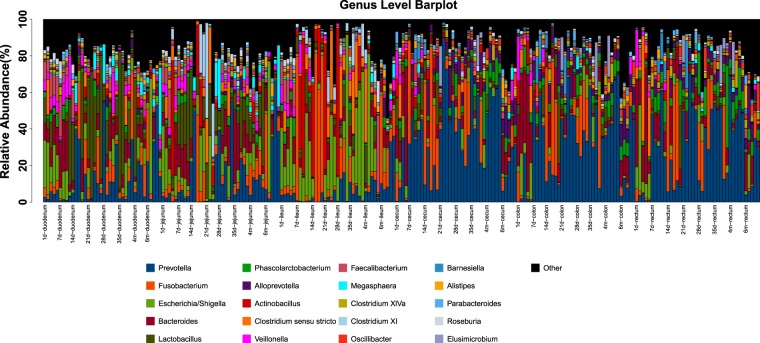
Intestinal microbiota plays a crucial role in immune development and disease progression in mammals from birth onwards. The gastrointestinal tract of newborn mammals is rapidly colonized by microbes with tremendous biomass and diversity. Understanding how this complex of segmental communities evolves in different gastrointestinal sites over time has great biological significance and medical implications. However, most previous reports examining intestinal microbiota have focused on fecal samples, a strategy that overlooks the spatial microbial dynamics in different intestinal segments. Using intestinal digesta from six intestinal segments (duodenum, jejunum, ileum, cecum, colon and rectum) of newborn piglets, we herein conducted a large-scale 16S rRNA gene sequencing-based study to characterize the segmental dynamics of porcine gut microbiota at eight postnatal intervals (days 1, 7, 14, 21, 28, 35, 120 and 180). A total of 4,465 OTUs were obtained and showed that the six intestinal segments could be divided into three parts; in the duodenum-jejunum section, the most abundant genera included Lactobacillus and Bacteroides; in the ileum, Fusobacterium and Escherichia; and in the cecum-rectum section, Prevotella. Although the microbial communities of the piglets were similar among the six intestinal segments on postnatal day 1, they evolved and quickly differentiated at later intervals. An examination of time-dependent alterations in the dominant microbes revealed that the microbiome in the large intestine was very different from and much more stable than that in the small intestine. The gut microbiota in newborn piglets exhibited apparent temporal and spatial variations in different intestinal segments. The database of gut microbes in piglets could be a referable resource for future studies on mammalian gut microbiome development in early host growth phases.
Conflict of interest statement
The authors declare no competing interests.
Figures

Similar articles
-
Genetic hypogonadal mouse model reveals niche-specific influence of reproductive axis and sex on intestinal microbial communities.Biol Sex Differ. 2023 Nov 6;14(1):79. doi: 10.1186/s13293-023-00564-1. Biol Sex Differ. 2023. PMID: 37932822 Free PMC article.
-
Longitudinal development of the gut microbiota in healthy and diarrheic piglets induced by age-related dietary changes.Microbiologyopen. 2019 Dec;8(12):e923. doi: 10.1002/mbo3.923. Epub 2019 Sep 9. Microbiologyopen. 2019. PMID: 31496126 Free PMC article.
-
Gut microbiota of newborn piglets with intrauterine growth restriction have lower diversity and different taxonomic abundances.J Appl Microbiol. 2019 Aug;127(2):354-369. doi: 10.1111/jam.14304. Epub 2019 Jun 7. J Appl Microbiol. 2019. PMID: 31077497 Free PMC article.
-
Strain-level epidemiology of microbial communities and the human microbiome.Genome Med. 2020 Aug 13;12(1):71. doi: 10.1186/s13073-020-00765-y. Genome Med. 2020. PMID: 32791981 Free PMC article. Review.
-
Creating an atlas to visualize the biodiversity of the mammalian gut microbiota.Curr Opin Biotechnol. 2022 Feb;73:28-33. doi: 10.1016/j.copbio.2021.06.028. Epub 2021 Jul 16. Curr Opin Biotechnol. 2022. PMID: 34280701 Review.
Cited by
-
The case for microbial intervention at weaning.Gut Microbes. 2024 Jan-Dec;16(1):2414798. doi: 10.1080/19490976.2024.2414798. Epub 2024 Oct 28. Gut Microbes. 2024. PMID: 39468827 Free PMC article. Review.
-
The Resemblance between Bacterial Gut Colonization in Pigs and Humans.Microorganisms. 2022 Sep 14;10(9):1831. doi: 10.3390/microorganisms10091831. Microorganisms. 2022. PMID: 36144433 Free PMC article. Review.
-
Gastrointestinal microbiota and metabolites responses to dietary cereal grains in an adult pig model.Front Microbiol. 2024 Sep 17;15:1442077. doi: 10.3389/fmicb.2024.1442077. eCollection 2024. Front Microbiol. 2024. PMID: 39355428 Free PMC article.
-
Xylan alleviates dietary fiber deprivation-induced dysbiosis by selectively promoting Bifidobacterium pseudocatenulatum in pigs.Microbiome. 2021 Nov 21;9(1):227. doi: 10.1186/s40168-021-01175-x. Microbiome. 2021. PMID: 34802456 Free PMC article.
-
Weaning transition, but not the administration of probiotic candidate Kazachstania slooffiae, shaped the gastrointestinal bacterial and fungal communities in nursery piglets.Front Vet Sci. 2024 Jan 11;10:1303984. doi: 10.3389/fvets.2023.1303984. eCollection 2023. Front Vet Sci. 2024. PMID: 38274656 Free PMC article.
References
Publication types
MeSH terms
Substances
LinkOut - more resources
Full Text Sources
Molecular Biology Databases
