. 2019 Mar 5;9(1):3606.
doi: 10.1038/s41598-019-40342-x.

TMEM10 Promotes Oligodendrocyte Differentiation and is Expressed by Oligodendrocytes in Human Remyelinating Multiple Sclerosis Plaques

Affiliations

TMEM10 Promotes Oligodendrocyte Differentiation and is Expressed by Oligodendrocytes in Human Remyelinating Multiple Sclerosis Plaques

Omar de Faria Jr et al. Sci Rep. .

Abstract

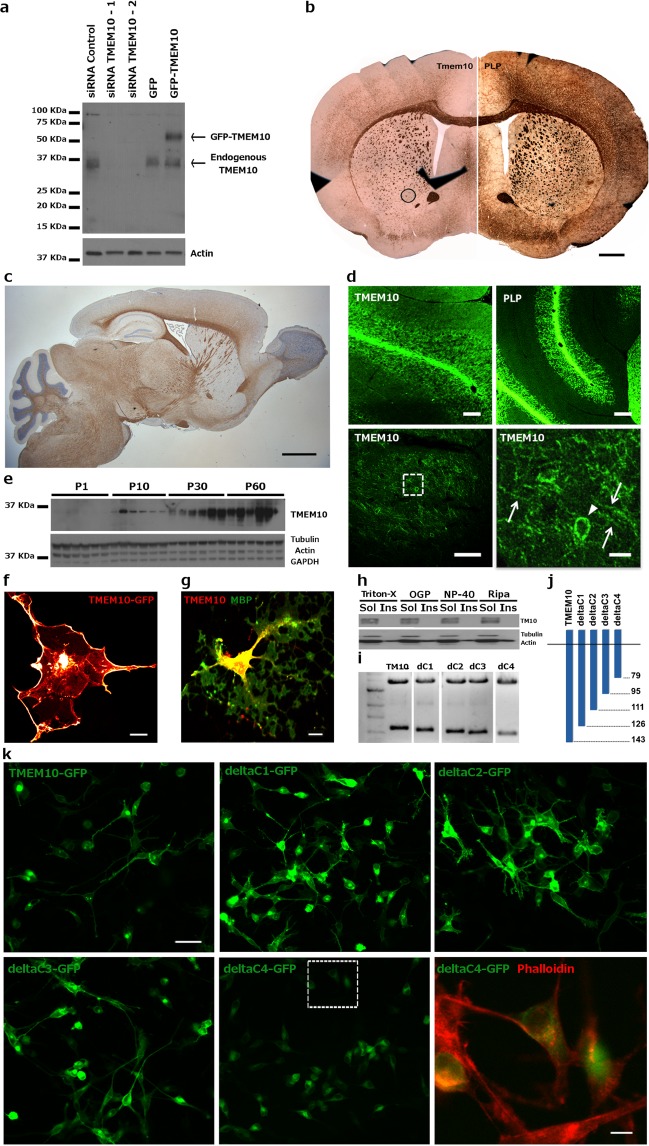
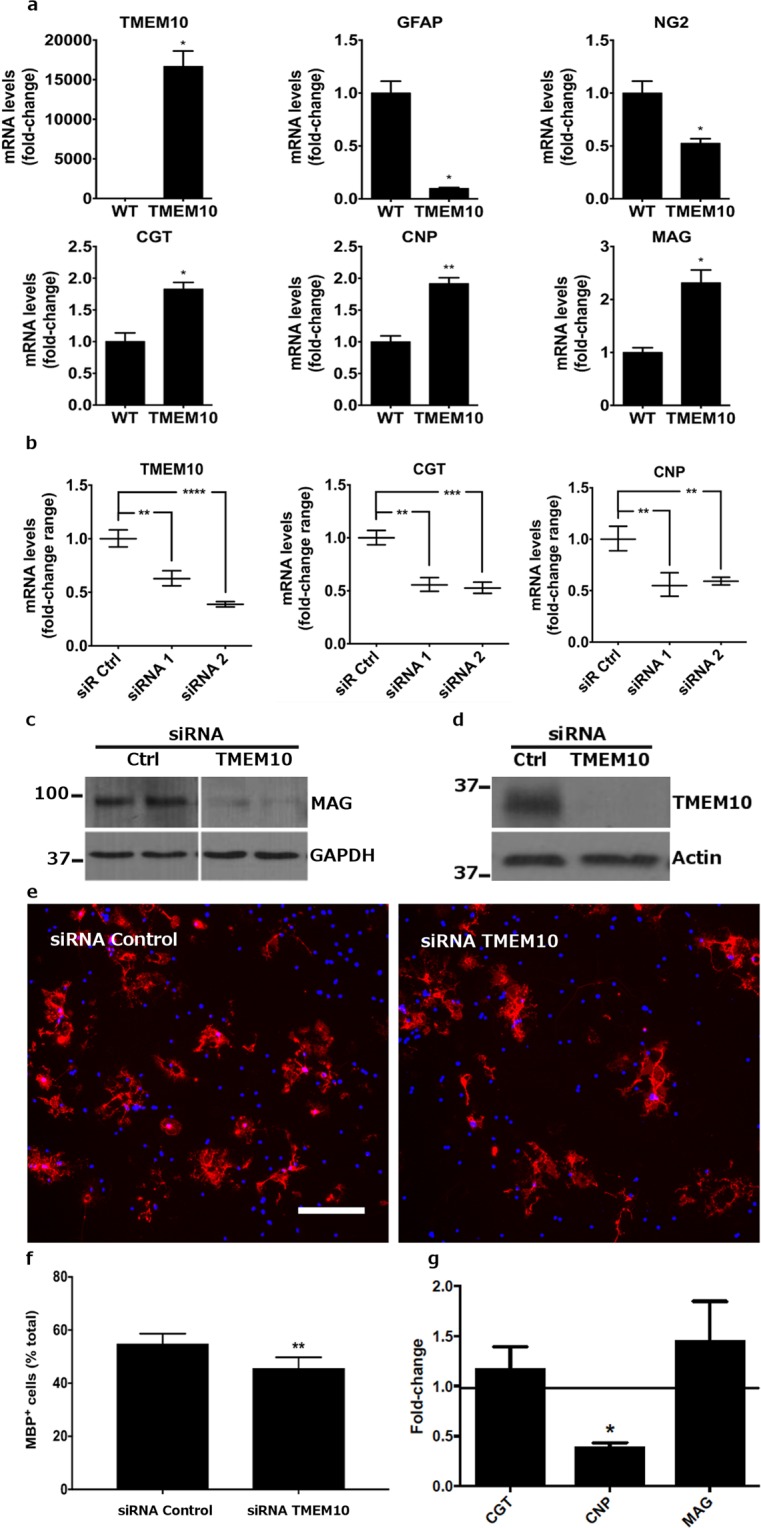
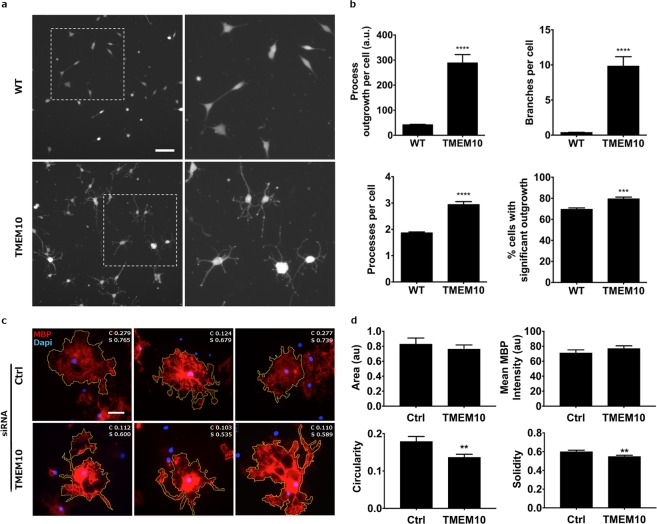
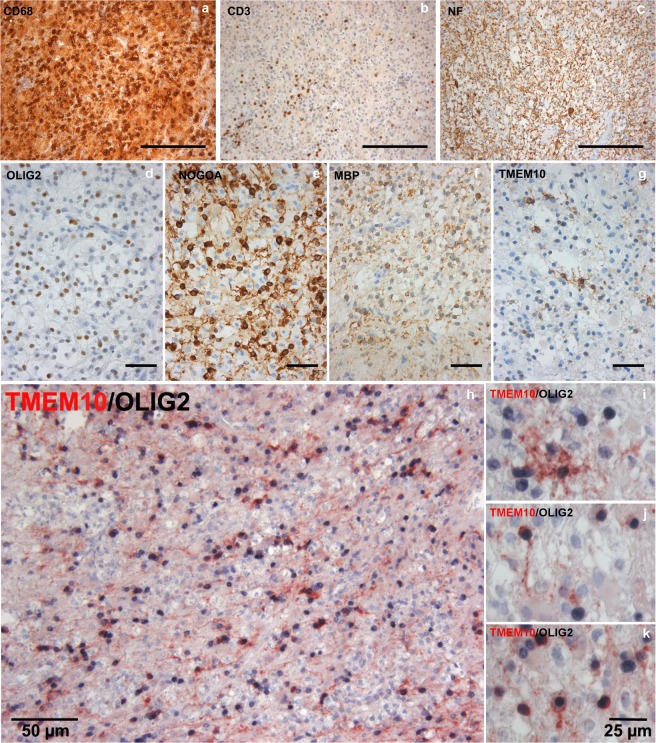
Oligodendrocyte precursor cells (OPCs) differentiate during postnatal development into myelin-forming oligodendrocytes, in a process distinguished by substantial changes in morphology and the onset of myelin gene expression. A mammalian-specific CNS myelin gene, tmem10, also called Opalin, encodes a type 1 transmembrane protein that is highly upregulated during early stages of OPC differentiation; however, a function for TMEM10 has not yet been identified. Here, consistent with previous studies, we detect TMEM10 protein in mouse brain beginning at ~P10 and show that protein levels continue to increase as oligodendrocytes differentiate and myelinate axons in vivo. We show that constitutive TMEM10 overexpression in the Oli-neu oligodendroglial cell line promotes the expression of the myelin-associated genes MAG, CNP and CGT, whereas TMEM10 knock down in primary OPCs reduces CNP mRNA expression and decreases the percentage of MBP-positive oligodendrocytes that differentiate in vitro. Ectopic TMEM10 expression evokes an increase in process extension and branching, and blocking endogenous TMEM10 expression results in oligodendrocytes with abnormal cell morphology. These findings may have implications for human demyelinating disorders, as oligodendrocytes expressing TMEM10 are detected in human remyelinating multiple sclerosis lesions. Together, our findings provide evidence that TMEM10 promotes oligodendrocyte terminal differentiation and may represent a novel target to promote remyelination in demyelinating disorders.


Conflict of interest statement

The authors declare no competing interests.

Figures

Figure 1
Figure 1
TMEM10 expression profile – (a) Validation of TMEM10 antibody. One major band corresponding to endogenous TMEM10 was detected at ~36 KDa. An ~60 KDa band was detected in OPCs transfected with a GFP-TMEM10 expression construct. (b) Immunohistochemistry for TMEM10 and PLP on coronal and (c) for TMEM10 on sagittal sections of adult mouse brain. Scale bars correspond to 0.8 mm and 1.5 mm, respectively. (d) Immunohistochemistry for TMEM10 and PLP on horizontal sections of P35 mouse brain. The area demarcated in the bottom left image is enlarged on the right. Arrowheads indicate the distribution of TMEM10 protein in a cell body, while arrows indicate protein present in cell processes. Scale bars: 350 µm, 300 µm, 90 µm and 20 µm. (e) Western blot analysis of a developmental time course of expression in mouse hippocampus. TMEM10 protein was first detected at P10. (f) Oli-neu cells were transfected with an expression construct encoding GFP-TMEM10 and F-actin labelled with phalloidin (red). GFP signal was detected on the plasma membrane and accumulated along leading edges of extending processes. (g) Primary OPCs were cultured for 3 days and stained for TMEM10 and MBP. TMEM10 protein was distributed along the cell body, primary processes and tips of processes, but not associated with MBP positive membranes. Scale bar: 10 µm. (h) Western blot analysis of TMEM10 in soluble and insoluble fractions following extraction of Oli-neu cells with different detergents. Actin was probed as a control for detergent-soluble and insoluble fractions. (i) Agarose gel electrophoresis showing C-terminal truncated TMEM10 fragments used to transfect Oli-neu cells. The uncut gel is shown in Supplemental Fig. 2(j) Schematic representation of truncated TMEM10 fragments. Numbers on the right indicate the position of the last amino acid encoded by the truncated TMEM10 fragment relative to the full-length protein. (k) Oli-neu cells were transfected with GFP-TMEM10 or different C-terminally truncated GFP-TMEM10 fragments. The area demarcated in the bottom middle image is enlarged in the lower right panel. GFP-deltaC4TMEM10 was not detected in cellular processes, but instead accumulates in the cytoplasm. Scale bars: 35 µm and 8 µm.
Figure 2
Figure 2
TMEM10 promotes myelin gene expression – (a) qPCR analysis of lysates derived from WT and TMEM10 Oli-neu cells. Graphs show mean ± SEM. *p < 0.05; **p < 0.01 (Student’s t-test). (b) Oli-neu cells were transfected with control or TMEM10 siRNA and induced to differentiate. qPCR analysis shows reduced levels of CNP and CGT transcripts following TMEM10 knock down. Two experiments, performed in duplicate and analyzed by semi-quantitative RT-PCR, were confirmed in a third independent experiment analyzed by qPCR (shown here). Graphs show mean ± SEM. *p < 0.05 (Student’s t-test). (c) Oli-neu cells were transfected as in (b) and protein in whole cell lysates examined by western bot analysis for MAG expression. The blot is representative of 2 independent experiments. (d) Primary OPCs were electroporated with control and TMEM10 siRNA and cultured for 5 days in differentiating medium. Western blot analysis of protein lysates show TMEM10 knock down. (e,f) The percentage of MBP positive cells relative to the total number of DAPI-positive nuclei was scored. Scale bar: 35 µm. Twelve independent experiments, performed in triplicate, were analyzed. Graph shows mean ± SEM. ** p < 0.01 (paired Student’s t-test). (g) mRNA levels for myelin associated genes following TMEM10 knock down in OPCs were analysed by qPCR. Graph shows fold-change expression. *p < 0.05 (paired Student’s t-test, 2–3 independent experiments).
Figure 3
Figure 3
TMEM10 influences membrane extension and oligodendrocyte cell morphology – (a) WT and TMEM10 Oli-neu cells were cultured for 2 days and stained with Cell Tracker, a membrane labeling fluorescent dye. Regions demarcated on the left are enlarged in the right hand panels. Scale bar: 60 µm. (b) Process length, number of branches, number of processes and percentage of cells with significant outgrowth were measured. Graphs show mean ± SEM. Ninety fields from two independent experiments performed in triplicates were analyzed. ***p < 0.001; ****p < 0.0001 (Student’s t-test). (c) Primary OPCs were transfected with control and TMEM10 siRNAs, cultured for 5 days in differentiating medium, fixed and stained for MBP. 100–150 cells from six independent experiments were randomly selected and individually outlined using the free selection tool of ImageJ software. Representative images are shown. Measurements of cell circularity (c) and solidity (s) are shown on the top right corner of each image. Scale bar: 3.5 µm. (d) Quantification of total membrane area, mean MBP fluorescence, cell circularity and solidity. Graphs show mean ± SEM. **p < 0.01 (Student’s t-test).
Figure 4
Figure 4
TMEM10 is expressed by oligodendrocytes in remyelinating MS plaques –(af) Brain tissue samples containing an inflammatory demyelinating lesion consistent with MS were stained for CD68 and CD3 (markers of infiltrating immune cells), Neurofilament (axons), Olig2 (oligodendrocyte lineage cells), and TMEM10. NOGOA and MBP expression indicate ongoing remyelination in these plaques. (g) A subset of cells with oligodendroglial morphology expresses TMEM10. (h–k) Double staining for TMEM10 and Olig2 confirms that TMEM10 expressing cells are oligodendrocytes. Scale bars correspond to 200 µm in (a,b), 100 µm in (c), 50 µm in (d) through (h) and 25 µm.

References

    1. Simons M, Nave KA. Oligodendrocytes: Myelination and Axonal Support. Cold Spring Harb Perspect Biol. 2015;8:a020479. doi: 10.1101/cshperspect.a020479. - DOI - PMC - PubMed
    1. Emery B. Regulation of oligodendrocyte differentiation and myelination. Science. 2010;330:779–782. doi: 10.1126/science.1190927. - DOI - PubMed
    1. Fulton D, Paez PM, Campagnoni AT. The multiple roles of myelin protein genes during the development of the oligodendrocyte. ASN Neuro. 2010;2:e00027. doi: 10.1042/AN20090051. - DOI - PMC - PubMed
    1. Han H, Myllykoski M, Ruskamo S, Wang C, Kursula P. Myelin-specific proteins: a structurally diverse group of membrane-interacting molecules. Biofactors. 2013;39:233–241. doi: 10.1002/biof.1076. - DOI - PubMed
    1. Mitew S, et al. Mechanisms regulating the development of oligodendrocytes and central nervous system myelin. Neuroscience. 2014;276:29–47. doi: 10.1016/j.neuroscience.2013.11.029. - DOI - PubMed

Publication types

LinkOut - more resources