. 2019 Mar 5;9(1):3608.
doi: 10.1038/s41598-019-40441-9.

Geometric-Phase Microscopy for Quantitative Phase Imaging of Isotropic, Birefringent and Space-Variant Polarization Samples

Affiliations

Geometric-Phase Microscopy for Quantitative Phase Imaging of Isotropic, Birefringent and Space-Variant Polarization Samples

Petr Bouchal et al. Sci Rep. .

Abstract

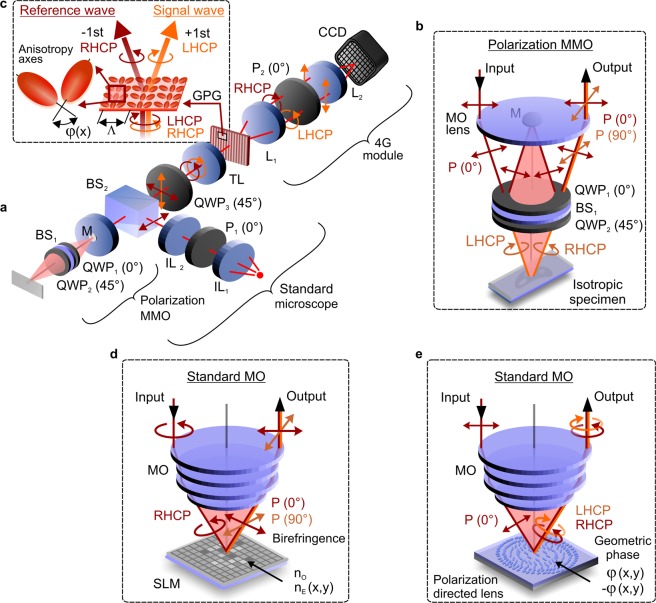
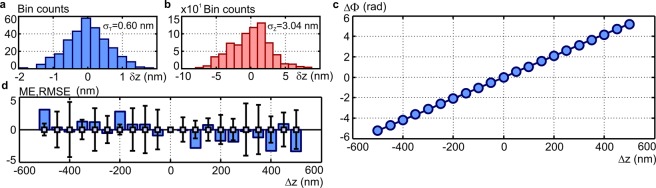
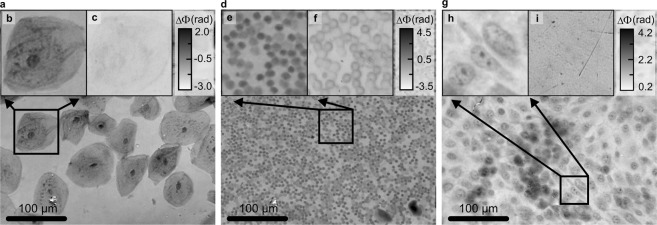
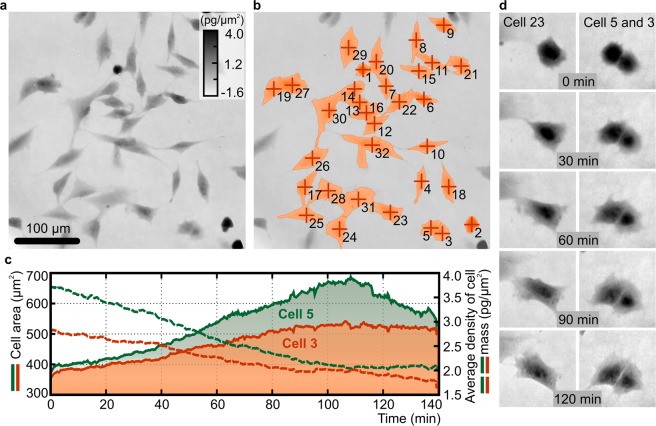
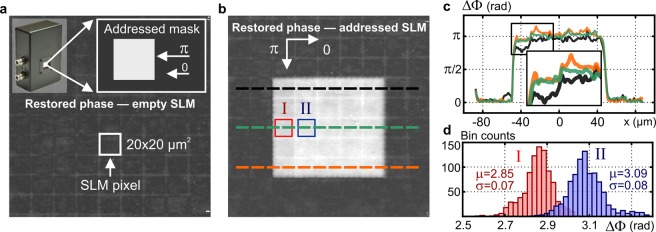
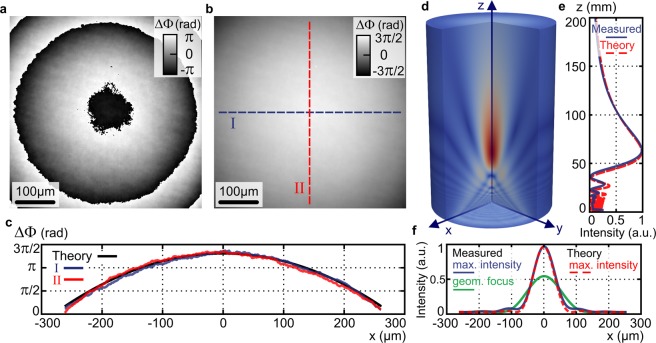
We present geometric-phase microscopy allowing a multipurpose quantitative phase imaging in which the ground-truth phase is restored by quantifying the phase retardance. The method uses broadband spatially incoherent light that is polarization sensitively controlled through the geometric (Pancharatnam-Berry) phase. The assessed retardance possibly originates either in dynamic or geometric phase and measurements are customized for quantitative mapping of isotropic and birefringent samples or multi-functional geometric-phase elements. The phase restoration is based on the self-interference of polarization distinguished waves carrying sample information and providing pure reference phase, while passing through an inherently stable common-path setup. The experimental configuration allows an instantaneous (single-shot) phase restoration with guaranteed subnanometer precision and excellent ground-truth accuracy (well below 5 nm). The optical performance is demonstrated in advanced yet routinely feasible noninvasive biophotonic imaging executed in the automated manner and predestined for supervised machine learning. The experiments demonstrate measurement of cell dry mass density, cell classification based on the morphological parameters and visualization of dynamic dry mass changes. The multipurpose use of the method was demonstrated by restoring variations in the dynamic phase originating from the electrically induced birefringence of liquid crystals and by mapping the geometric phase of a space-variant polarization directed lens.


Conflict of interest statement

P. B., R. Ch., and Z. B. report a Czech patent, number 307520, and pending PCT application for the Quantitative 4G optics microscope, filed by Brno University of Technology and Palacký University Olomouc.

Figures

Figure 1
Figure 1
Illustration of Q4GOM in experiments for quantification of the phase retardance of biological and polarization sensitive samples. (a) Experimental setup using 4G optics module connected to microscope with a polarization adapted interference objective: P1–input polarizer, IL1, IL2–illumination lenses, MMO–Mirau microscope objective, BS1–pellicle beam splitter, QWP1, QWP2, QWP3–quarter-wave plates, M–reference mirror, BS2–beam splitter cube, TL–tube lens, GPG–geometric-phase grating, L1–first Fourier lens, P2–analyzer, L2–second Fourier lens and CCD–charged coupled device. (b) Polarization adapted Mirau microscope objective (MMO) used for imaging of isotropic samples. (c) Polarization sensitive transformation of light by geometric-phase grating. (d) Polarization coded waves in restoration of the birefringent retardance of the dynamic phase introduced by liquid crystals. (e) Polarization coded waves in the quantitative mapping of the geometric phase modulated by multi-functional polarization directed elements.
Figure 2
Figure 2
Evaluation of spatio-temporal precision and ground-truth accuracy of phase restoration in Q4GOM. (a) Histogram demonstrating the temporal stability of the phase imaging (histogram created from 300 reconstructions carried out for a fixed spatial position during 25-minute-long period, reconstructed phase transferred to height variation δz). (b) Histogram demonstrating the spatial background noise of the phase imaging evaluated in the area of 20 × 20 µm2 (c) Theoretical dependence of the reconstructed phase ΔΦ on the ground-truth displacement Δz of the piezoelectric transducer (solid line) and the experimentally determined phase ΔΦ measured for individual positions Δz (circle signs). (d) Accuracy of the restored phase evaluated by the mean error (ME-bars) and the root mean square error (RMSE-error bars) (results were obtained from five independent measurements at each position Δz).
Figure 3
Figure 3
Demonstration of Q4GOM in the QPI experiments using various cell types. (a) The QPI of human cheek cells. (b,c) Comparison of the QPI and bright field image of the area marked in (a). (d) The QPI of human blood smear. (e,f) Comparison of the QPI and bright field image of the area marked in (d). (g) The QPI of 100% confluent LW3K12 cells. (h,i) Comparison of the QPI and bright field image of the area marked in (g).
Figure 4
Figure 4
Time-lapse imaging of live LW3K12 cells and monitoring of area and average density of cell dry mass. (a) Representative image chosen from 140-minute-long experiment. (b) Illustration of cell segmentation used for post-processing of measured data. (c) Quantitative evaluation of cell area and average density of cell dry mass for cell 3 (red color) and 5 (green color). Solid and dashed lines represent areas occupied by cells and average density of cell dry mass, respectively. The measurement was performed with time step 20 seconds. Images are shown in units of pg/µm2 recalculated from phase in radians according to Davies. (d) Representative images of selected cells during the measured period.
Figure 5
Figure 5
Q4GOM in quantitative retardance imaging of birefringent liquid crystal cells of a SLM. (a) Illustration of a square phase mask (top) and the phase image of non-addressed SLM. (b) The quantitative phase image of the square phase mask displayed on the SLM (phase stroke π, size 5 × 5 pixels). (c) Phase profiles taken along the dashed line cross sections in (b). (d) The histograms for pixels I and II in (b).
Figure 6
Figure 6
Q4GOM in quantitative restoration of the geometric phase of a polarization directed flat lens. (a) Restored raw geometric phase mapping phase variations at the plane of the polarization directed flat lens. (b) Unwrapped phase from (a). (c) Phase profiles along the cross sections I (blue) and II (red) compared with theoretical phase profile (black) created for the focal length f = 100 mm. (d) 3D amplitude distribution of the focused field calculated from the reconstructed geometric phase. (e) Experimental axial intensity obtained from 3D amplitude distribution in (d) (blue) and theoretical intensity profile for diffraction limited lens (red). (f) Experimental (blue) and theoretical (red) transverse intensity profiles at the plane of maximum axial intensity and experimental transverse intensity profile at the paraxial focal plane (green).

References

    1. Cuche E, Bevilacqua F, Depeursinge C. Digital holography for quantitative phase-contrast imaging. Opt. Lett. 1999;24:291. doi: 10.1364/OL.24.000291. - DOI - PubMed
    1. Marquet P, et al. Digital holographic microscopy: a noninvasive contrast imaging technique allowing quantitative visualization of living cells with subwavelength axial accuracy. Opt. Lett. 2005;30:468. doi: 10.1364/OL.30.000468. - DOI - PubMed
    1. de Groot P. Principles of interference microscopy for the measurement of surface topography. Adv. Opt. Photonics. 2015;7:1. doi: 10.1364/AOP.7.000001. - DOI
    1. Kim J, et al. Fabrication of ideal geometric-phase holograms with arbitrary wavefronts. Optica. 2015;2:958. doi: 10.1364/OPTICA.2.000958. - DOI
    1. Escuti MJ, Kim J, Kudenov MW. Geometric-Phase Holograms. Opt. Photonics News. 2016;27:22–29. doi: 10.1364/OPN.27.2.000022. - DOI

Publication types