. 2019 Feb 19:11:19.
doi: 10.3389/fnagi.2019.00019. eCollection 2019.

Regional Cerebral Perfusion and Cerebrovascular Reactivity in Elderly Controls With Subtle Cognitive Deficits

Affiliations

Regional Cerebral Perfusion and Cerebrovascular Reactivity in Elderly Controls With Subtle Cognitive Deficits

Merel van der Thiel et al. Front Aging Neurosci. .

Abstract

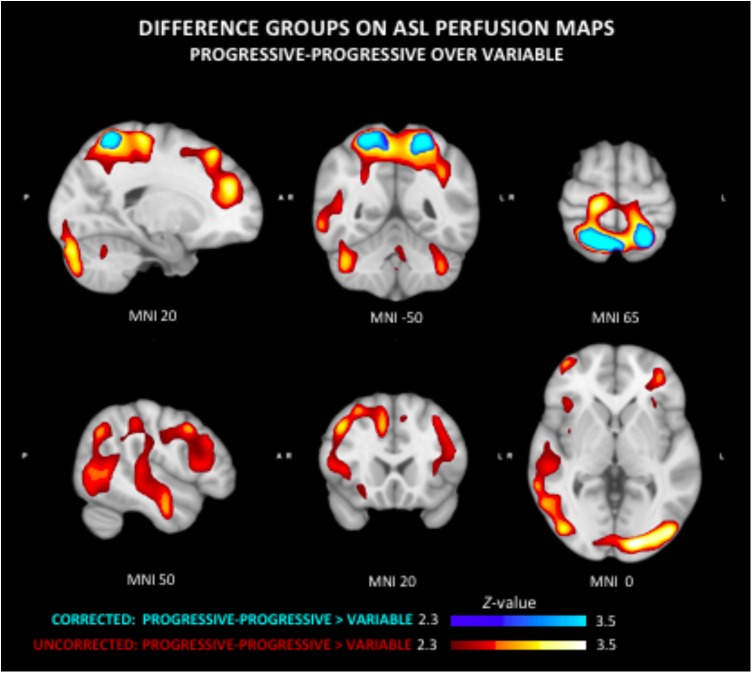
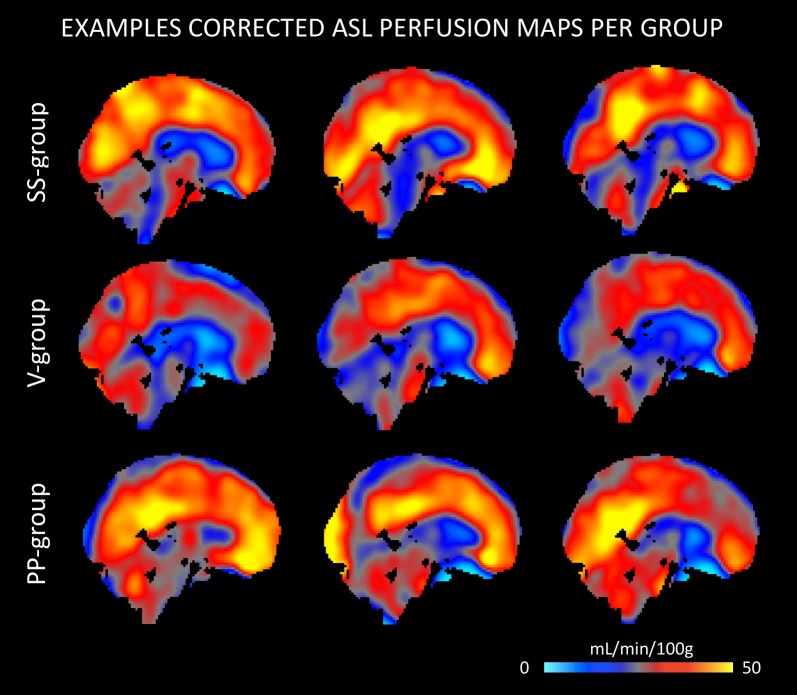
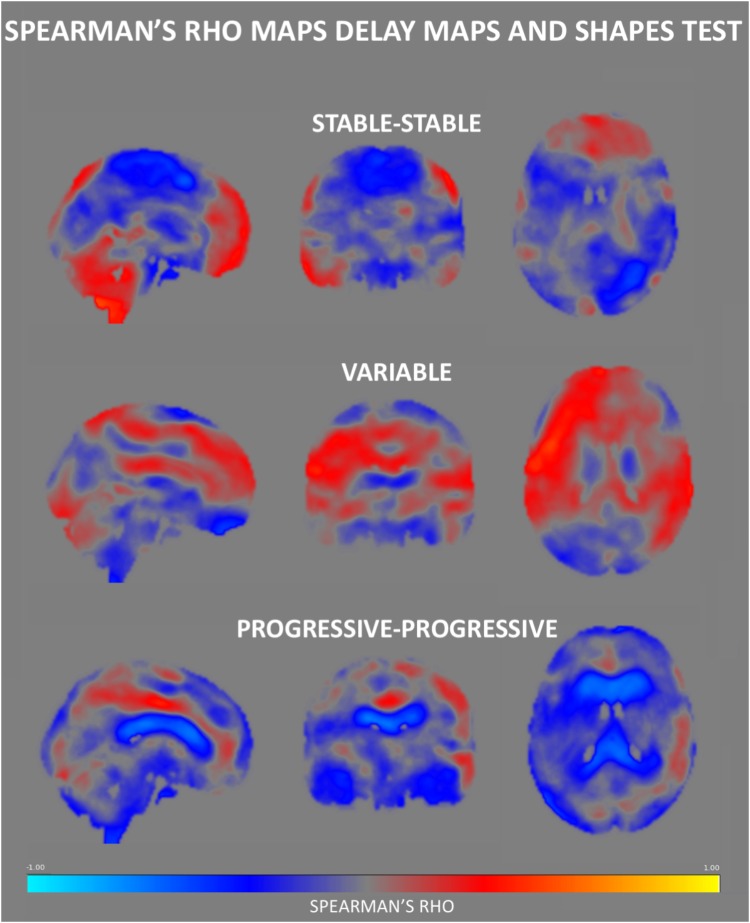
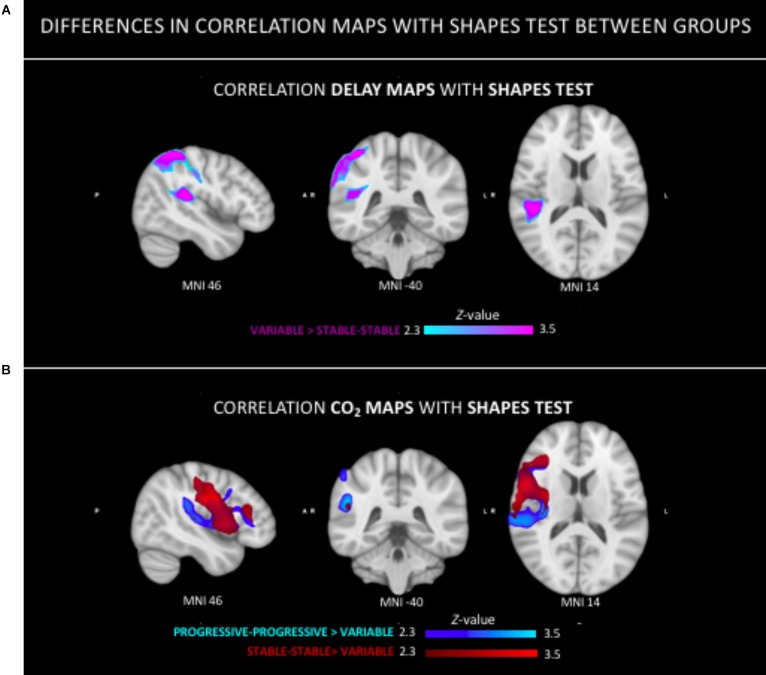
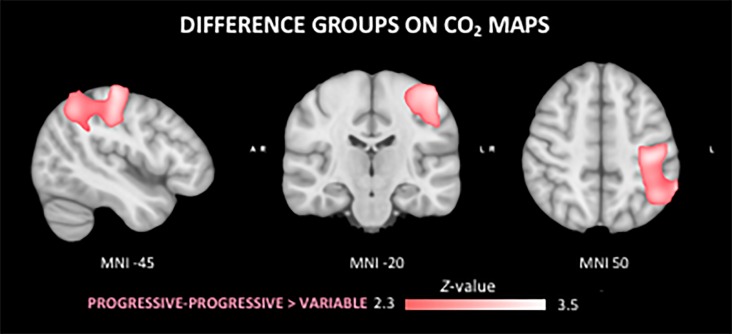
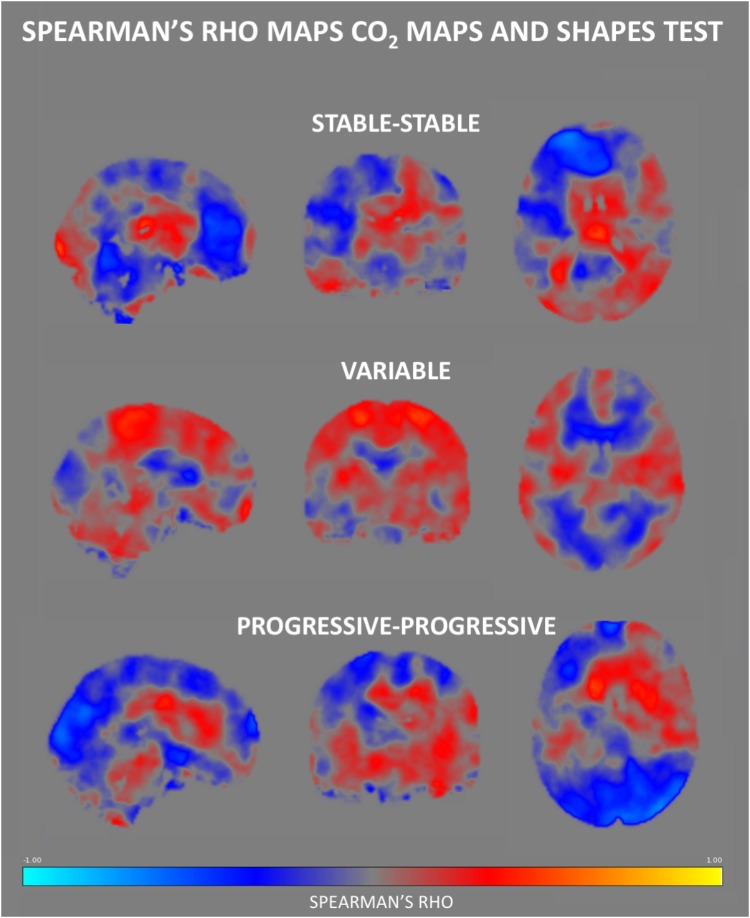
Background: Recent studies suggested that arterial spin labeling (ASL)-based measures of cerebral blood flow (CBF) as well as cerebral vasoreactivity to CO2 (CVR CO2) show significant alterations mainly in posterior neocortical areas both in mild cognitive impairment (MCI) and Alzheimer disease. It remains, however, unknown whether similar changes occur in at risk healthy elders without clinically overt symptoms. This longitudinal study investigated patterns of ASL perfusion and CVR CO2 as a function of the cognitive trajectories in asymptomatic elderly individuals. Methods: Seventy-nine community-dwelling subjects (mean age: 78.7 years, 34 male) underwent three neuropsychological assessments during a subsequent 3-year period. Individuals were classified as stable-stable (SS), variable (V), or progressive-progressive (PP). Between-group comparisons were conducted for ASL CBF and transit-time delay maps and β-maps of CO2 response. Spearman's rho maps assessed the correlation between ASL (respectively, CVR CO2 measures) and Shapes test for working memory, as well as Verbal fluency test for executive functions. Three group-with-continuous-covariate-interaction designs were implemented to investigate group-based differences on the association between neuropsychological scores and ASL or CO2 measures. Results: Comparison of CBF maps demonstrates significantly lower perfusion in the V-group as to PP-cases predominantly in parietal regions, including the precuneus and, to a lesser degree, in temporal and frontal cortex. A stronger CVR CO2 response was found in the PP-group in left parietal areas compared to the V-group. V-cases showed a stronger ASL-Shape value relationship than V-group in right temporoparietal junction and superior parietal lobule. CO2-Shape value correlation was significantly higher in both SS and PP-groups compared to the V-group in right insular and superior perisylvian regions. Conclusion: Our data indicate the presence of decreased ASL and CVR CO2 values mainly in parietal and fronto-temporal areas in cases with the first signs of cognitive instability (V-group). Importantly, the PP-group, at high risk for MCI transition, displays an increase of both parameters in the same areas. Clinicoradiologic correlations also indicate a clear distinction between the V-group and both PP and SS-cases. These data imply the presence of an inverted U-shape pattern of regional blood flow and CVR in old age that might predict subsequent cognitive fate.

Keywords: CO2; arterial spin labeling; asymptomatic controls; brain perfusion; cerebrovascular reactivity; clinicoradiologic correlations.


Figures

FIGURE 1
FIGURE 1
Group differences in arterial spin labeling (ASL) perfusion measures. The progressive-progressive (PP) group shows regional higher perfusion values as compared to the variable (V) group in both the uncorrected and corrected flow maps. This difference can be clearly seen in the corrected flow maps in the parietal regions including the precuneus. The PP group similarly shows significantly higher perfusion than the V group within the parietal lobe, but also temporal and frontal regions.
FIGURE 2
FIGURE 2
Example ASL perfusion maps of stable-stable (SS), V, and PP group separately. The examples of the V group demonstrate a lower perfusion within the precuneus, while in the example maps of both the SS and PP group perfusion in these regions remains relatively preserved.
FIGURE 3
FIGURE 3
Spearman’s rho correlation maps between ASL values and the Shapes test performance. A predominance of negative associations was found in the SS group, with positive correlations residing in the frontal and cerebellar regions. The PP group also displays a negative association in most of the brain areas especially in regions surrounding the ventricles. Interestingly, the Spearman rho maps of the V group show global prominent positive correlations in areas that show negative rho values in the SS group, residing largely in the medial part of the brain.
FIGURE 4
FIGURE 4
Group differences in the relation between neuroimaging parameters (ASL, CVR-CO2) and Shapes test performance. (A) Stronger positive relationship in the tempo-parietal junction and superior parietal lobe in V group as compared to the SS group. (B) Stronger positive correlation in both the PP and SS group as compared to the V group in right peri-sylvian and superior areas.
FIGURE 5
FIGURE 5
Differences in the cerebral vasoreactivity to CO2 (CVR CO2) response between groups. The PP group shows a stronger CVR CO2 response in comparison to the V group in the superior left parietal lobe.
FIGURE 6
FIGURE 6
Regional Spearman’s rho correlation maps between CVR CO2 response and the Shapes test performance. Both the SS and PP groups displayed a fairly similar pattern of correlation, showing a positive relationship in the medial brain, with a frontal display of negative rho values. In contrast, the V group demonstrates negative correlations in medial brain regions, along with positive ones in parietal areas.

Similar articles

Cited by

References

    1. Alsop D. C., Casement M., de Bazelaire C., Fong T., Press D. Z. (2008). Hippocampal hyperperfusion in Alzheimer’s disease. NeuroImage 42 1267–1274. 10.1016/j.neuroimage.2008.06.006 - DOI - PMC - PubMed
    1. Alsop D. C., Detre J. A., Grossman M. (2000). Assessment of cerebral blood flow in Alzheimer’s disease by spin-labeled magnetic resonance imaging. Ann. Neurol. 47 93–100. 10.1002/1531-8249(200001)47:1<93::AID-ANA15>3.0.CO;2-8 - DOI - PubMed
    1. Ashraf A., Fan Z., Brooks D., Edison P. (2015). Cortical hypermetabolism in MCI subjects: a compensatory mechanism? Eur. J. Nucl. Med. Mol. Imaging 42 447–458. 10.1007/s00259-014-2919-z - DOI - PubMed
    1. Asllani I., Habeck C., Scarmeas N., Borogovac A., Brown T. R., Stern Y. (2008). Multivariate and univariate analysis of continuous arterial spin labeling perfusion MRI in Alzheimer’s disease. J. Cereb. Blood Flow Metab. 28 725–736. 10.1038/sj.jcbfm.9600570 - DOI - PMC - PubMed
    1. Austin B. P., Nair V. A., Meier T. B., Xu G., Rowley H. A., Carlsson C. M., et al. (2011). Effects of hypoperfusion in Alzheimer’s disease. J. Alzheimers Dis. 26(Suppl. 3), 123–133. 10.3233/JAD-2011-0010 - DOI - PMC - PubMed