. 2019 Feb 19:10:131.
doi: 10.3389/fpls.2019.00131. eCollection 2019.

Effects of Different Chemical Forms of Nitrogen on the Quick and Reversible Inhibition of Soybean Nodule Growth and Nitrogen Fixation Activity

Affiliations

Effects of Different Chemical Forms of Nitrogen on the Quick and Reversible Inhibition of Soybean Nodule Growth and Nitrogen Fixation Activity

Natsumi Yamashita et al. Front Plant Sci. .

Abstract

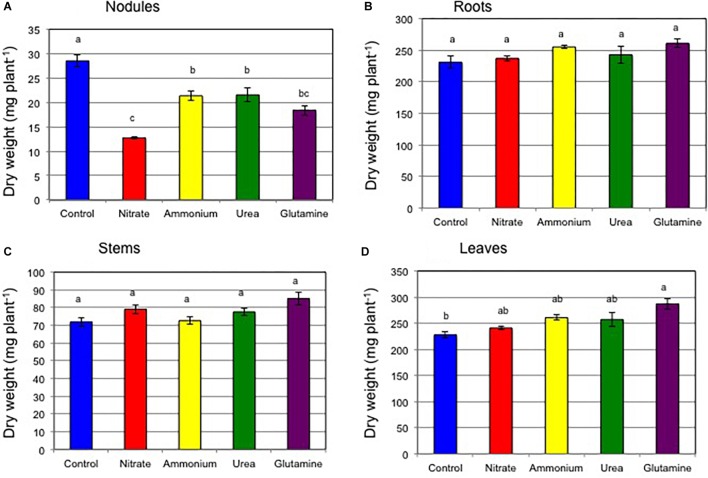
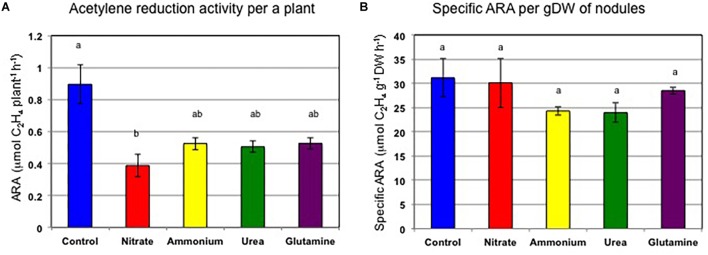
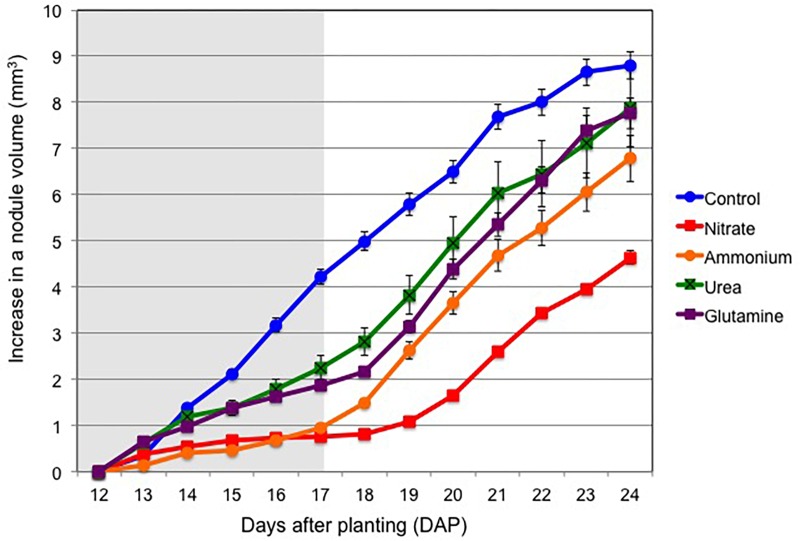
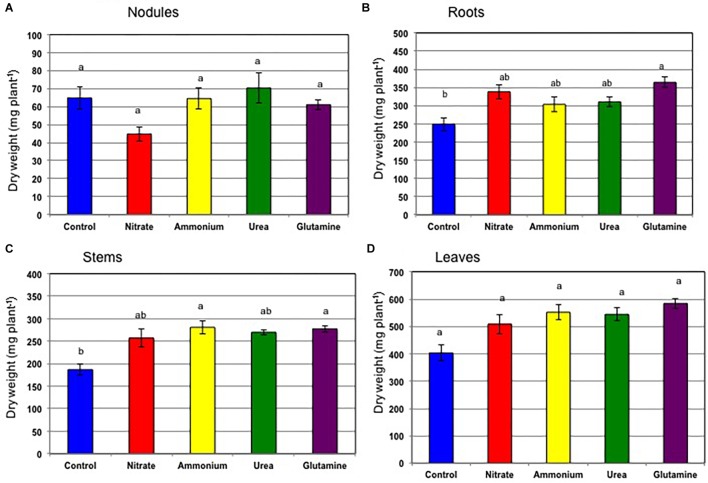
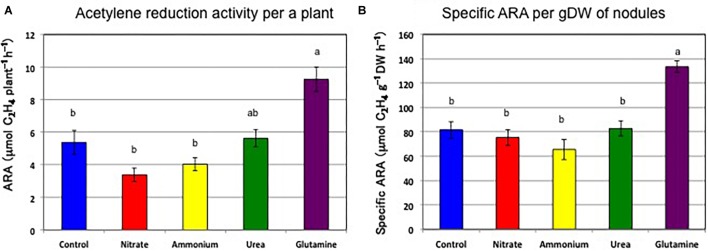
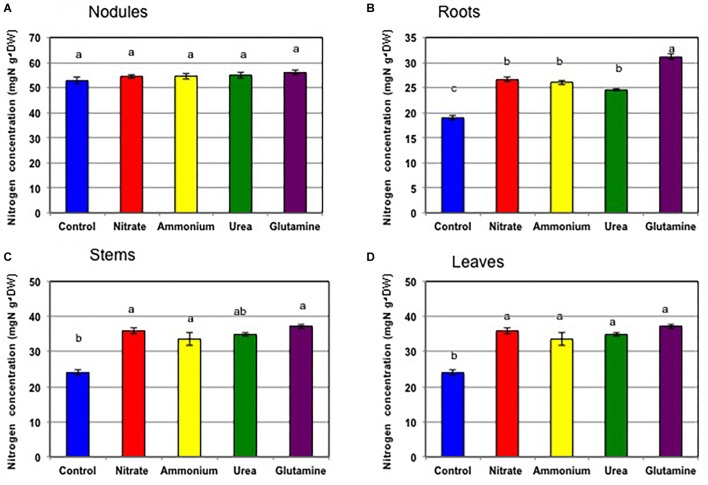
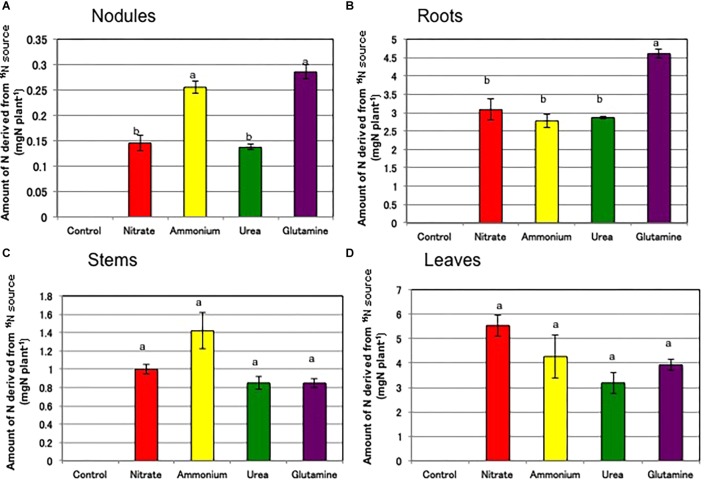
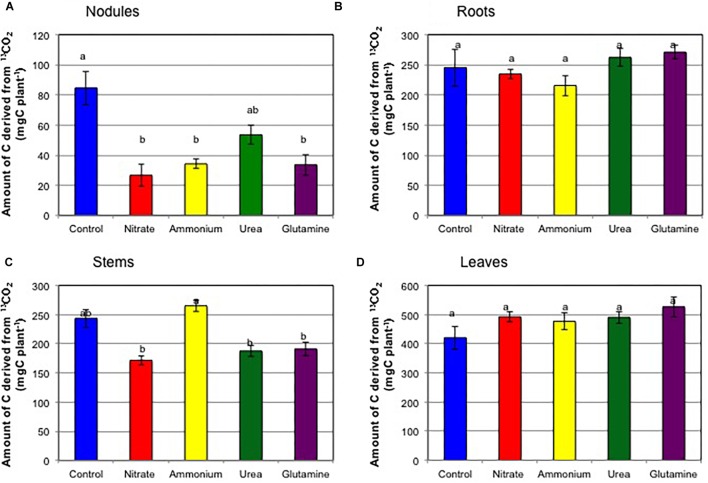
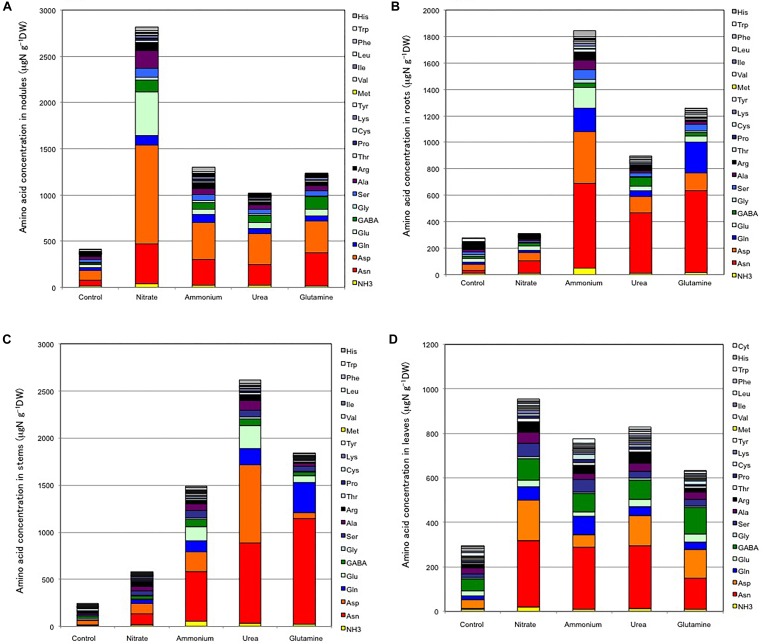
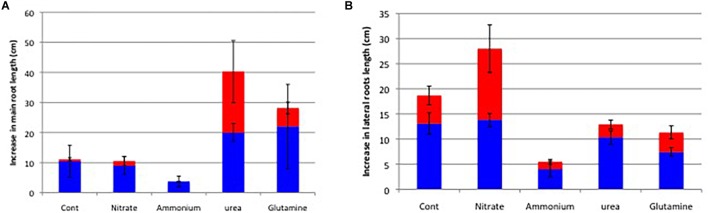
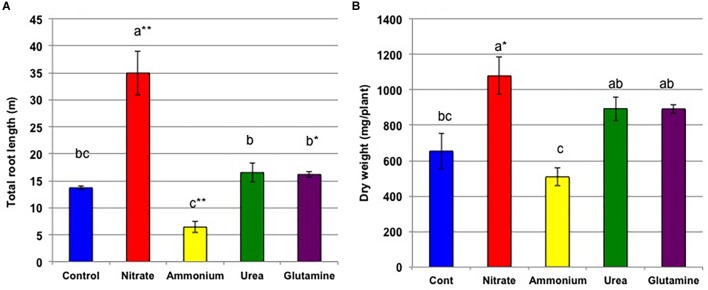
It has been reported that supply of nitrate to culture solution rapidly and reversibly inhibits nodule growth and nitrogen fixation activity of soybean. In this study, the effects of ammonium, urea, or glutamine on nodule growth and nitrogen fixation activity are compared with that for nitrate. Soybean plants were cultivated with a nitrogen-free nutrient solution, then 1 mM-N of nitrate, ammonium, glutamine, or urea were supplied from 12 DAP until 17 DAP. Repression of nodule growth and nitrogen fixation activity at 17 DAP were observed by ammonium, urea, and glutamine like nitrate, although the inhibitory effects were milder than nitrate. The removal of nitrogen from the culture solutions after nitrogen treatments resulted in a recovery of the nodule growth. It was found that the glutamine treatment followed by N-free cultivation gave highest nitrogen fixation activity about two times of the control. Tracer experiments with 15N and 13C were performed to evaluate the translocation of N and C to the different tissues. Culture solutions containing a 15N-labeled nitrogen source were supplied from 21 DAP, and the whole shoots were exposed to 13CO2 for 60 min on 23 DAP, and plants were harvested on 24 DAP. The percentage distribution of 15N in nodules was highest for ammonium (1.4%) followed by glutamine (0.78%), urea (0.32%) and nitrate (0.25%). The percentage distribution of 13C in the nodules was highest for the control (11.5%) followed by urea (5.8%), glutamine (2.6%), ammonium (2.3%), and nitrate (2.3%). The inhibitory effects of nitrogen compounds appeared to be related to a decrease in photoassimilate partitioning in the nodules, rather than 15N transport into the nodules. The free amino acid concentrations after nitrogen treatments were increased in the nodules and leaves by nitrate, in the roots by ammonium, in the stems by urea, and the roots, stems, and leaves by glutamine treatment. The concentrations of asparagine, aspartate, and glutamine were increased after nitrogen treatments. By the long-term supply of nitrogen for 2-weeks, nitrate significantly increased the lateral roots and leaf growth. The long-term supply of urea and glutamine also promoted the lateral roots and leaf growth, but ammonium suppressed them.

Keywords: 15N and 13C tracer experiment; ammonium; glutamine; nitrate; nitrogen fixation activity; nodule growth; soybean; urea.


Figures

FIGURE 1
FIGURE 1
Comparison of the dry weight of each plant tissue at 17 DAP supplied with control (N-free), nitrate, ammonium, urea, or glutamine from 12 to 17 DAP (Experiment 1). (A) Nodules. (B) Roots. (C) Stems. (D) Leaves. Averages and standard errors are shown (n = 4). Different letters above the column indicate significant differences at <0.05 by Tukey’s test.
FIGURE 2
FIGURE 2
Acetylene reduction activity per single plant, and specific acetylene reduction activity per nodule g dry weight on 17 DAP supplied with control (N-free), nitrate, ammonium, urea, or glutamine from 12 to 17 DAP for 5 days (Experiment 1). (A) ARA per single plant. (B) Specific ARA per g dry weight of nodules. Averages and standard errors are shown (n = 4). Different letters above the column indicate significant differences at <0.05 by Tukey’s test.
FIGURE 3
FIGURE 3
Changes in nodule volume from 12 to 24 DAP for treatments with control (N-free), nitrate, ammonium, urea, or glutamine from 12 to 17 DAP, thereafter cultivated with a N-free culture solution (Experiment 2). Shaded background indicates N treatment period, and white background indicates cultivation with N-free medium. Average and standard error are shown (n = 5).
FIGURE 4
FIGURE 4
Comparison of the dry weight of each plant tissue on 24 DAP for treatment with control (N-free), nitrate, ammonium, urea, or glutamine from 12 to 17 DAP, thereafter cultivated with a N-free culture solution (Experiment 2). (A) Nodules. (B) Roots. (C) Stems. (D) Leaves. Averages and standard errors are shown (n = 4). Different letters above the column indicate significant differences at <0.05 by Tukey’s test.
FIGURE 5
FIGURE 5
Acetylene reduction activity per single plant and specific acetylene reduction activity per nodule g dry weight on 24 DAP for treatments with control (N-free), nitrate, ammonium, urea, or glutamine for 5 days from 12 to 17 DAP with continuation of growth from 17 to 24 DAP with N-free medium (Experiment 2). (A) ARA per single plant. (B) Specific ARA per g dry weight of nodules. Averages and standard errors are shown (n = 4). Different letters above the column indicate significant differences at <0.05 by Tukey’s test.
FIGURE 6
FIGURE 6
Nitrogen concentration in tissues of soybean plants treated with control (N-free), nitrate, ammonium, urea, or glutamine for 3 days from 21 to 24 DAP (Experiment 2). (A) Nodules. (B) Roots. (C) Stems. (D) Leaves. Averages and standard errors are shown (n = 4). Different letters above the column indicate significant differences at <0.05 by Tukey’s test.
FIGURE 7
FIGURE 7
Amounts of N derived from 15N-labeled source in each tissue of soybean plants on 24 DAP supplied for 3 days from 21 to 24 DAP (Experiment 3). (A) Nodules. (B) Roots. (C) Stems. (D) Leaves. Averages and standard errors are shown (n = 4). Different letters above the column indicate significant differences among each treatment at <0.05 by Tukey’s test.
FIGURE 8
FIGURE 8
Amounts of C derived from 13C-labeled CO2 in each tissue of soybean plants on 24 DAP supplied for 1 h at 23 DAP (Experiment 3). (A) Nodules. (B) Roots. (C) Stems. (D) Leaves. Averages and standard errors are shown (n = 4). Different letters above the column indicate significant differences among each treatment at <0.05 by Tukey’s test.
FIGURE 9
FIGURE 9
Free amino acid concentrations in each tissue of soybean plants on 24 DAP supplied with various N compounds from 21 to 24 DAP (Experiment 3). (A) Nodules. (B) Roots. (C) Stems. (D) Leaves. Averages are shown (n = 4).
FIGURE 10
FIGURE 10
Increase in main roots (A) and the selected lateral roots (B) after the first week from 20 to 27 DAP (Blue bar), and the second week from 27 to 34 DAP (Red bar) of the treatments with various forms of N compounds (Experiment 4).
FIGURE 11
FIGURE 11
Total root length (A) and the dry weight of roots (B) on 34 DAP after 2 weeks of the treatments with various forms of N compounds (Experiment 4). Averages and standard errors are shown (n = 3). Different letters above the column indicate significant differences among each treatment at <0.05 by Tukey’s test.
FIGURE 12
FIGURE 12
Outline of the absorption, metabolism, and transport of various forms of N in soybean plants.

References

    1. Davidson I. A., Robson M. J. (1986). Effect of contrasting patterns of nitrate application on the nitrate uptake, N2-fixation, nodulation and growth of white clover. Ann. Bot. 57 331–338. 10.1093/oxfordjournals.aob.a087114 - DOI
    1. Forsum O., Svennerstam H., Ganeteg U., Nasholm T. (2008). Capacities and constraints of amino acid utilization in Arabidopsis. New Phytol. 179 1058–1069. 10.1111/j.1469-8137.2008.02546.x - DOI - PubMed
    1. Fujikake H., Yamazaki A., Ohtake N., Sueyoshi K., Matsuhashi S., Ito T., et al. (2003). Quick and reversible inhibition of soybean root nodule growth by nitrate involves a decrease in sucrose supply to nodules. J. Exp. Bot. 54 1379–1388. 10.1093/jxb/erg147 - DOI - PubMed
    1. Fujikake H., Yashima H., Sato T., Ohtake N., Sueyoshi K., Ohyama T. (2002). Rapid and reversible nitrate inhibition of nodule growth and N2 fixation activity in soybean (Glycine max (L.) Merr.). Soil Sci. Plant Nutr. 48 211–217. 10.1080/00380768.2002.10409193 - DOI
    1. Gibson A. H., Harper J. E. (1985). Nitrate effect on nodulation of soybean by Bradyrhizobium japonicum. Crop Sci. 25 497–501. 10.2135/cropsci1985.0011183X002500030015x - DOI

LinkOut - more resources