. 2019 May 21;47(9):4449-4461.
doi: 10.1093/nar/gkz161.

Epigenetic regulation of REX1 expression and chromatin binding specificity by HMGNs

Affiliations

Epigenetic regulation of REX1 expression and chromatin binding specificity by HMGNs

Shaofei Zhang et al. Nucleic Acids Res. .

Abstract

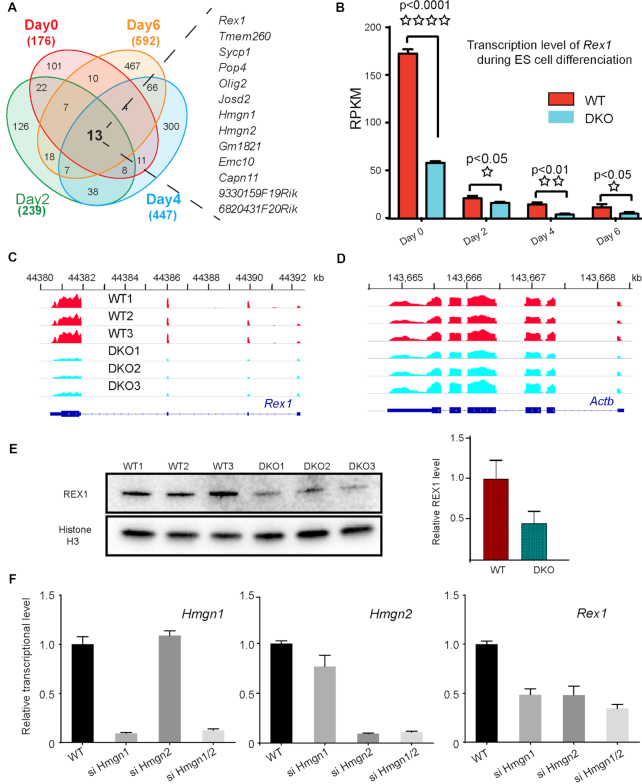
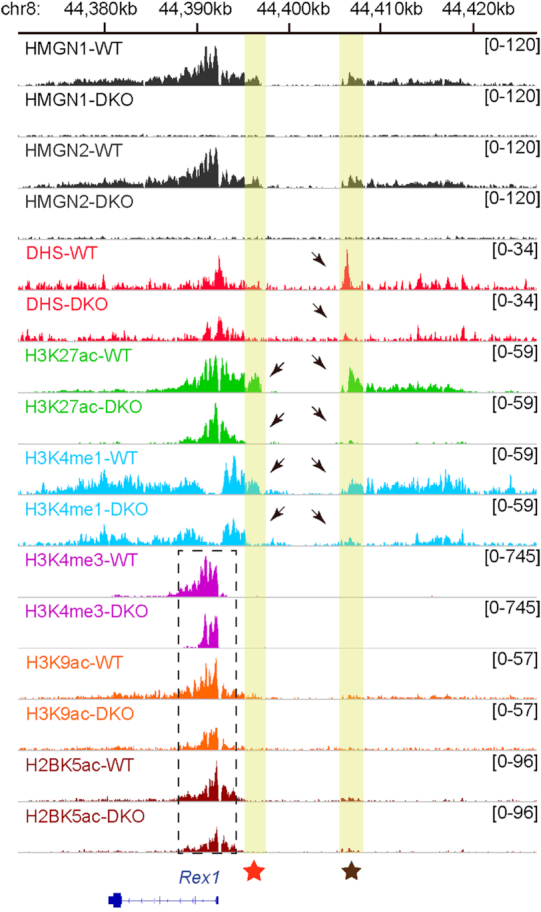
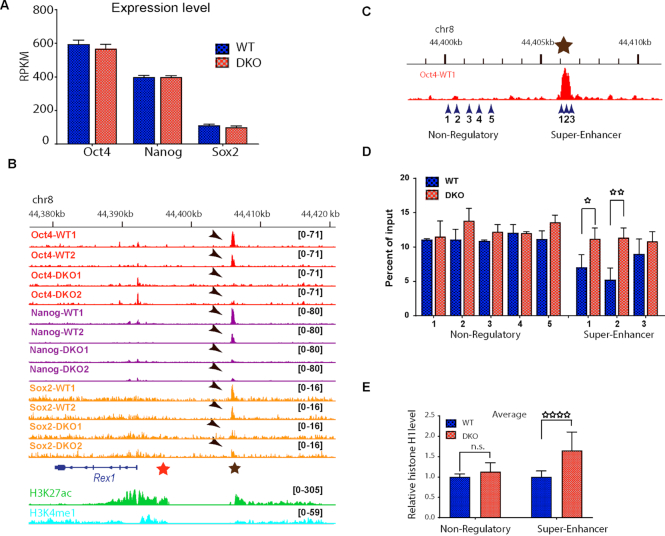
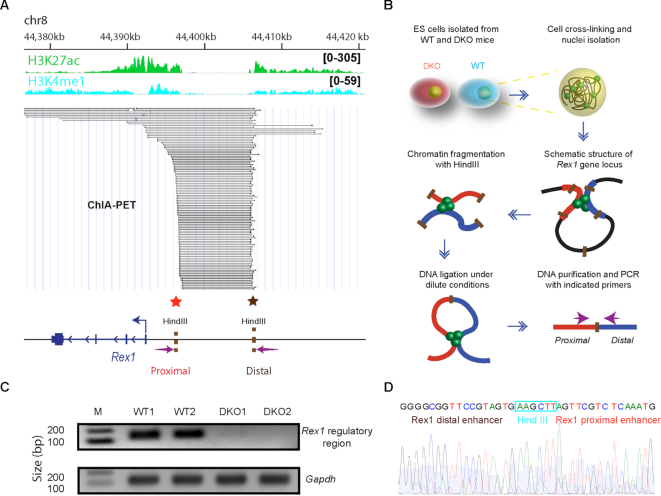
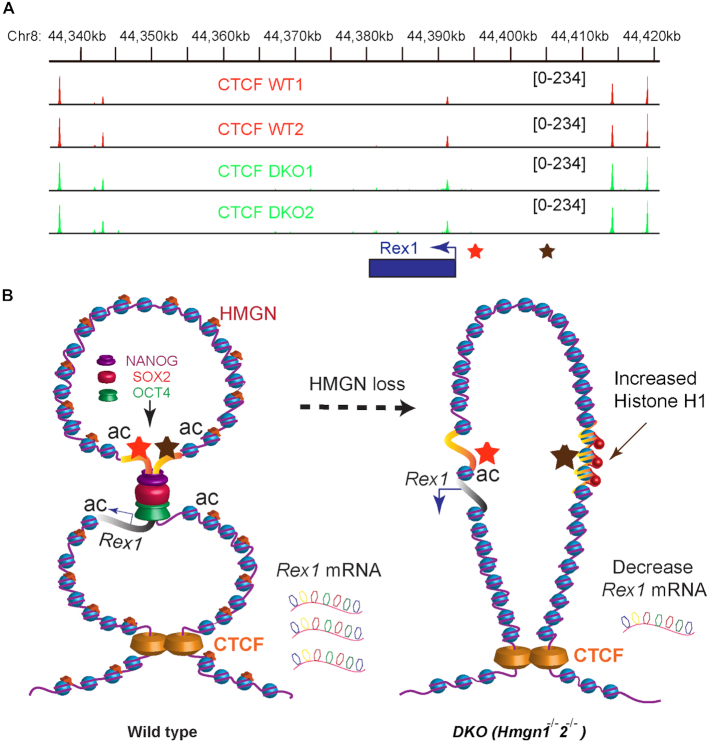
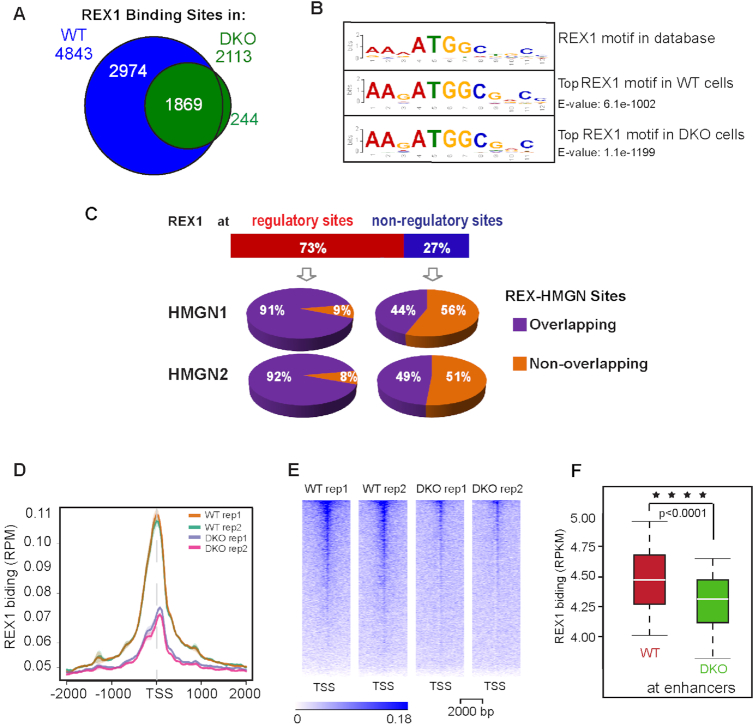
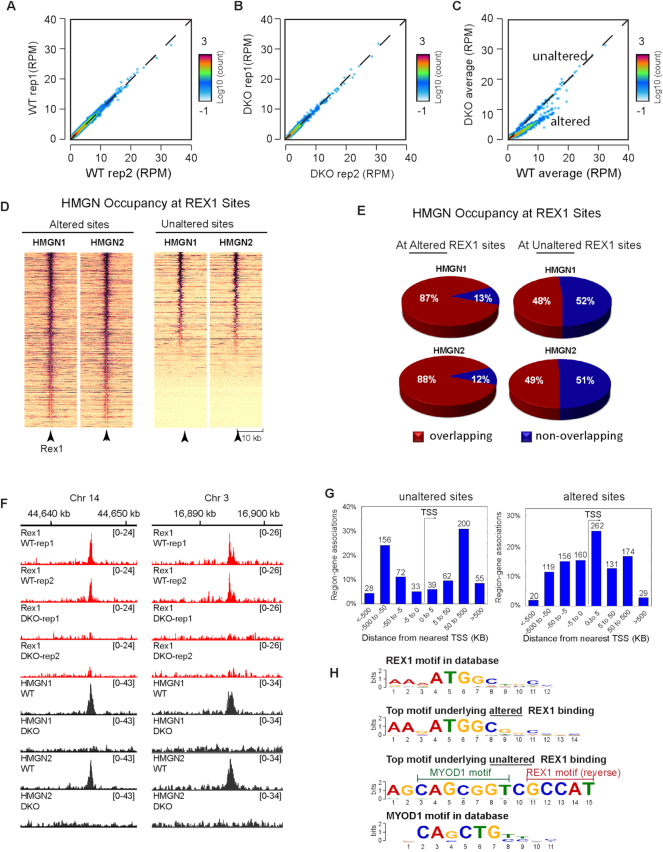
HMGN proteins localize to chromatin regulatory sites and modulate the cell-type specific transcription profile; however, the molecular mechanism whereby these ubiquitous nucleosome binding proteins affect gene expression is not fully understood. Here, we show that HMGNs regulate the expression of Rex1, one of the most highly transcribed genes in mouse embryonic stem cells (ESCs), by recruiting the transcription factors NANOG, OCT4 and SOX2 to an ESC-specific super enhancer located in the 5' region of Rex1. HMGNs facilitate the establishment of an epigenetic landscape characteristic of active chromatin and enhancer promoter interactions, as seen by chromatin conformation capture. Loss of HMGNs alters the local epigenetic profile, increases histone H1 occupancy, decreases transcription factors binding and reduces enhancer promoter interactions, thereby downregulating, but not abolishing Rex1 expression. ChIP-seq analyses show high colocalization of HMGNs and of REX1, a zinc finger protein, at promoters and enhancers. Loss of HMGNs preferentially reduces the specific binding of REX1 to these chromatin regulatory sites. Thus, HMGNs affects both the expression and the chromatin binding specificity of REX1. We suggest that HMGNs affect cell-type specific gene expression by modulating the binding specificity of transcription factors to chromatin.


Figures

Figure 1.
Figure 1.
HMGN proteins affect Rex1 expression. (A) Venn diagrams showing the overlap between down-regulated genes in DKO as compared to WT embryonic stem cells, at various days following LIF/2i withdrawal. The total number of genes with down regulated expression in DKO (1.3-fold; P < 0.05) at each EB differentiation stage is shown at the periphery of the diagram. The 13 genes listed on the right of the diagram are downregulated throughout the course of differentiation. (B) Transcription level of Rex1 in WT and DKO ESCs at indicated days following LIF/21 withdrawal. Shown are average value of three biological replicates measured by mRNA-seq. (C) IGV snapshot of 3 biological replicates showing mRNA level of Rex1 in ESCs. (D) IGV snapshot showing mRNA level of Actb as controls. (E) Down regulated expression of REX1 in DKO ESCs. Shown are western blots of three biological replicates. Histone H3 serves as loading control. Right: quantifications of the of REX1 expression relative to H3 using ImageJ. The expression of REX1 in WT ESCs is defined as 1.0. (F) siRNA mediated knock-down of Hmgn1 and Hmgn2 expression in WT ESCs reduces Rex1 expression. Average of two independent experiments.
Figure 2.
Figure 2.
Loss of HMGNs alters the chromatin regulatory landscape at the Rex1 locus. Shown are IGV snapshots depicting HMGN1and HMGN2 occupancy, DNase I hypersensitivity (DHS) and the levels of the indicated histone modifications at the Rex1 locus of ESCs isolated from WT and DKO mice. The yellow columns highlight the position of the proximal (red star) and distal (brown star) enhancer regions. Arrows point to the loss of DNase1, H2K27ac and H3K4me1 in DKO cells. Epigenetic changes in the proximal 5′ region of the Rex1 gene are seen in the box demarcated by dashed lines.
Figure 3.
Figure 3.
HMGN-H1 interplay regulates the binding of transcription factors to the Rex1 super-enhancer. (A) Loss of HMGNs does not affect the expression of Oct4, Nanog, or Sox2. Shown are average of three biological replicates of mRNA-seq. (B) IGV snapshots showing loss of OCT4, NANOG and SOX2 binding at the Rex1 super-enhancer in DKO ESCs. Shown are two biological replicates. Red and brown stars indicate location of the proximal enhancer and super-enhancer regions, respectively (as in Figure 2). Arrows point to the location of the transcription factors. Select histone marks at these regulatory regions shown at the bottom. (C) Genomic regions selected for histone H1 ChIP-qPCR experiment. For exact location see primer sequence in Materials and Methods. Brown star denotes the super enhancer region (compare to panel A). (D) Relative H1 occupancy in WT and DKO ESCs at the five non-regulatory and three super-enhancer regions of Rex1 shown on panel C. (E) Elevated H1 occupancy at the Rex1 super-enhancer, but not at adjacent nonregulatory chromatin regions, in DKO cells. Average of values obtained in WT cells are normalized to 1.0. *P < 0.05; **P < 0.01; ****P < 0.0001.
Figure 4.
Figure 4.
Loss of HMGNs disrupts chromatin interactions at the Rex1 5′ regulatory region. (A) ChIA-PET analysis of interactions between chromatin regulatory regions at the Rex1 locus (data from (33)). Regulatory region and select histone marks are indicated at the top. Each line in the figure indicates a detected interaction between two genomic loci. Below the lines is a genomic outline showing the approximate location of HindIII restriction sites and of the primers (arrows) used in 3C analysis (panel B). (B) Outline of the 3C procedure used to measure chromatin interactions in the 5′ regulatory region of Rex1. (C) DNA fragment resulting from PCR amplification of the 3C library using the primers located in the 5′ regulator region of Rex1 (see arrows in panel A). The absence of signal in DKO cells indicates loss of chromatin interaction. Gapdh primers are used as loading controls. (D) Sanger sequencing confirms that the PCR products correspond to the junction of the two regions located near the regulatory sites in the 5′ region of Rex1.
Figure 5.
Figure 5.
HMGN mediated chromatin interactions enhance Rex1 transcription by facilitating transcription factor binding at the Rex1 locus. (A) Loss of HMGNs does not affect CTCF binding at Rex1 locus. Shown are two biological replicates of CTCF occupancy at the Rex1 locus, as determined by ChIP-seq assay. (B) Model depicting HMGN effects on chromatin interactions and Rex1 expression. The Rex1 locus is located within a chromatin loop formed by the interaction of CTCF molecules flanking the upstream and downstream regions of the locus. In WT cells (left side of panel) the binding of NANOG, OCT4 and SOX2 at the super-enhancer located 5′ to the Rex1 gene facilitates interaction with proximal regulatory elements thereby optimizing Rex1 expression. Loss of HMGN (right side) does not affect CTCF binding but increases H1 occupancy, abolishes the binding of transcription factors to the super-enhancer, and reduces both the DNase I sensitivity and the levels of histone modification that mark active chromatin. These epigenetic changes prevent contact between the Rex1 super-enhancer and Rex1 proximal regulatory sites, thereby downregulating Rex1 expression.
Figure 6.
Figure 6.
Loss of HMGNs leads to a global reduction in REX1 binding to chromatin. (A) Venn diagram showing the number of REX1 binding sites detected by ChIP-seq in WT and DKO ESCs. (B) Top DNA sequence motif underlying the REX1 binding sites in WT and DKO cells. (C) Overlap between REX1 and HMGNs occupancy at chromatin regulatory sites. (D, E) Decreased REX1 occupancy at TSS and neighboring 4 kb regions in DKO cells. (F) Box plots showing decreased REX1 binding at enhancers of DKO cells. ****P < 0.0001.
Figure 7.
Figure 7.
Altered REX1 Chromatin occupancy in cells lacking HMGNs. (A) Scatter plots comparing intensities of REX1 peaks between two WT biological replicates. (B) Scatter plots comparing intensities of REX1 peaks between two DKO biological replicates. (C) Scatter plots comparing intensities of REX1 peaks between WT and DKO cells. (D) Heat map showing HMGN1 and HMGN2 occupancy at top altered and top unaltered REX1 binding sites. (E) HMGN occupancy at top altered (left) or unaltered (right) REX1 binding sites. (F) IGV snapshot showing colocalization of HMGNs and REX1 in the chromatin of WT cells and loss of REX1 binding in DKO cells (G) Distribution of top unaltered (left panel) and altered (right panel) REX1 binding sites relative to the nearest TSS. (H) Top DNA sequence motifs underlying the most unaltered and most altered REX1 binding sites in DKO cells. Note that the top motif underlying the unaltered REX1 sites (3rd row) contains the REX1 binding motif in the reverse complimentary orientation.

Similar articles

Cited by

References

    1. Zhu F., Farnung L., Kaasinen E., Sahu B., Yin Y., Wei B., Dodonova S.O., Nitta K.R., Morgunova E., Taipale M. et al. .. The interaction landscape between transcription factors and the nucleosome. Nature. 2018; 562:76–81. - PMC - PubMed
    1. Whyte W.A., Orlando D.A., Hnisz D., Abraham B.J., Lin C.Y., Kagey M.H., Rahl P.B., Lee T.I., Young R.A.. Master transcription factors and mediator establish super-enhancers at key cell identity genes. Cell. 2013; 153:307–319. - PMC - PubMed
    1. Hochedlinger K., Jaenisch R.. Induced pluripotency and epigenetic reprogramming. Cold Spring Harb. Perspect. Biol. 2015; 7:a019448. - PMC - PubMed
    1. Fyodorov D.V., Zhou B.R., Skoultchi A.I., Bai Y.. Emerging roles of linker histones in regulating chromatin structure and function. Nat. Rev. Mol. Cell Biol. 2018; 19:192–206. - PMC - PubMed
    1. Izzo A., Schneider R.. The role of linker histone H1 modifications in the regulation of gene expression and chromatin dynamics. Biochim. Biophys. Acta. 2016; 1859:486–495. - PubMed

Publication types

MeSH terms