

A hierarchy of corticospinal plasticity in human hand and forearm muscles
- PMID: 30839110
- PMCID: PMC6567854
- DOI: 10.1113/JP277462
A hierarchy of corticospinal plasticity in human hand and forearm muscles
Abstract
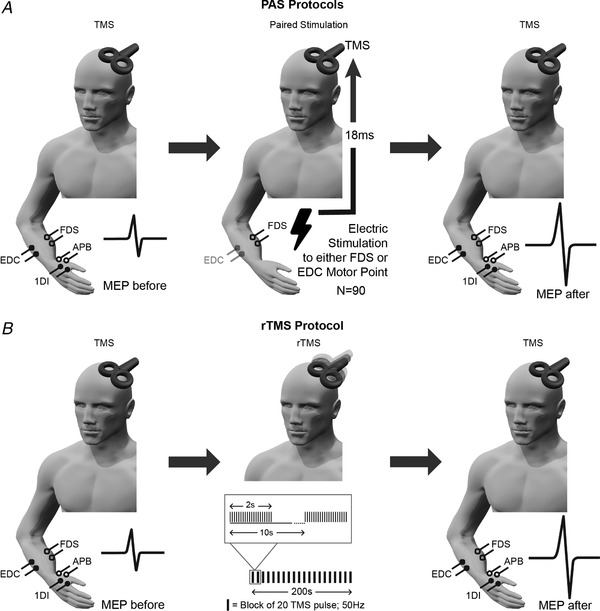
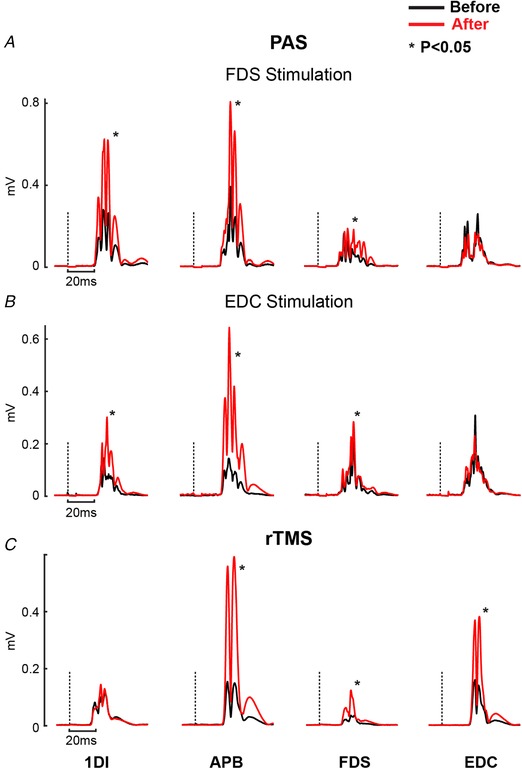
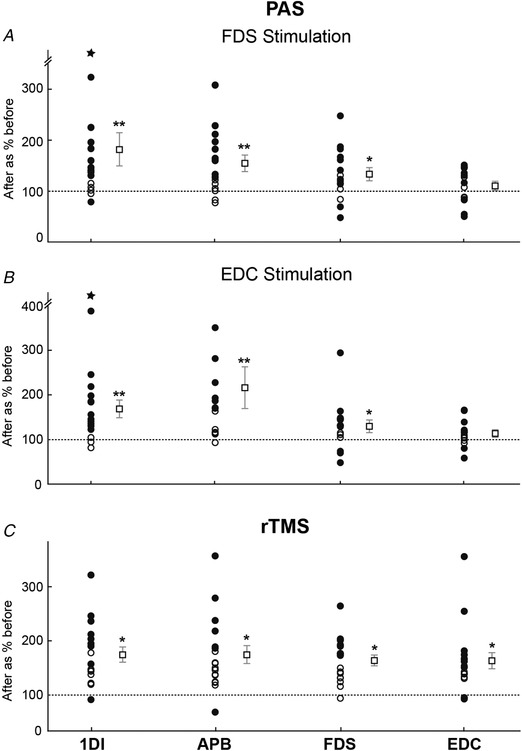
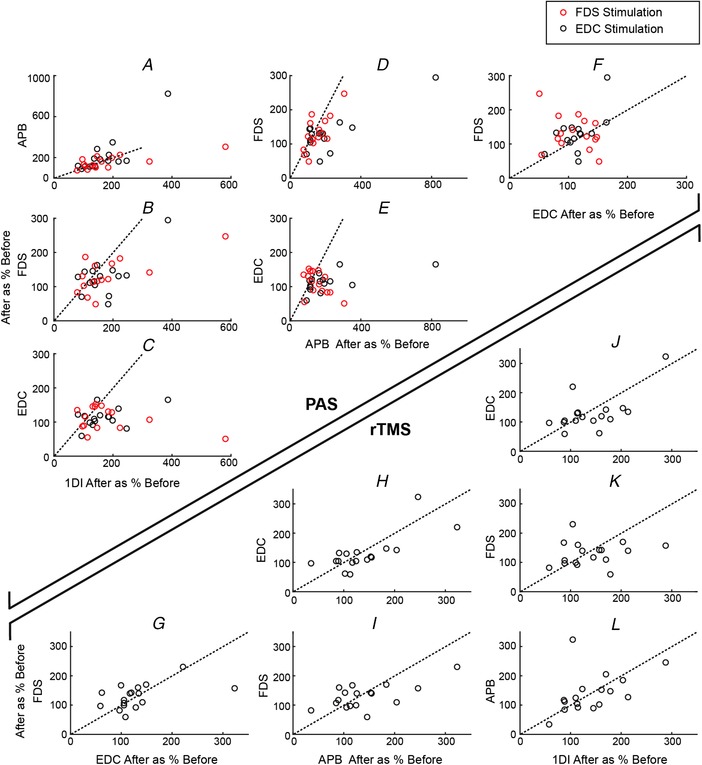
Key points: Pairing stimulation of a finger flexor or extensor muscle at the motor point with transcranial magnetic stimulation (TMS) of the motor cortex generated plastic changes in motor output. Increases in output were greater in intrinsic hand muscles than in the finger flexor. No changes occurred in the finger extensor. This gradient was seen irrespective of which muscle was stimulated paired with transcranial magnetic stimulation. Intermittent theta-burst stimulation also produced increases in output, although these were similar across muscles. We suggest that intrinsic hand and flexor muscles have a higher potential to show plasticity than extensors, although only when plasticity is induced by sensory input. This may relate to differences seen in recovery of function in these muscles after injury, such as post-stroke.
Abstract: The ability of the motor system to show plastic change underlies skill learning and also permits recovery after injury. One puzzling observation is that, after stroke, upper limb flexor muscles show good recovery but extensors remain weak, with this being a major contributor to residual disability. We hypothesized that there might be differences in potential for plasticity across hand and forearm muscles. In the present study, we investigated this using two protocols based on transcranial magnetic brain stimulation (TMS) in healthy human subjects. Baseline TMS responses were recorded from two intrinsic hand muscles: flexor digitorum superficialis (FDS) and extensor digitorum communis (EDC). In the first study, paired associative stimulation (PAS) was delivered by pairing motor point stimulation of FDS or EDC with TMS. Responses were then remeasured. Increases were greatest in the hand muscles, smaller in FDS and non-significant in EDC, irrespective of whether stimulation of FDS or EDC was used. In the second study, intermittent theta-burst rapid rate TMS was applied instead of PAS. In this case, all muscles showed similar increases in TMS responses. We conclude that the potential to show plastic changes in motor cortical output has the gradient: hand muscles > flexors > extensors. However, this was only seen in a protocol that requires integration of sensory input (PAS) and not when plasticity was induced purely by cortical stimulation (rapid rate TMS). This observation may relate to why functional recovery tends to favour flexor and hand muscles over extensors.
Keywords: Corticospinal tract; Motor cortex; Plasticity; Transcranial magnetic stimulation.
© 2019 The Authors. The Journal of Physiology published by John Wiley & Sons Ltd on behalf of The Physiological Society.
Figures
Comment in
-
Disparity among muscles: different levels of plasticity of cortical representation of different muscles revealed by transcranial magnetic stimulation.J Physiol. 2019 May;597(10):2613-2614. doi: 10.1113/JP277940. Epub 2019 Apr 16. J Physiol. 2019. PMID: 30919958 Free PMC article. No abstract available.
References
-
- Andersen P, Hagan PJ, Phillips CG & Powell TPS (1975). Mapping by microstimulation of overlapping projections from area 4 to motor units of the baboon's hand. Proc R Soc London B Biol Sci 188, 31–60. - PubMed
-
- Baker SN, Zaaimi B, Fisher KM, Edgley SA & Soteropoulos DS (2015). Pathways mediating functional recovery. Prog Brain Res 218, 389–412. - PubMed
-
- Belhaj‐Saif A & Cheney PD (2000). Plasticity in the distribution of the red nucleus output to forearm muscles after unilateral lesions of the pyramidal tract. J Neurophysiol 83, 3147–3153. - PubMed
-
- Benecke R, Meyer BU & Freund HJ (1991). Reorganisation of descending motor pathways in patients after hemispherectomy and severe hemispheric lesions demonstrated by magnetic brain stimulation. Exp Brain Res 83, 419–426. - PubMed
-
- Bergquist AJ, Clair JM, Lagerquist O, Mang CS, Okuma Y & Collins DF (2011). Neuromuscular electrical stimulation: implications of the electrically evoked sensory volley. Eur J Appl Physiol 111, 2409–2426. - PubMed
Publication types
MeSH terms
Grants and funding
LinkOut - more resources
Full Text Sources