Case Reports
. 2019 Apr;39(4):802-816.
doi: 10.1097/IAE.0000000000002461.

CLINICOPATHOLOGIC CORRELATION OF GEOGRAPHIC ATROPHY SECONDARY TO AGE-RELATED MACULAR DEGENERATION

Affiliations
Case Reports

CLINICOPATHOLOGIC CORRELATION OF GEOGRAPHIC ATROPHY SECONDARY TO AGE-RELATED MACULAR DEGENERATION

Miaoling Li et al. Retina. 2019 Apr.

Abstract

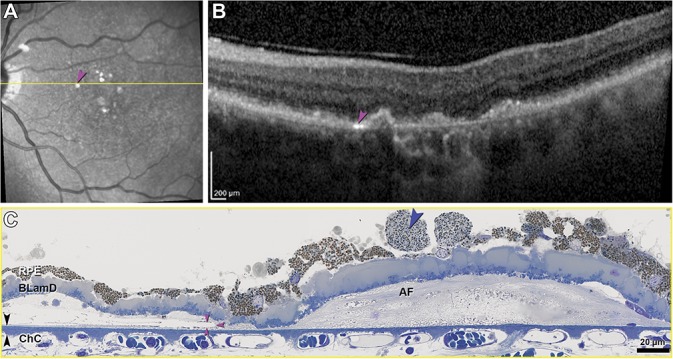
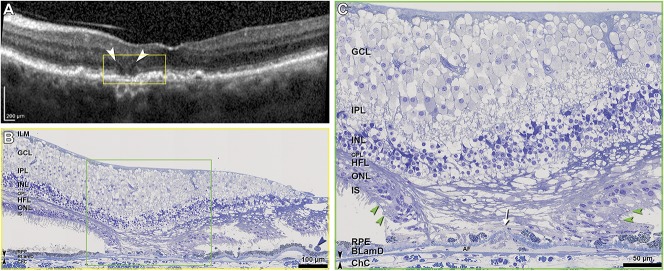
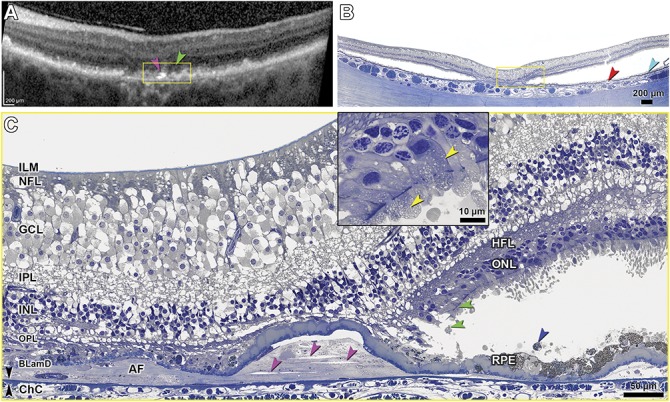
Purpose: In an eye with geographic atrophy (GA) secondary to age-related macular degeneration, we correlated ex vivo histologic features with findings recorded in vivo using optical coherence tomography (OCT), near-infrared reflectance imaging, and fundus autofluorescence.

Methods: In the left eye of an 86-year-old white woman, in vivo near-infrared reflectance and eye-tracked OCT B-scans at each of 6 clinic visits and a baseline fundus autofluorescence image were correlated with high-resolution histologic images of the preserved donor eye.

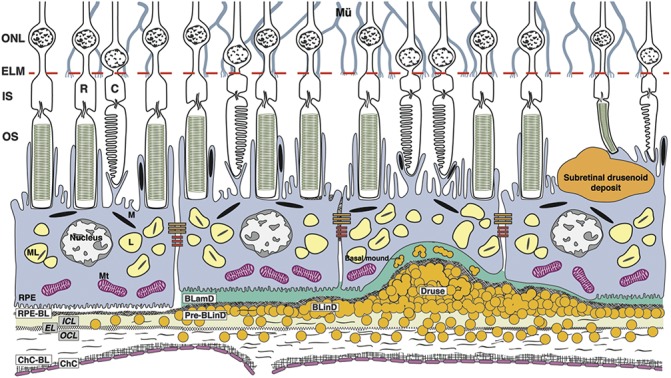
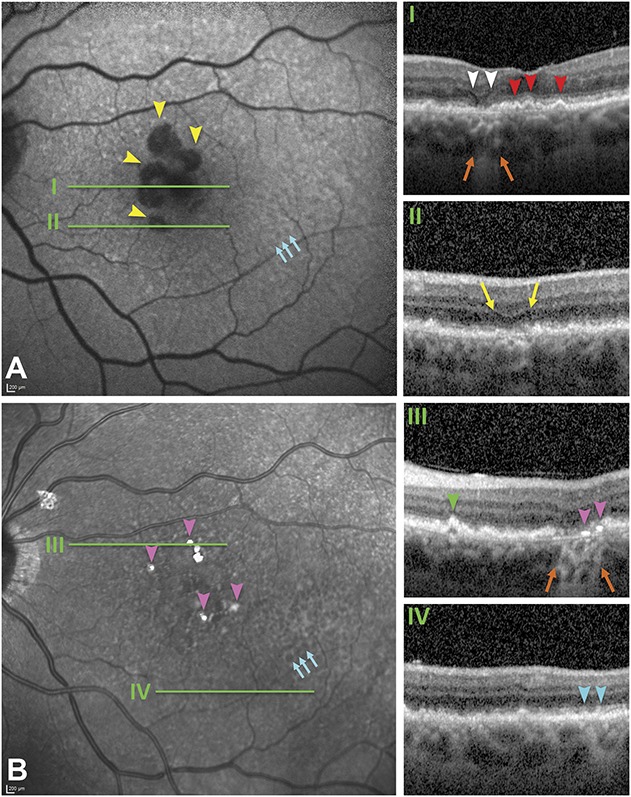
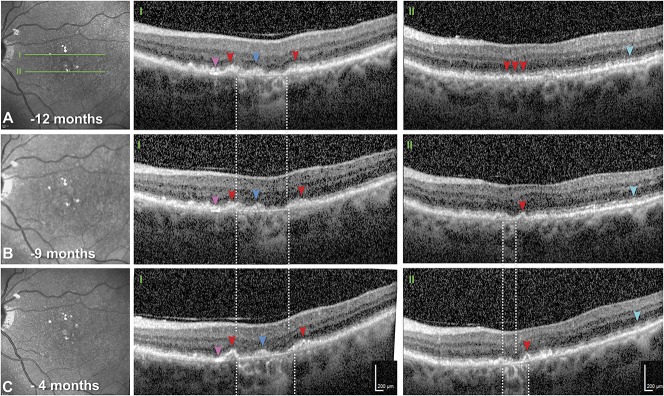
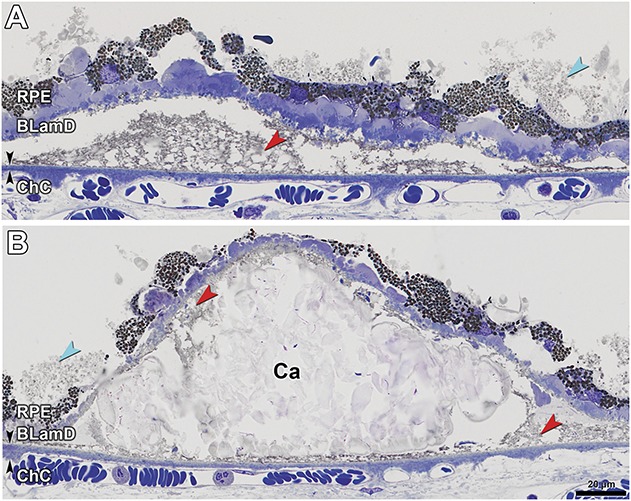
Results: Clinical imaging showed a small parafoveal multilobular area of GA, subfoveal soft drusen, refractile drusen, hyperreflective lines near the Bruch membrane, subretinal drusenoid deposit (reticular pseudodrusen), and absence of hyperautofluorescent foci at the GA margin. By histology, soft drusen end-stages included avascular fibrosis with highly reflective cholesterol crystals. These accounted for hyperreflective lines near the Bruch membrane in OCT and plaques in near-infrared reflectance imaging. Subretinal drusenoid deposit was thick, continuous, extracellular, extensive outside the fovea, and associated with distinctive retinal pigment epithelium dysmorphia and photoreceptor degeneration. A hyporeflective wedge corresponded to ordered Henle fibers without cellular infiltration. The external limiting membrane descent, which delimits GA, was best visualized in high-quality OCT B-scans. Retinal pigment epithelium and photoreceptor changes at the external limiting membrane descent were consistent with our recent histologic survey of donor eyes.

Conclusion: This case informs on the extent, topography, and lifecycle of extracellular deposits. High-quality OCT scans are required to reveal all tissue features relevant to age-related macular degeneration progression to GA, especially the external limiting membrane descent. Histologically validated signatures of structural OCT B-scans can serve as references for other imaging modalities.


Conflict of interest statement

None of the authors has any financial/conflicting interests to disclose.

Figures

Fig. 1.
Fig. 1.
Age-related macular degeneration, by the layers. Mü, Müller glia; ONL, outer nuclear layer; R, rods; C, cones; ELM, external limiting membrane; IS, inner segments of photoreceptors; OS, outer segments of photoreceptors; RPE, retinal pigment epithelium; M, melanosome; ML, melanolipofuscin; Mt, mitochondria; RPE-BL, RPE basal lamina; BLamD, basal laminar deposit; BLinD, basal linear deposit; ICL, inner collagenous layer; EL, elastic layer; OCL, outer collagenous layer; ChC-BL, ChC basal lamina; yellow circles, lipoprotein particles. The Bruch membrane (BrM) consists of the ICL, EL, and OCL. Soft drusen and BLinD are two forms (lump and layer) of the same AMD-specific extracellular deposit. Basal mound is soft druse material within BLamD. Basal laminar deposit is thickened RPE-BL. Subretinal drusenoid deposit localizes to the subretinal space (between photoreceptors and RPE).
Fig. 2.
Fig. 2.
Guide to assessment locations in Table 2. In Table 2, layer thicknesses are displayed for 7 locations from nasal to temporal. Locations 1 and 7 compare SDD with different clinical appearances. Locations 2 to 6 compare changes across the border of atrophy as defined by the descent of the ELM. A. Baseline autofluorescence image of the index case. 1. Area of SDD (reticular pseudodrusen), nasal perifovea; (2 and 3) 500 and 100 µm, respectively, from the ELM descent in nonatrophic retina, nasal parafovea; (4) 100 µm from the ELM descent, in the GA area, both sides pooled, nasal parafovea; (5 and 6) 500 and 100 µm, respectively, from the ELM descent, nonatrophic retina, fovea; and (7) area of “target-appearance” SDD, temporal perifovea. B. Distribution of cone and rod photoreceptor inner segments (IS) per mm2 in adult human macula, as determined from retinal flatmounts. Layer thickness assessment locations in the index eye are indicated. Stippling indicates the optic nerve head.
Fig. 3.
Fig. 3.
Main OCT features related to GA secondary to AMD. Green lines in (A and B) correspond with the OCT B-scans (IIV). A. Fundus autofluorescence shows multilobular areas of hypoautofluorescence corresponding to RPE atrophy (yellow arrowheads) that lack hyperautofluorescent margins. Hypoautofluorescent dots concentrated temporally correspond to subretinal drusenoid deposits, (also called pseudodrusen; teal arrows) by correspondence with Panel B. B. Near-infrared reflectance demonstrates an area of several target-like pseudodrusen (dot or Type 3 SDD, teal arrows), a rough texture elsewhere in the macula, and intensely hyperreflective plaques (pink arrowheads). The atrophic area and refractile drusen are minimally visible. Optical coherence tomography B-scans at baseline (12 months before death; I, II, and IV) and at the last available visit (4 months before death, III). Orange arrows, hypertransmission, signifying RPE atrophy. I. Wedge-shaped hyporeflectivity (white arrowheads) at the GA border and RPE elevations with homogeneously reflective contents consistent with soft drusen (red arrowheads); (II) an area of nascent GA (yellow arrows) with diffuse thickening of the RPE–BLamD–Bruch membrane complex; (III) an area of GA (orange arrows) showing two focal hyperreflective lines above and parallel to the Bruch membrane (pink arrowheads). A pyramidal RPE elevation with hyperreflective dots and hyporeflective interior represents a refractile druse with calcific nodules (green arrowhead; Figure 4). IV. SDD (teal arrowheads). The ART (mean number of scans per image) ranged from 29 on (I) to 9 to 10 on (IIIV), and quality values ranged from 17 to 20 dB on (IIIV) to 28 dB on (I), accounting for differences in visualization of details.
Fig. 4.
Fig. 4.
Eye-tracked OCT scans showing progression of GA. AC. Near-infrared reflectance at 12, 9, and 4 months before death. Green lines (A) reference OCT B-scans at 2 different planes (I and II). I and II. White-dashed lines delimit choroidal hypertransmission, signifying GA. In both scans, the choroid is thick and lacking abnormalities in either vessel caliber or overall appearance (i.e., no pachyvessels or infiltrative or degenerative changes). The ART function was 9 to 10. Quality values ranged from 17 to 24 dB. I. Geographic atrophy expands from baseline. Retinal pigment epithelium elevations with smooth contours and homogeneously hyperreflective contents (red arrowheads) are consistent with soft drusen. Above and parallel to the Bruch membrane is a focal, intensely hyperreflective line (pink arrowheads), and hyperreflective material persists in the atrophic area (blue arrowheads). II. Three months after baseline, a new area of GA appears. At baseline and throughout follow-up, RPE elevations consistent with soft drusen (red arrowheads) are present. Hyperreflective material above the RPE, sometimes regularly spaced, represents widespread SDDs (teal arrowheads).
Fig. 5.
Fig. 5.
Subretinal drusenoid deposits (SDD) and surrounding cells correlating to different appearances in multimodal imaging. IPL, inner plexiform layer; INL, inner nuclear layer; OPL, outer plexiform layer; IS, inner segments; OS, outer segments; RPE, retinal pigment epithelium; ChC, choriocapillaris. ELM, green arrowheads; SDD, aqua arrowheads; Bruch membrane, black arrowheads. Retracted mitochondria in cone IS, dark green arrowheads. A. In the temporal area with target-like pseudodrusen (Figure 3, A and B), SDD (aqua arrowhead) are confluent and punctuated with OS crossing the deposit to reach RPE (yellow arrowheads), which is nonuniform in thickness. B. In areas with a roughened texture on NIR imaging (Figure 3B), SDD (aqua arrowhead) is less confluent with some caps resembling OS (yellow arrowhead), OS are shorter, and RPE is continuous but markedly dysmorphic with inward extensions (blue arrowhead). Basal linear deposit, red arrowheads. Basal mound, red arrow. Insets: top, sloughed RPE cells. Bottom, phagocytes occasionally appearing among SDD in other sections. Detached retina in B was digitally reapproximated.
Fig. 6.
Fig. 6.
Soft and calcified drusen in GA secondary to AMD. Bruch membrane, black arrowheads. Lipid-rich lipoprotein-derived debris (membranous debris of Sarks), red arrowheads. Subretinal drusenoid deposit, aqua arrowheads. RPE, retinal pigment epithelium; BLamD, basal laminar deposit; ChC, choriocapillaris. A. Soft druse with partially preserved contents has late (scalloped) BLamD. B. Calcific nodules (Ca) are one end-stage of soft drusen. Some original contents still remain.
Fig. 7.
Fig. 7.
Cholesterol clefts, avascular fibrosis, and dysmorphia of RPE. RPE, retinal pigment epithelium; BLamD, basal laminar deposit; ChC, choriocapillaris; AF, avascular fibrosis; Bruch membrane, black arrowheads. A. Near-infrared reflectance imaging shows multiple hyperreflective plaques (pink arrowhead). Yellow line, B-scan level in (B). B. An intensely hyperreflective line parallels BrM (pink arrowhead). Adjacent is an irregular RPE elevation with moderate, heterogeneous reflectivity distinct from a soft druse. C. A cholesterol cleft (pink arrowheads) correlates to the hyperreflective line in (A)/(B). The distance from top and bottom surfaces of the cleft to the inner surface of BrM is 5.1 and 1.8 µm, respectively. Sloughed RPE cells (blue arrowhead) have smaller, more loosely packed, and greener-staining granules than adjacent dysmorphic yet still continuous RPE.
Fig. 8.
Fig. 8.
In vivo OCT and histopathology of Monés hyporeflective wedge in GA. ILM, inner limiting membrane; GCL, ganglion cell layer; IPL, inner plexiform layer; INL, inner nuclear layer; OPL, outer plexiform layer; HFL, Henle fiber layer; ONL, outer nuclear layer; IS, inner segments, RPE, retinal pigment epithelium; BLamD, basal laminar deposit; ChC, choriocapillaris; descent of the ELM, green arrowheads; Bruch membrane, double black arrowheads. A. Optical coherence tomography shows two hyporeflective wedged-shaped bands (white arrowheads), with overlying subsidence of INL, interrupted ELM (descents are not visible), interrupted ellipsoid zone, and RPE elevations. Single black arrowhead, sloughed RPE. B and C. Histology shows ordered HFL (i.e., parallel fibers, despite artifactual postmortem separation), and no cellular infiltration degenerating photoreceptors, and atrophic ONL. Müller cell processes invade the sub–RPE-BLamD space (white arrow). AF, avascular fibrosis.
Fig. 9.
Fig. 9.
In vivo OCT and histopathology correlation of photoreceptor degeneration in GA. ILM, inner limiting membrane; GCL, ganglion cell layer; IPL, inner plexiform layer; INL, inner nuclear layer; OPL, outer plexiform layer; BLamD, basal laminar deposit; ChC, choriocapillaris. Bruch membrane, black arrowheads. A. In vivo OCT shows cRORA, OPL subsidence, inner retina thickening, and intensely hyperreflective lines (pink arrowhead) above BrM. B. Correlative histology shows atrophy of photoreceptor and RPE layers flanked by artifactual postmortem retinal detachment. Drusen, red arrowhead; SDD, teal arrowhead. C. In the yellow-framed atrophic area of Panels A and B, the ONL and RPE are absent, and avascular fibrosis (AF) is seen beneath BLamD. Clefts in the AF (pink arrowheads) correlate to the hyperreflective lines in panel A. Distances from the top-bottom surfaces of the clefts (pink arrowheads) to the inner collagenous layer of BrM are (from left to right) 11.8 to 10.2 µm, 30.4 to 26.8 µm, and 23.8 to 19.9 µm, respectively. In the nonatrophic area, near the descent of ELM (green arrowheads), photoreceptor nuclei and mitochondria (yellow arrowheads, inset) are retracted toward HFL. Sloughed RPE, blue arrowhead. At the upper right is artifactual thickening of inner retina due to edema (See Figure S1, Supplemental Digital Content 1, http://links.lww.com/IAE/A954).

Similar articles

Cited by

References

    1. Sadda SR, Guymer R, Holz FG, et al. Consensus definition for atrophy associated with age-related macular degeneration on OCT: classification of atrophy report 3. Ophthalmology 2018;125:537–548. - PMC - PubMed
    1. Holz FG, Sadda SR, Busbee B, et al. Efficacy and safety of lampalizumab for geographic atrophy due to age-related macular degeneration: chroma and spectri phase 3 randomized clinical trials. JAMA Ophthalmol 2018;136:666–677. - PMC - PubMed
    1. Jaffe GJ, Schmitz-Valckenberg S, Boyer D, et al. Randomized trial to evaluate tandospirone in geographic atrophy secondary to age-related macular degeneration: the GATE study. Am J Ophthalmol 2015;160:1226–1234. - PubMed
    1. Rosenfeld PJ, Dugel PU, Holz FG, et al. Emixustat hydrochloride for geographic atrophy secondary to age-related macular degeneration: a randomized clinical trial. Ophthalmology 2018;125:1556–1567. - PubMed
    1. Holz FG, Sadda SR, Staurenghi G, et al. Imaging protocols in clinical studies in advanced age-related macular degeneration: recommendations from classification of atrophy consensus meetings. Ophthalmology 2017;124:464–478. - PubMed

Publication types

MeSH terms