. 2018 Apr 6:7:17172.
doi: 10.1038/lsa.2017.172. eCollection 2018.

Boron nitride nanoresonators for phonon-enhanced molecular vibrational spectroscopy at the strong coupling limit

Affiliations

Boron nitride nanoresonators for phonon-enhanced molecular vibrational spectroscopy at the strong coupling limit

Marta Autore et al. Light Sci Appl. .

Abstract

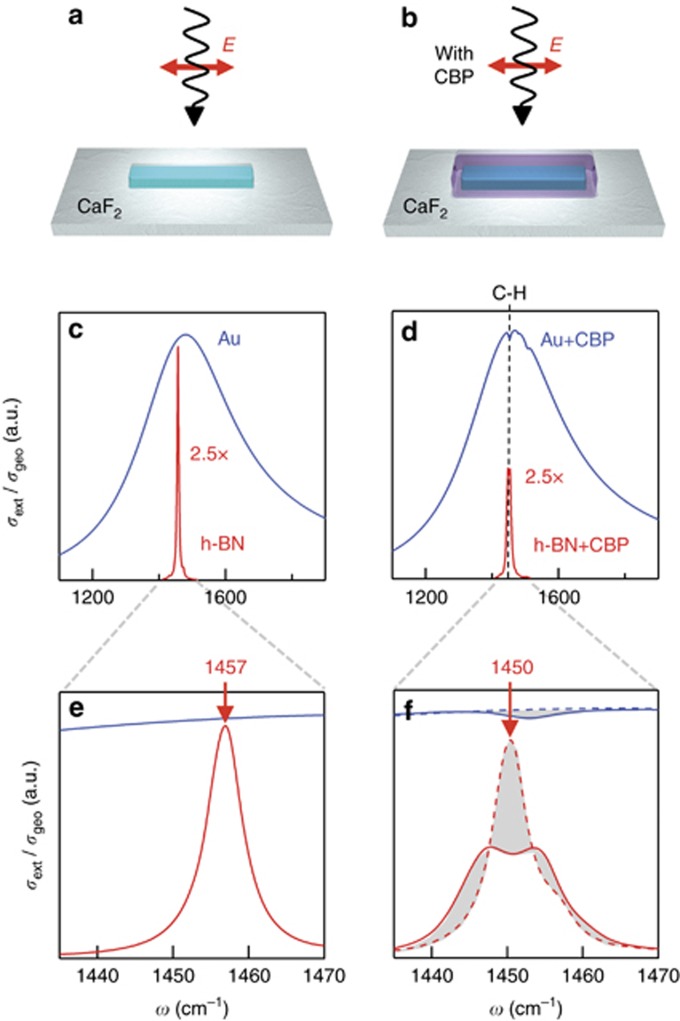
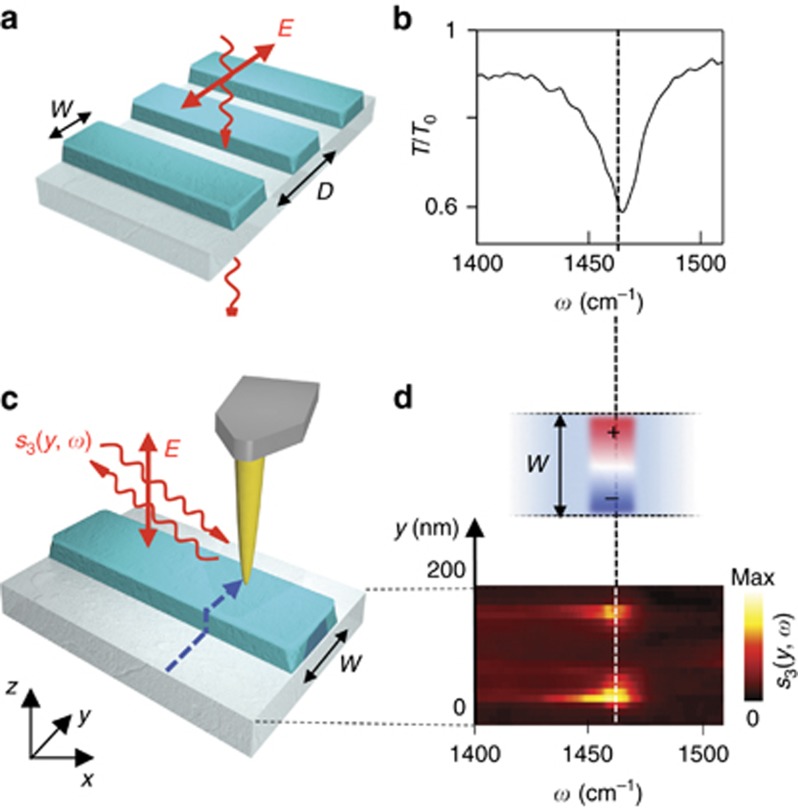
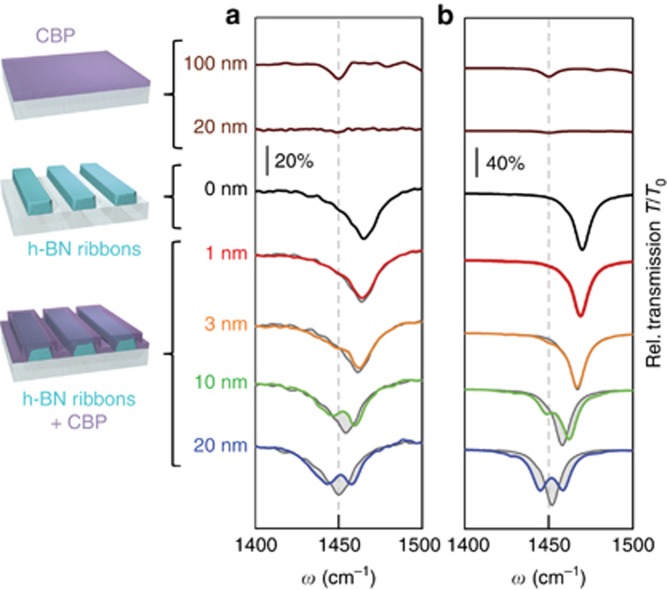
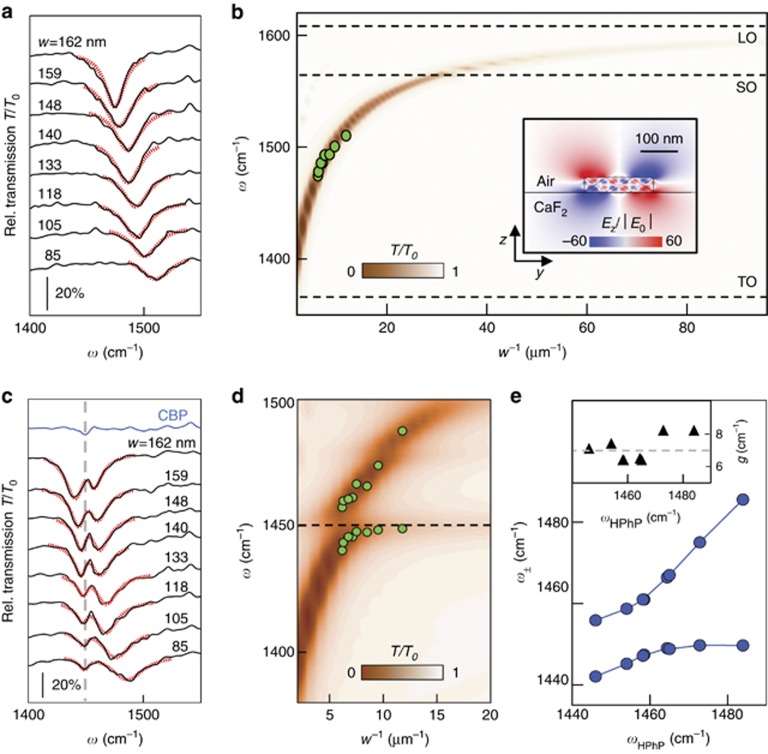
Enhanced light-matter interactions are the basis of surface-enhanced infrared absorption (SEIRA) spectroscopy, and conventionally rely on plasmonic materials and their capability to focus light to nanoscale spot sizes. Phonon polariton nanoresonators made of polar crystals could represent an interesting alternative, since they exhibit large quality factors, which go far beyond those of their plasmonic counterparts. The recent emergence of van der Waals crystals enables the fabrication of high-quality nanophotonic resonators based on phonon polaritons, as reported for the prototypical infrared-phononic material hexagonal boron nitride (h-BN). In this work we use, for the first time, phonon-polariton-resonant h-BN ribbons for SEIRA spectroscopy of small amounts of organic molecules in Fourier transform infrared spectroscopy. Strikingly, the interaction between phonon polaritons and molecular vibrations reaches experimentally the onset of the strong coupling regime, while numerical simulations predict that vibrational strong coupling can be fully achieved. Phonon polariton nanoresonators thus could become a viable platform for sensing, local control of chemical reactivity and infrared quantum cavity optics experiments.

Keywords: SEIRA; boron nitride; phonon polaritons; strong coupling; surface-enhanced infrared absorption spectroscopy.


Conflict of interest statement

R Hillenbrand is co-founder of Neaspec GmbH, a company producing scattering-type scanning near-field optical microscope systems, such as the one used in this study. The other authors declare no conflict of interests.

Figures

Figure 1
Figure 1
Numerical comparison between an h-BN and a Au resonator. (a and b) Sketches of the system designed for simulations: a h-BN (or Au) rod is placed on top of a CaF2 substrate and illuminated by a plane wave, with E-field being polarized along the main axis of the rod. (c and d) Extinction cross-section normalized to the geometrical cross-section for the h-BN (red) and the Au (blue) rod antenna without and with a 5-nm-thick layer of CBP on top, respectively. The full-wave electromagnetic simulations use the dielectric functions of Au, h-BN and CBP as described in the Materials and methods section. Note that for better comparison we scaled the h-BN antenna spectra by a factor 2.5. (e and f) frequency zoom-in (of c and d). Dashed lines in f represent calculated reference spectra for Au (blue) and h-BN (red) antennas, assuming a 5-nm-thick homogeneous dielectric layer with ε=ε=2.8 placed on top of the antennas. Gray areas highlight the spectral changes due to the interaction of the CBP vibration (C–H bond) with the plasmon-polariton resonance in the Au antenna and the phonon-polariton resonance in the h-BN antenna, respectively.
Figure 2
Figure 2
Far- and near-field spectroscopic characterization of h-BN ribbon arrays. (a) Sketch of the transmission spectroscopy experiment. Incoming light at normal incidence is polarized perpendicular to the ribbons to excite the HPhP resonance. (b) Transmission spectrum normalized to the bare substrate spectrum, T/T0, for a 20 × 20 μm2 h-BN ribbon array. Ribbon width w=158 nm, ribbon period D=400 nm and ribbon height h=40 nm. (c) Sketch of the nano-FTIR spectroscopy experiment. The near-field probing tip is scanned across (y-direction) the h-BN ribbon in 20-nm steps, as indicated by the dashed blue line. Near-field spectra are recorded as a function of the tip position (the detector signal is demodulated at the third harmonic of the tip tapping frequency, yielding s3(y, ω), as explained in the Materials and methods section). (d) Lower panel: Spectral line scan s3(y, ω), where each horizontal line corresponds to a spectrum recorded at a fixed y-position (vertical axis). Upper panel: Illustration of the real part of the z-component of the electric field (Re[Ez]) profile across the ribbon at the resonance frequency observed in the nano-FTIR spectra (lower panel).
Figure 3
Figure 3
Infrared transmission spectra of h-BN ribbon arrays with differently thick CBP coating. (a) Experimental transmission spectra of a 20 × 20 μm2 size h-BN ribbon array with period D=400 nm and ribbon width w=158 nm. The thick black curve shows the spectrum of bare h-BN ribbons. As a guide to the eye, it is repeatedly shown (gray cuves, shifted along the frequency axis) in the background of the spectra of the CBP-coated ribbon arrays. Red to blue curves show the spectra of CBP-covered h-BN ribbon arrays for increasing CBP thickness. The brown curves in the upper part of the graph show the spectra of a 100- and a 20-nm-thick bare CBP layer placed directly onto the substrate. (b) Simulated transmission spectra for a bare h-BN ribbon array (black curve, D=400 nm, w=167 nm), for a CBP-covered h-BN ribbon array (same color notation of a) and for a bare CBP layer (brown curves). The calculated spectrum for the bare ribbons is repeatedly shown in the background of the other spectra (gray curves, shifted along the frequency axis). The gray shaded areas visualize the difference between the gray and colored spectra.
Figure 4
Figure 4
Infrared spectroscopy of h-BN ribbon arrays with different ribbon widths. (a) Experimental relative transmission spectra of 43-nm-thick h-BN ribbon arrays with fixed period D=400 nm and variable width w. The red dotted lines represent Lorentzian fits. (b) Color plot shows simulated transmission spectra (vertical axis) for 43-nm-thick ribbon arrays as a function of w−1 (horizontal axis). The HPhP resonance dip asymptotically approaches the LO frequency as w−1 increases, as expected for HPhP volume modes. Green dots show the spectral dip positions obtained by the Lorentzian fits of a. Inset: Vertical electric near-field distribution normalized to the incident field for a ribbon resonator (Ez/|E0|). (c) Same measurements as in a but with 30-nm-thick CPB layer on top of the ribbon array. The red dotted lines represent fits using the classical coupled oscillator model. (d) Color plot shows simulated transmission spectra of the ribbon arrays covered with 30-nm-thick CPB layer. Green dots show the spectral dip positions obtained by Lorentzian fits of individual dips (see Supplementary Information). The black horizontal line indicates the CBP molecular vibrational resonance frequency. (e) Eigenmode frequencies ω± calculated from Equation (1), using the parameters obtained by the coupled oscillator fit of the spectra shown in c, plotted as a function of the bare HPhP resonance frequency ωHPhP obtained via the Lorentzian fits in a. Inset: Coupling strength g obtained by the coupled oscillator fit of the spectra shown in c. Horizontal dashed line marks average value.
Figure 5
Figure 5
Numerical study of strong coupling between HPhPs and molecular vibrations of CPB. Red and blue spectra show the calculated transmission for h-BN ribbon arrays with h=43 nm, D=400 nm and w=150 nm, without and with a 30-nm-thick CBP layer on top of the ribbons, respectively. Green and black spectra show the simulated absorption in the CBP layer (integrated over the whole layer thickness) on top of the ribbons and on the bare CaF2 substrate, respectively. The vertical gray dashed line marks the molecular C–H vibration frequency for the uncoupled case.

References

    1. Griffiths PR, de Haseth JA. Fourier Transform Infrared Spectrometry. Hoboken, NJ, USA: Wiley; 2007.
    1. Hartstein A, Kirtley JR, Tsang JC. Enhancement of the infrared absorption from molecular monolayers with thin metal overlayers. Phys Rev Lett 1980; 45: 201–204.
    1. Osawa M. Surface-enhanced infrared absorption. In: Kawata S, editor. Near-Field Optics and Surface Plasmon Polaritons. Berlin, Heidelberg, Germany: Springer; 2001, pp163–187.
    1. Neubrech F, Huck C, Weber K, Pucci A, Giessen H. Surface-enhanced infrared spectroscopy using resonant nanoantennas. Chem Rev 2017; 117: 5110–5145. - PubMed
    1. Aizpurua J, Taubner T, García de Abajo FJ, Brehm M, Hillenbrand R. Substrate-enhanced infrared near-field spectroscopy. Opt Express 2008; 16: 1529–1545. - PubMed