. 2018 Aug 15:7:53.
doi: 10.1038/s41377-018-0036-7. eCollection 2018.

Looking at sound: optoacoustics with all-optical ultrasound detection

Affiliations

Looking at sound: optoacoustics with all-optical ultrasound detection

Georg Wissmeyer et al. Light Sci Appl. .

Abstract

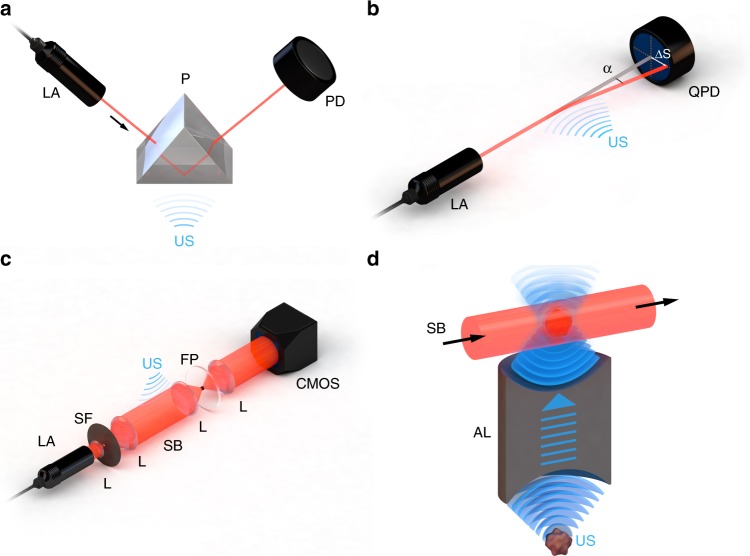
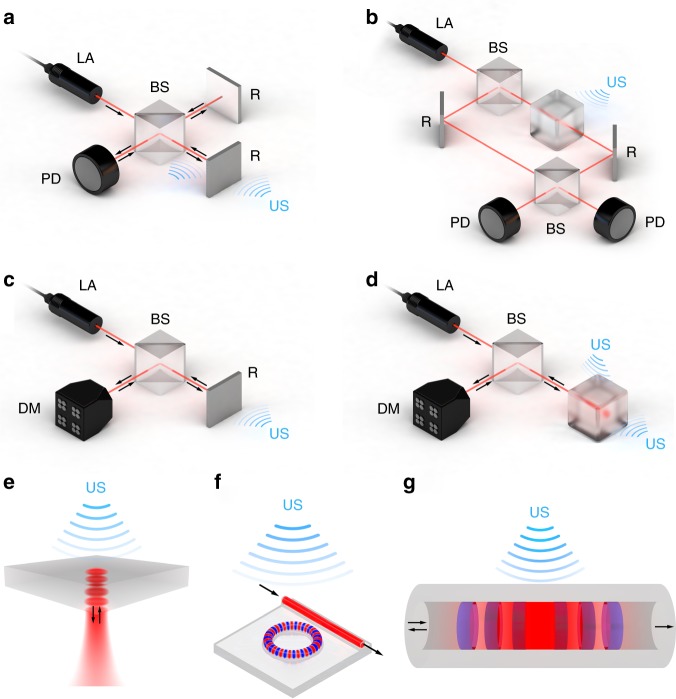
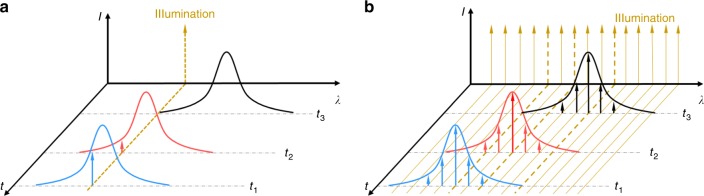
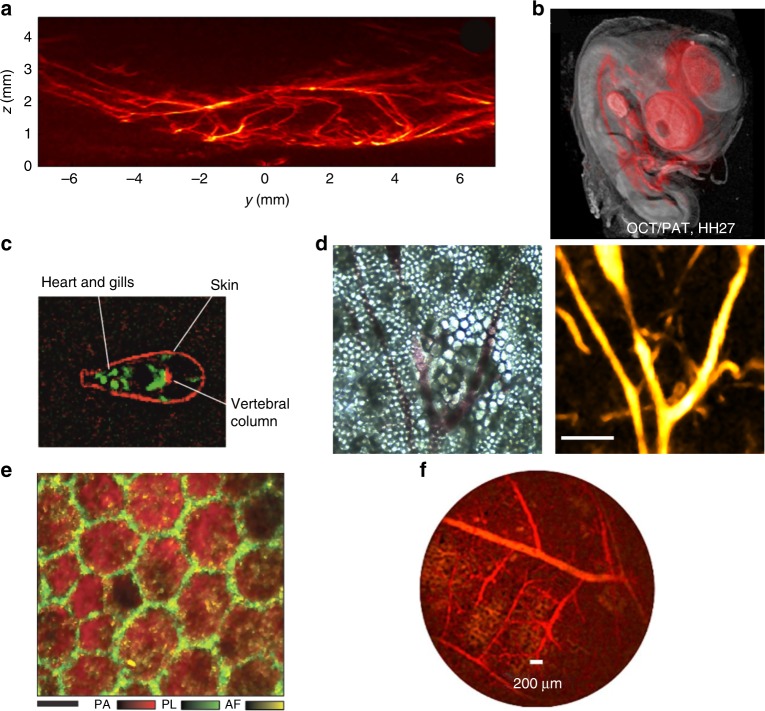
Originally developed for diagnostic ultrasound imaging, piezoelectric transducers are the most widespread technology employed in optoacoustic (photoacoustic) signal detection. However, the detection requirements of optoacoustic sensing and imaging differ from those of conventional ultrasonography and lead to specifications not sufficiently addressed by piezoelectric detectors. Consequently, interest has shifted to utilizing entirely optical methods for measuring optoacoustic waves. All-optical sound detectors yield a higher signal-to-noise ratio per unit area than piezoelectric detectors and feature wide detection bandwidths that may be more appropriate for optoacoustic applications, enabling several biomedical or industrial applications. Additionally, optical sensing of sound is less sensitive to electromagnetic noise, making it appropriate for a greater spectrum of environments. In this review, we categorize different methods of optical ultrasound detection and discuss key technology trends geared towards the development of all-optical optoacoustic systems. We also review application areas that are enabled by all-optical sound detectors, including interventional imaging, non-contact measurements, magnetoacoustics, and non-destructive testing.


Conflict of interest statement

The authors declare that they have no conflict of interest.

Figures

Fig. 1
Fig. 1. Refractometric ultrasound detectors.
a Intensity-sensitive detection of refractive index. b Single-beam deflectometry. c Phase-sensitive ultrasound detection with a Schlieren beam. d Phase-sensitive ultrasound detection with a decoupled optoacoustic source. AL acoustic lens, CMOS CMOS camera, FP Fourier plane, L lens, LA laser, P prism, PD photodiode, QPD quadrant photodiode, SB Schlieren beam, SF spatial filter, US ultrasound
Fig. 2
Fig. 2. Interferometric ultrasound detectors.
ad Sensing mechanisms: a phase detection in a Michelson interferometer, b phase detection in a Mach–Zehnder interferometer, c Doppler-based sensing, and d resonator-based sensing. The ultrasound wave is applied at a, b the beam path, a, c the reflector, or d the resonator. Detection is performed by either a, b photodetectors or c, d demodulators as described in section “Interferometric methods”. eg Common resonator geometries demonstrated for ultrasound sensing: e planar Fabry-Pérot, f micro-ring, and g π-phase shifted fiber Bragg grating. The optical beam and material of the resonators are red and gray, respectively, whereas the semi-periodic refractive index modulation that makes up the π-FBG is blue. The figure also depicts the standing-wave effect that exists in the Fabry-Pérot and micro-ring resonators, as well as the light localization around the π-phase shift of the π-FBG. BS beam splitter, D detector, DM demodulator, LA laser, R reflector, US ultrasound
Fig. 3
Fig. 3. Interrogation methods for optical resonators.
a In CW interferometry, an interrogation laser is tuned to a wavelength in which the optical spectrum of the interferometer or resonator is approximately linear at time t1, and the output power is monitored at time t2. External disturbances and high-amplitude acoustic signals reduce sensitivity and limit the dynamic range at time t3. b In pulse interferometry, the acoustically induced shift of the resonance spectrum is monitored by a broadband pulsed laser. Detecting the spectral shift with an optical demodulator provides high detection sensitivity and dynamic range and allows interrogation of multiple resonators (multiplexing)
Fig. 4
Fig. 4. Non-contact optoacoustic imaging based on all-optical sound detection.
a Optoacoustic tomography image of a hind mouse leg revealing dense microvasculature. Reproduced with permission from ref. . b Optical coherence tomography image of a chick embryo, overlaid with optical absorption contrast (red). Image size, 1.3 × 1.4 cm. Reproduced with permission from ref. . c Zebrafish imaged using pulse-echo, laser-induced ultrasound imaging (red) and optoacoustic tomography (green). Scale bar, 1 mm. Reproduced with permission from ref. . d Bright field (left) and optoacoustic microscopy images (right) of the same region of an ex vivo mouse ear, revealing complementary contrast. Scale bar, 150 µm. Reproduced with permission from ref. . e Human retinal pigment epithelium cells imaged with fluorescence microscopy (green) and optoacoustic microscopy (red). AF autofluorescence, PA photoacoustic maximum amplitude projection, PL phalloidin fluorescence. Scale bar, 10 µm. Reproduced with permission from ref. . f Optoacoustic tomography image of a duck embryo obtained with a setup that can be developed into a fiber-based, forward-looking optoacoustic proof-of-principle endoscope. Reproduced with permission from ref.
Fig. 5
Fig. 5. Magnetoacoustic sensing of magnetic nanoparticles.
a Experimental setup in which a π-FBG-based acoustic sensor is inserted into a magnetic induction coil together with the sample. Demod demodulator, EFDA erbium-doped fiber amplifier, F optical filters, S optical splitter. b Acoustic spectra of Fe3O4 nanoparticles measured at an excitation frequency of 1.1604 MHz as a result of acoustic coupling between the sample and the sensor. The frequency-doubled signal S1 (red) differs from the recorded noise (blue), confirming that the signal is not due to electromagnetic interference. Reproduced from ref.
Fig. 6
Fig. 6. Non-destructive testing of a carbon-fiber-reinforced polymer.
a Top-view photograph of a 32-layer, fiber-reinforced polymer structure with a defect at its center resulting from a standardized 50-J impact (ASTM D7136). Sample size, 65 × 65 mm. b Laser ultrasonic image of the same area of the reinforced polymer reveals propeller-shaped damage below the sample surface. Reproduced with permission from ref.

References

    1. Taruttis A, Ntziachristos V. Advances in real-time multispectral optoacoustic imaging and its applications. Nat. Phot. 2015;9:219–227.
    1. Wang LV, Hu S. Photoacoustic tomography: in vivo imaging from organelles to organs. Science (80-) 2012;335:1458–1462. - PMC - PubMed
    1. Ntziachristos V. Going deeper than microscopy: the optical imaging frontier in biology. Nat. Methods. 2010;7:603–614. - PubMed
    1. Beard P. Biomedical photoacoustic imaging. Interface Focus. 2011;1:602–631. - PMC - PubMed
    1. Xu M, Wang LV. Photoacoustic imaging in biomedicine. Rev. Sci. Instrum. 2006;77:1–22.