

Assessing the utility of the tipping point ratio to monitor HIV treatment programmes in the era of universal access to ART
- PMID: 30839944
- PMCID: PMC6326263
- DOI: 10.1016/j.idm.2018.03.005
Assessing the utility of the tipping point ratio to monitor HIV treatment programmes in the era of universal access to ART
Abstract
Background: The epidemiological tipping point ratio (TPR) has been suggested as a useful indicator to monitor the scale-up of antiretroviral treatment (ART) programmes and determine when scale-up is sufficient to control the epidemic. TPR has been defined as the ratio of yearly number of new HIV infections to the yearly number of new ART initiations or to the yearly net increase in the number of people on ART. It has been used to rank the progress of treatment programmes across countries, with the objective of reaching a TPR value under 1. Our study aims to assess if TPR alone can be used as an indicator of ART success across settings by comparing the expected changes in HIV incidence and ART coverage when TPR is maintained constant over time. In particular, we focus on the effect of ART initiation timing (emphasis on ART being initiated early or late during HIV progression) on the interpretation of the TPR.
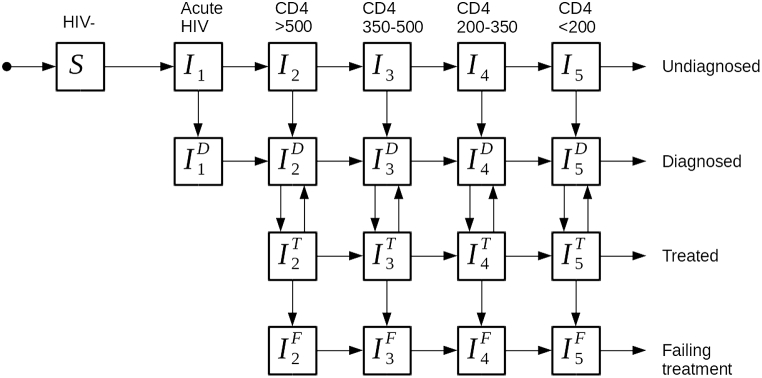
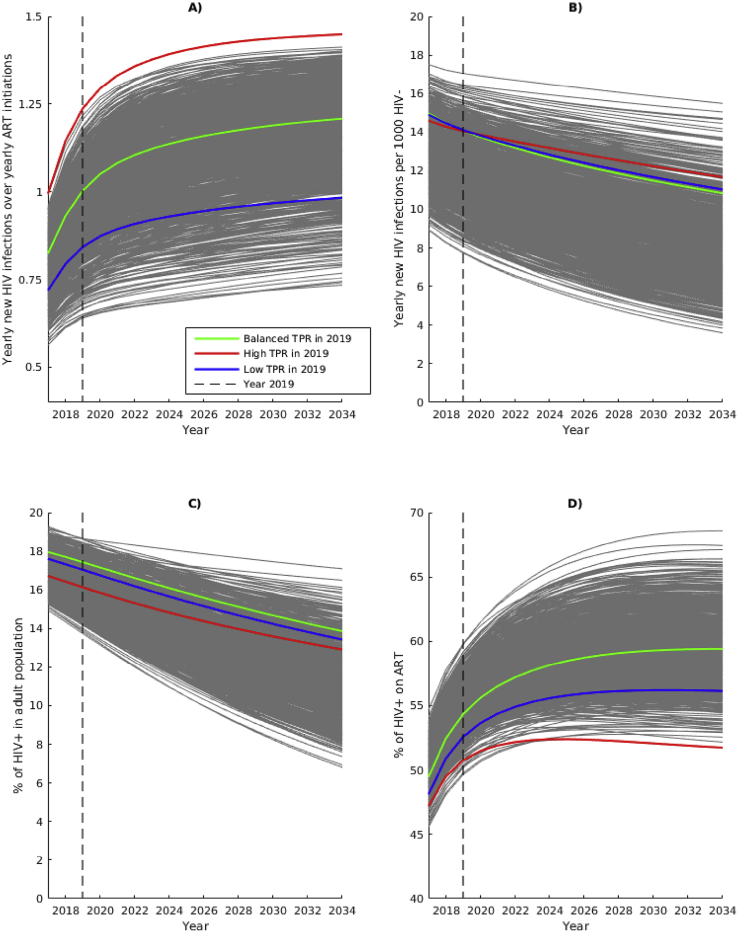
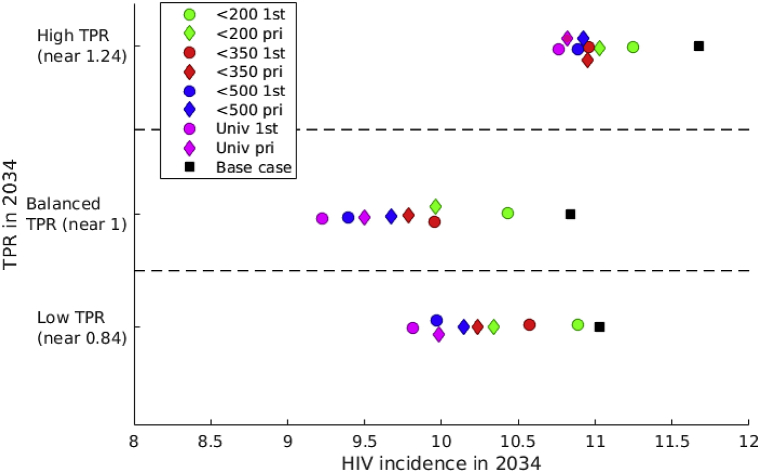
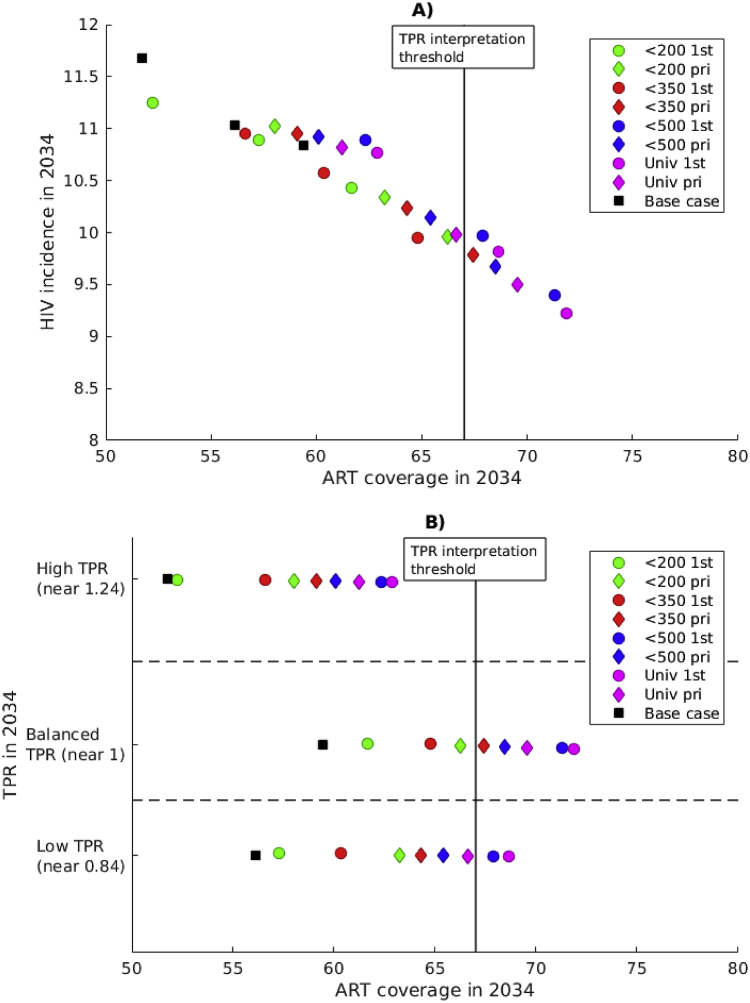
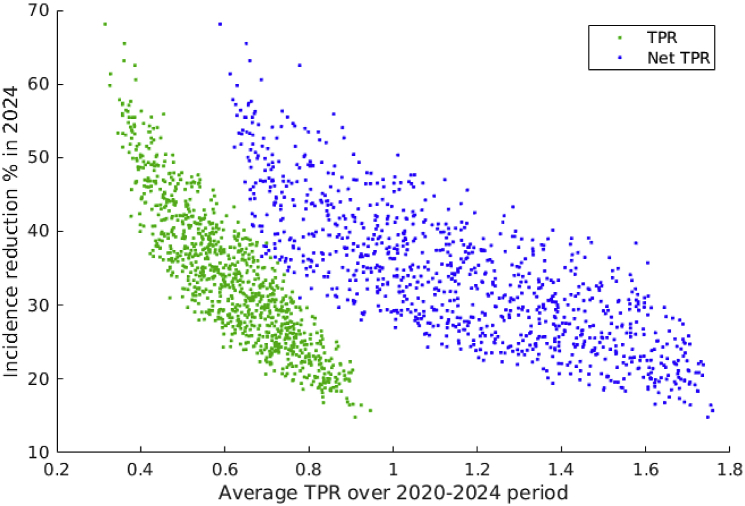
Methods: We used a dynamic model of HIV transmission in South Africa representing ART rollout leading to universal treatment in 2017. The model is calibrated to HIV incidence, HIV prevalence and ART coverage in 2012 in South Africa, and 1000 simulations are selected for the base-case scenario. To measure the effect of TPR, we simulate TPR-preserving interventions, maintaining TPR (yearly number of new ART initiations denominator) at the value observed in 2019 (between 0.65 and 1.25) for 15 years. We compare ART coverage and HIV incidence across TPR values and across strategies in which ART access is prioritized differently. In a secondary analysis, we illustrate the sensitivity of new ART initiations to ART retention, and we compare both definitions of the TPR.
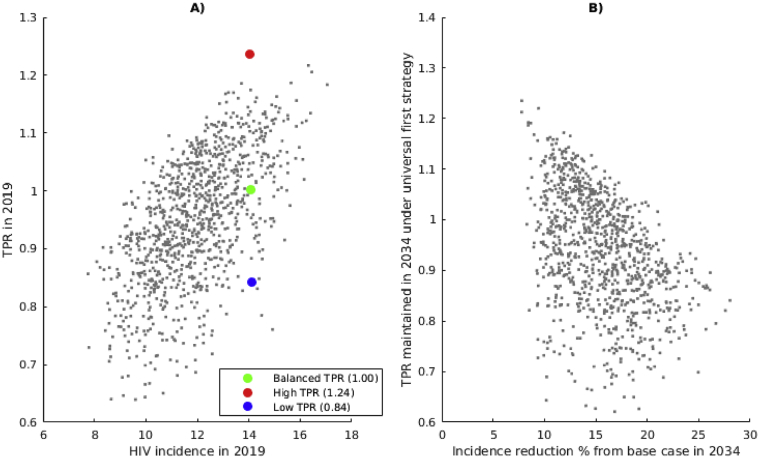
Results: Our analysis shows that HIV incidence reduction is weakly correlated to TPR: the same reduction in HIV incidence (15%) can be achieved by implementing the same strategy with a wide range of TPR maintained (0.65-1.12). Assuming high retention in ART, TPR-preserving strategies prioritizing early ART initiation yield greater reduction in HIV incidence than strategies where most individuals initiate ART late. High ART coverage is associated with low HIV incidence and it can be reached with a TPR below or equal to one with strategies favoring early ART initiation. Low ART retention over time results in higher HIV incidence even if TPR is maintained low. If ART retention is low, strategies prioritizing late ART initiation are associated with lower HIV incidence than strategies where ART is initiated early. Maintaining a fixed TPR value based on the net increase in people on ART gives higher HIV incidence reduction and requires fast ART scale-up.
Conclusion: Our analysis suggests that the TPR is not an adequate indicator of ART programme impact, without information on ART coverage and retention. Achieving early initiation and adherence to treatment to improve ART coverage might be as important as attaining a specific TPR target. Comparisons of TPR in different settings should account for differences in epidemic conditions.
Keywords: Antiretroviral treatment; HIV; Mathematical modeling; Tipping point.
Figures
References
-
- Bass E., de Lacy Donaldson E., Fisher K., Warren M. The tipping Point: Moving from rhetoric to real milestones for ending. AIDS. 2014 http://www.avac.org/sites/default/files/infographics/TippingPointPosterR... Accessed 29-08-16.
-
- Coggin W. 19th core group meeting of the global TB/HIV working group. WHO; 2014. TB/HIV in the Blueprint for an AIDS-free generation.http://www.who.int/tb/challenges/hiv/tb-hiv_in_the_blueprint_for_an_aids... Accessed 1-12-17.
