. 2019 May 1;121(5):1761-1777.
doi: 10.1152/jn.00807.2018. Epub 2019 Mar 6.

Basolateral amygdala neurons are activated during threat expectation

Affiliations

Basolateral amygdala neurons are activated during threat expectation

Alon Amir et al. J Neurophysiol. .

Abstract

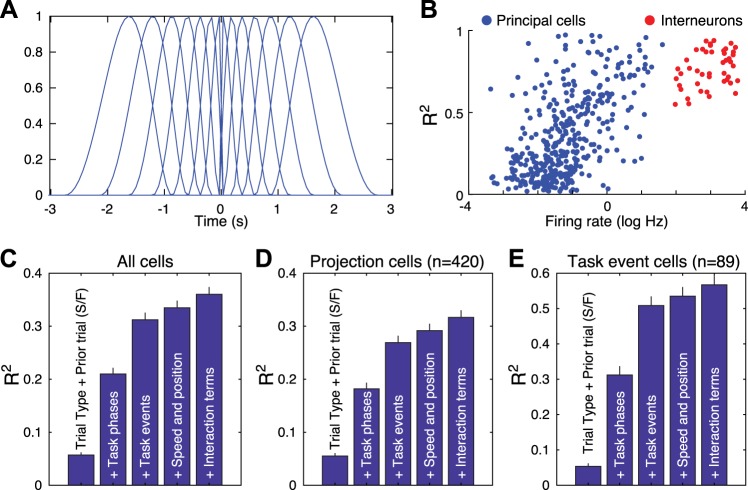
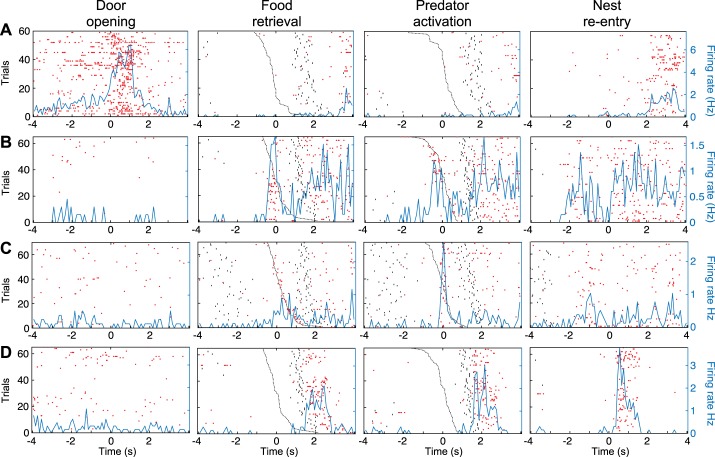
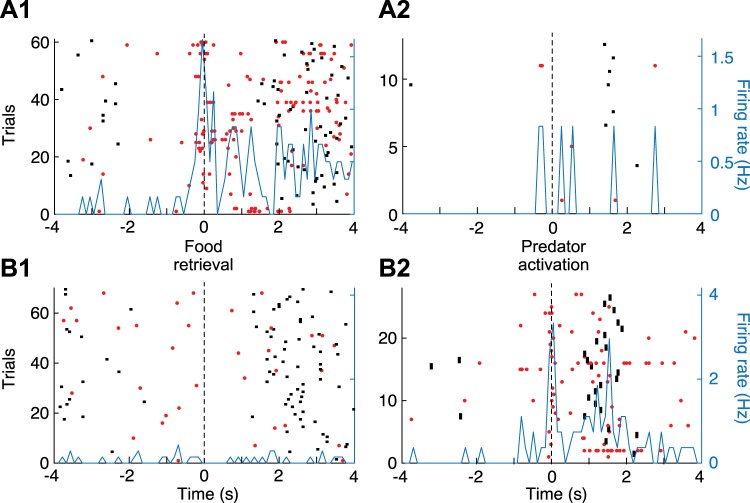
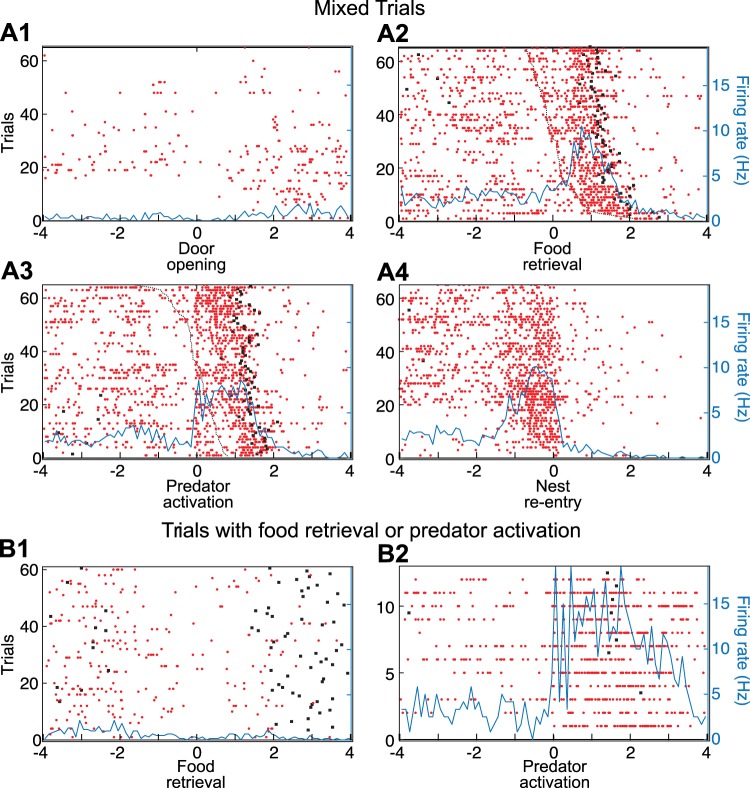
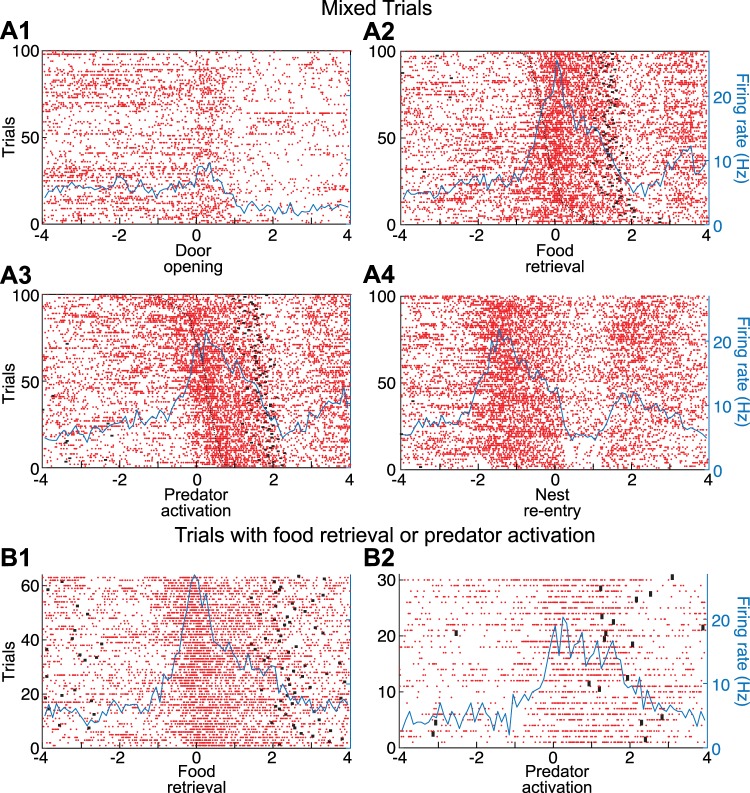
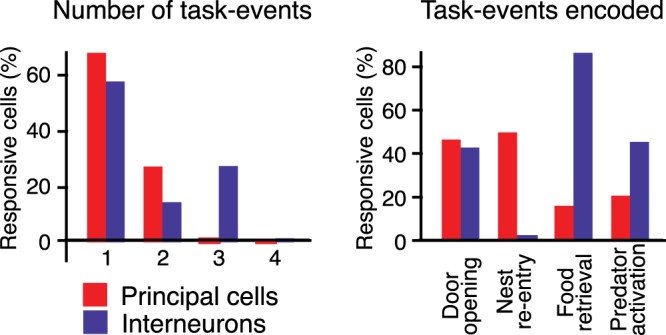
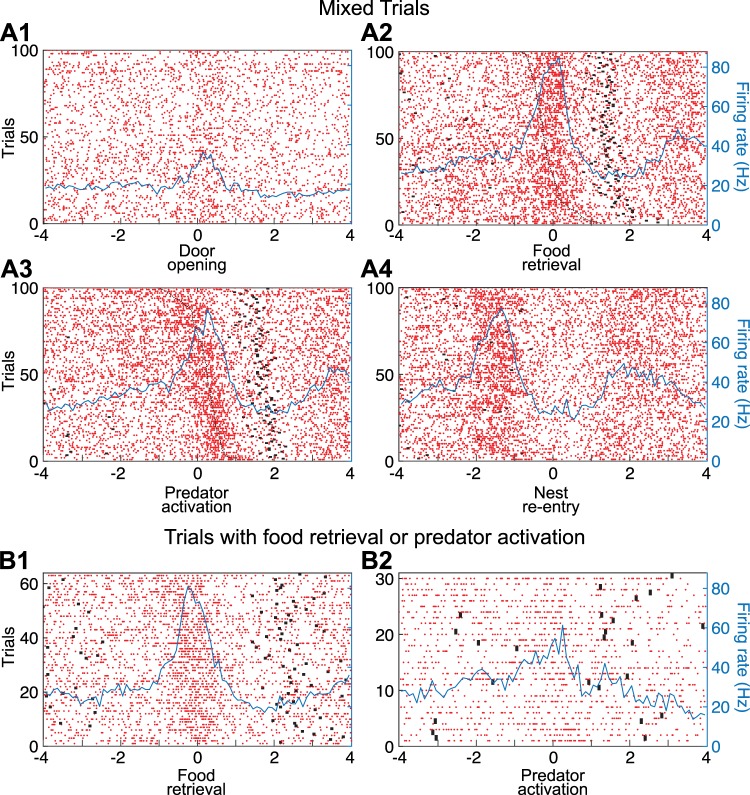
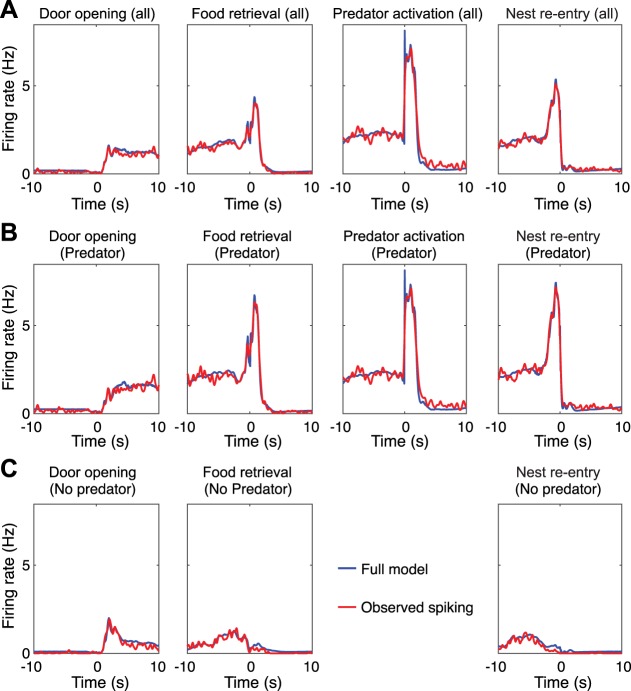
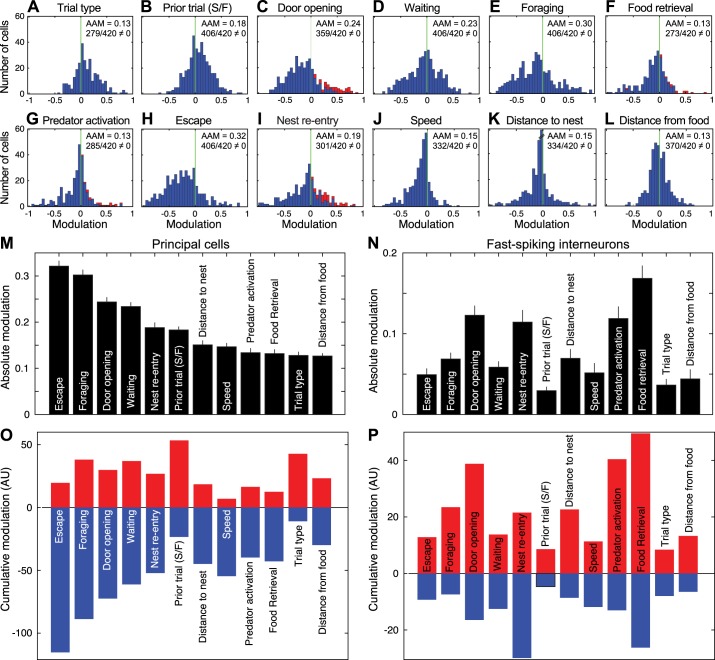
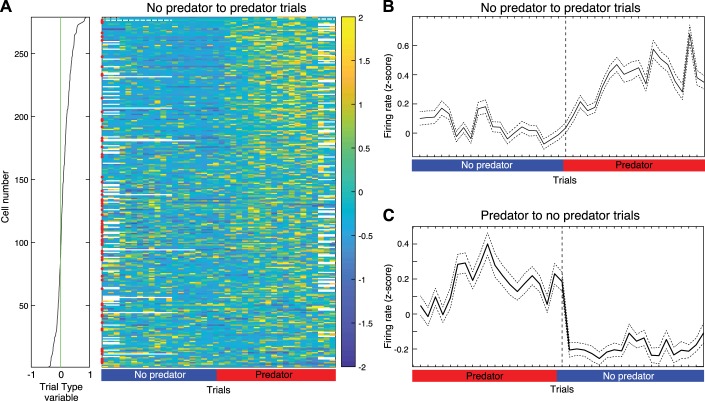
Fear conditioning studies have led to the view that the amygdala contains neurons that signal threat and in turn elicit defensive behaviors through their brain stem and hypothalamic targets. In agreement with this model, a prior unit-recording study in rats performing a seminaturalistic foraging task revealed that many lateral amygdala (LA) neurons are predator responsive. In contrast, our previous study emphasized that most basolateral (BL) amygdala neurons are inhibited at proximity of the predator. However, the two studies used different methods to analyze unit activity, complicating comparisons between them. By applying the same method to the sample of BL neurons we recorded previously, the present study revealed that most principal cells are inhibited by the predator and only 4.5% are activated. Moreover, two-thirds of these cells were also activated by nonthreatening stimuli. In fact, fitting unit activity with a generalized linear model revealed that the only task variables associated with a prevalent positive modulation of BL activity were expectation of the predator's presence and whether the prior trial had been a failure or success. At odds with the threat-coding model of the amygdala, actual confrontation with the predator was usually associated with a widespread inhibition of principal BL neurons. NEW & NOTEWORTHY The basolateral amygdala (BL) is thought to contain neurons that signal threat, in turn eliciting defensive behaviors. In contrast, the present study reports that very few principal BL cells are responsive to threats and that most of them are also activated by nonthreatening stimuli. Yet, expectation of the threat's presence was associated with a prevalent positive modulation of BL activity; actual confrontation with the threat was associated with a widespread inhibition.

Keywords: amygdala; fear; foraging; predator; threat.


Conflict of interest statement

No conflicts of interest, financial or otherwise, are declared by the authors.

Figures

Fig. 1.
Fig. 1.
A: basis functions. B: correlation between R2 and firing rates in all principal neurons (PNs; blue, n = 420) and presumed interneurons (red; n = 45). C–E: impact of sequentially adding different classes of variables on R2 in all cells (C; n = 465), only PNs (D: n = 420), or only PNs responsive to task events (E; n = 89). Prior trial (S/F) indicates prior trial success and failure. The increases in R2 values caused by adding the various classes of variables were all significant. Friedman one-way ANOVAs revealed χ2 ranging between 1,110 and 1,637, with P values <3.4e10−239. Dunn’s tests revealed that all differences were significant at P < 0.01 for the 3 sets of cells.
Fig. 2.
Fig. 2.
Examples of units specifically activated by only one task event. A–D: data for 4 different principal neurons (PNs), respectively, are spike rasters (red dots) and superimposed perievent time histograms (PETHs) of neuronal discharges (blue lines) referenced to the event listed at top of each column. In second column, raster trials were rank ordered by latency of predator activation (black dashed line). In third column, raster trials were rank ordered by latency of food retrieval (black dashed line). Black dots before or after time 0 in the PETHs mark when rats started foraging (left of origin) or reentered the nest (right of origin).
Fig. 3.
Fig. 3.
Principal neurons (PNs) activated at the time of food retrieval or predator activation. A: PN activated at the time of food retrieval but not predator activation (same unit as in Fig. 1B). B: different PN activated at the time of predator activation but not food retrieval. Data are spike rasters (red dots) and superimposed perievent time histograms (PETHs) of neuronal discharges (blue lines). A1 and B1: trials with food retrieval but no predator activation. PETH is referenced to the time of food retrieval. A2 and B2: trials with predator activation but no food retrieval. PETH is referenced to the time of predator activation. Black dots before or after time 0 in the PETHs mark when rats started foraging (left of origin) or reentered the nest (right of origin).
Fig. 4.
Fig. 4.
Principal neuron (PN) with complex responsiveness. Data are spike rasters (red dots) and superimposed perievent time histograms (PETHs) of neuronal discharges (blue lines). A: PETHs of neuronal discharges referenced to the time of door opening (A1), food retrieval (A2), predator activation (A3), or reentry into the nest (A4). B1: trials with food retrieval but no predator activation. PETH is referenced to the time of food retrieval. B2: trials with predator activation but no food retrieval. PETH is referenced to the time of predator activation. In A2, raster trials were rank ordered by latency of predator activation (black dashed line). In A3, raster trials were rank ordered by latency of food retrieval (black dashed line). Black dots before or after time 0 in the PETHs mark when rats started foraging (left of origin) or reentered the nest (right of origin).
Fig. 5.
Fig. 5.
PN responsive to 3 of the 4 task events. Data are spike rasters (red dots) and superimposed perievent time histograms (PETHs) of neuronal discharges (blue lines). A: PETHs of neuronal discharges referenced to the time of door opening (A1), food retrieval (A2), predator activation (A3), or reentry into the nest (A4). B1: trials with food retrieval but no predator activation. PETH is referenced to the time of food retrieval. B2: trials with predator activation but no food retrieval. PETH is referenced to the time of predator activation. In A2, raster trials were rank ordered by latency of predator activation (black dashed line). In A3, raster trials were rank ordered by latency of food retrieval (black dashed line). Black dots before or after time 0 in the PETHs mark when rats started foraging (left of origin) or reentered the nest (right of origin).
Fig. 6.
Fig. 6.
Contrasting responsiveness of principal neurons (PNs) and interneurons (ITNs). Left: proportion of responsive units (y-axis) that increased their activity in relation to 1, 2, 3, or 4 task events. Red, PNs; blue, ITNs. Right: proportion of units (y-axis) responding to the task events listed along the x-axis.
Fig. 7.
Fig. 7.
Interneuron (ITN) with complex responsiveness. Data are spike rasters (red dots) and superimposed perievent time histograms (PETHs) of neuronal discharges (blue lines). A: PETHs of neuronal discharges referenced to the time of door opening (A1), food retrieval (A2), predator activation (A3), or reentry into the nest (A4). B1: trials with food retrieval but no predator activation. PETH is referenced to the time of food retrieval. B2: trials with predator activation but no food retrieval. PETH is referenced to the time of predator activation. In A2, raster trials were rank ordered by latency of predator activation (black dashed line). In A3, raster trials were rank ordered by latency of food retrieval (black dashed line). Black dots before or after time 0 in the PETHs mark when rats started foraging (left of origin) or reentered the nest (right of origin). Note that for clarity, we depict only 1 of 5 spikes. Illustrated spikes were selected randomly.
Fig. 8.
Fig. 8.
Generalized linear model (GLM)-estimated coding of a principal neuron (PN). A–C: observed (red lines) and predicted (blue lines) firing of a PN during all available trials (A), only predator trials (B), or only no-predator trials (C). In A–C, the plots from left to right show observed and estimated activity around door opening, food retrieval, predator activation, and nest reentry.
Fig. 9.
Fig. 9.
Generalized linear model (GLM)-estimated coding of 12 variables by principal neurons (PNs). A–L: frequency distributions of firing modulation (x-axis) in relation to 12 different variables. Red bars represent units that showed statistically significant increases in firing rates, as determined using standard analyses: red bars in C correspond to 42 units responsive to door opening, in F to 15 units responsive to food retrieval, in G to 19 units responsive to predator activation, and in I to 45 units responsive to nest reentry. In B, S/F indicates prior trial success and failure. For each variable, the average absolute modulation (AAM) and the number of units with modulation different from 0 are listed at top right. Units with modulation values of 0 are not included in the histograms. M and N: GLM variables rank ordered by absolute firing rate modulation magnitude in PNs (M; n = 420) and interneurons (ITNs; N; n = 45), both ordered based on the rank of PNs. Values are averages ± SE. O and P: sum of positive (red) and negative (blue) modulations in PNs (O) and ITNs (P). AU, arbitrary units.
Fig. 10.
Fig. 10.
Change in unit activity at transitions between trial blocks. Units were rank ordered (A) on the basis of their modulation by the trial type variable (see Fig. 9A). Their average firing rate during the baseline and waiting phases was then plotted trial by trial (x-axis) around transitions between trial blocks from no-predator to predator trials (A and B) and from predator to no-predator trials (C). In A, firing rate is z-scored and color coded (bar at right). Red dots on the left of the central panel mark event cells. In B and C, solid lines are average firing rate of all available units; dashed lines are SE.

References

    1. Aitta-Aho T, Hay YA, Phillips BU, Saksida LM, Bussey TJ, Paulsen O, Apergis-Schoute J. Basal forebrain and brainstem cholinergic neurons differentially impact amygdala circuits and learning-related behavior. Curr Biol 28: 2557–2569.e4, 2018. doi:10.1016/j.cub.2018.06.064. - DOI - PubMed
    1. Amir A, Headley DB, Lee SC, Haufler D, Paré D. Vigilance-associated gamma oscillations coordinate the ensemble activity of basolateral amygdala neurons. Neuron 97: 656–669.e7, 2018. doi:10.1016/j.neuron.2017.12.035. - DOI - PMC - PubMed
    1. Amir A, Lee SC, Headley DB, Herzallah MM, Pare D. Amygdala signaling during foraging in a hazardous environment. J Neurosci 35: 12994–13005, 2015. doi:10.1523/JNEUROSCI.0407-15.2015. - DOI - PMC - PubMed
    1. Barthó P, Hirase H, Monconduit L, Zugaro M, Harris KD, Buzsáki G. Characterization of neocortical principal cells and interneurons by network interactions and extracellular features. J Neurophysiol 92: 600–608, 2004. doi:10.1152/jn.01170.2003. - DOI - PubMed
    1. Bindi RP, Baldo MV, Canteras NS. Roles of the anterior basolateral amygdalar nucleus during exposure to a live predator and to a predator-associated context. Behav Brain Res 342: 51–56, 2018. doi:10.1016/j.bbr.2018.01.016. - DOI - PubMed

Publication types

LinkOut - more resources