

Adult body weight trends in 27 urban populations of Brazil from 2006 to 2016: A population-based study
- PMID: 30840675
- PMCID: PMC6402686
- DOI: 10.1371/journal.pone.0213254
Adult body weight trends in 27 urban populations of Brazil from 2006 to 2016: A population-based study
Abstract
Objective: We aimed to estimate trends in population-level adult body weight indicators in the 26 state capitals and the Federal District of Brazil.
Methods: Self-reported weight and height data of 572,437 adults were used to estimate the mean body mass index (BMI), and the prevalence of BMI categories ranging from underweight to morbid obesity, in Brazil's state capitals and Federal District, from 2006 to 2016, by sex. All estimates were standardized by age.
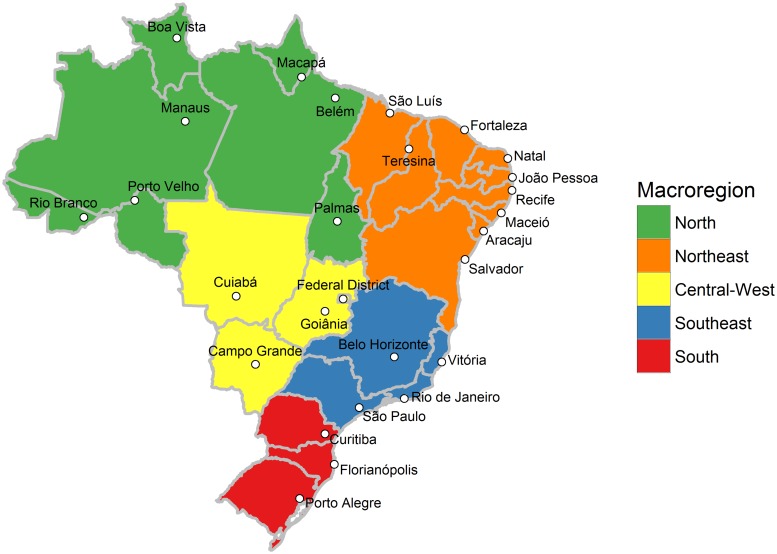
Results: From 2006 to 2016, the main findings showed that: (i) the overall mean BMI increased from 25.4 kg/m2 to 26.3 kg/m2 in men, and from 24.5 kg/m2 to 25.8 kg/m2 in women; (ii) the overall prevalence of overweight increased from 48.1% to 57.5% in men, and from 37.8% to 48.2% in women; (iii) the overall prevalence of obesity increased from 11.7% to 18.1% in men, and from 12.1% to 18.8% in women; (iv) in general, the largest increases in overweight and obesity prevalence were found in state capitals located in the north, northeast, and central-west regions of Brazil; (v) the prevalence of severe obesity surpassed the prevalence of underweight in 22 and 9 state capitals among men and women, respectively; and (vi) the mean BMI trend was stable only in Vitória state capital in men.
Conclusions: The policies for preventing and treating obesity in Brazil over the past years were not able to halt the increase in obesity prevalence either in the state capitals or the Federal District. Thus, a revision of policies is warranted. Furthermore, although policies are necessary in all state capitals, our results suggest that policies are especially necessary in the north, northeast, and central-west regions' state capitals, where, in general, the largest increases in overweight and obesity prevalence were experienced.
Conflict of interest statement
The authors have declared that no competing interests exist.
Figures


References
-
- Uzogara SG. Underweight, the less discussed type of unhealthy weight and its implications: a review. American Journal of Food Science and Nutrition Research. 2016; 3(5): 126–142.
-
- Dobbs R, Sawers C, Thompson F, Manyika J, Woetzel J, Child P, et al. Overcoming obesity: An initial economic analysis London: McKinsey Global Institute; 2014.
-
- Ng M, Fleming T, Robinson M, Thomson B, Graetz N, Margono C, et al. Global, regional, and national prevalence of overweight and obesity in children and adults during 1980–2013: a systematic analysis for the Global Burden of Disease Study 2013. Lancet. 2014; 384(9945): 766–781. 10.1016/S0140-6736(14)60460-8 - DOI - PMC - PubMed
Publication types
MeSH terms
LinkOut - more resources
Full Text Sources
Medical
Miscellaneous
